Introduction
Knowledge of the nature and distribution of ground ice in Antarctica as well as thermal characteristics of permafrost and their relationships with present and past climates is still poor (Reference BockheimBockheim, 1995). Notwithstanding the well-known sensitivity of permafrost to climate changes and its capacity to preserve a good record of past climatic history, the number of papers concerning these topics in Antarctica is still small: some of them describe permafrost-related periglacial landforms such as rock glaciers (Reference Barsch, Blumel, Flugel, Mausbacher, Stablein and ZickBarsch and others, 1985), patterned ground (Reference Black, Berg and AdieBlack and Berg, 1964; Reference Zhang, Oliver, James and JagoZhang, 1983; Reference Baroni and OrombelliBaroni and Orombelli, 1987a, Reference Baroni and Orombellib, Reference Baroni and Orombelli1988; Reference Chinn, Whitehouse and HofleChinn and others, 1989; Reference Meneghel, Orombelli and SmiragliaMeneghel and others, 1994; Reference Serrano, Martinez de Pison, Lopez-Martinez, Lopez-Martinez, Thomson and ThomsonSerrano and others, 1996), ice wedges (Reference Kato, Corte and FukudaKato and others, 1990) and pingos (Reference PickardPickard, 1983), while only a few (Reference Barsch, Blumel, Flugel, Mausbacher, Stablein and ZickBarsch and others, 1985; Reference Fournier, Buk and CorteFournier and others, 1990; Reference Guglielmin, Biasini and SmiragliaGuglielmin and others, 1997a, b) report the results of geophysical investigations.
A possible reason for this scarcity of interest is the relative paucity of ice-free areas (approximately 2% of the Antarctic continent, mostly concentrated along the Trans-antarctic Mountains and on the Antarctic Peninsula). In absolute terms, however, ice-free surfaces are very extensive (about 280 000 km2), and the information preserved in the ground may be considered of inestimable value for understanding the climatic evolution of the planet in recent geological times.
In fact, permafrost investigations may contribute to palaeoclimatic reconstructions in different ways and at different temporal scales. At seasonal and annual scales permafrost reacts to climate changes modifying the thickness of the active layer thickness according to the expression

where h (cm) is the active layer thickness, a is the thermal diffusivity of the ground, P is the annual temperature wave, A0 is the amplitude of the annual temperature wave and T0 is the mean annual ground-surface temperature (Reference French and ClarkFrench, 1988). At larger temporal scales (decades, centuries and millennia), the thermal profile of permafrost below the zero annual amplitude may provide records of surface temperature changes according to the heat-conduction theory (Reference Carslaw and JaegerCarslaw and Jaeger; 1959; Lachenbruch and others, 1988), whereas at millennia scales the thickness of the permafrost itself may undergo substantial changes. Moreover, since permafrost may be considered by definition a stationary, conservative system (Reference Lachenbruch, Cladouhos, Saltus and SennesetLachenbruch and others, 1990) it may preserve relics of continental or marine ice as well as frozen water produced in past climatic conditions which may be evaluated by isotopic (^180) analysis. Ground ice may also contain organic materials or volcanic ash which may be radiometncally dated.
This paper discusses the results of investigations on permafrost and ground ice carried out in northern Victoria Land, Antarctica, within the Italian Research Programme on Antarctica. Methods used to investigate permafrost distribution include geomorphological surveys and mapping, and geoelectrical soundings on ice-free lands. To identify the nature of the ground ice (previously detected by geoelectrical soundings), trenches were dug with the aid of a motodrill. Shallow boreholes were also drilled (to a maximum depth of-3.6 m) in massive buried ice with a specially adapted ice sampler. Chemical (CF, N02, SO42-, Na+, K+, Ga2+, Mg2 + , conductivity, pH), isotopic («5180) and crystallography laboratory analyses were carried out on samples of both ice-poor permafrost and massive ice.
Study Area
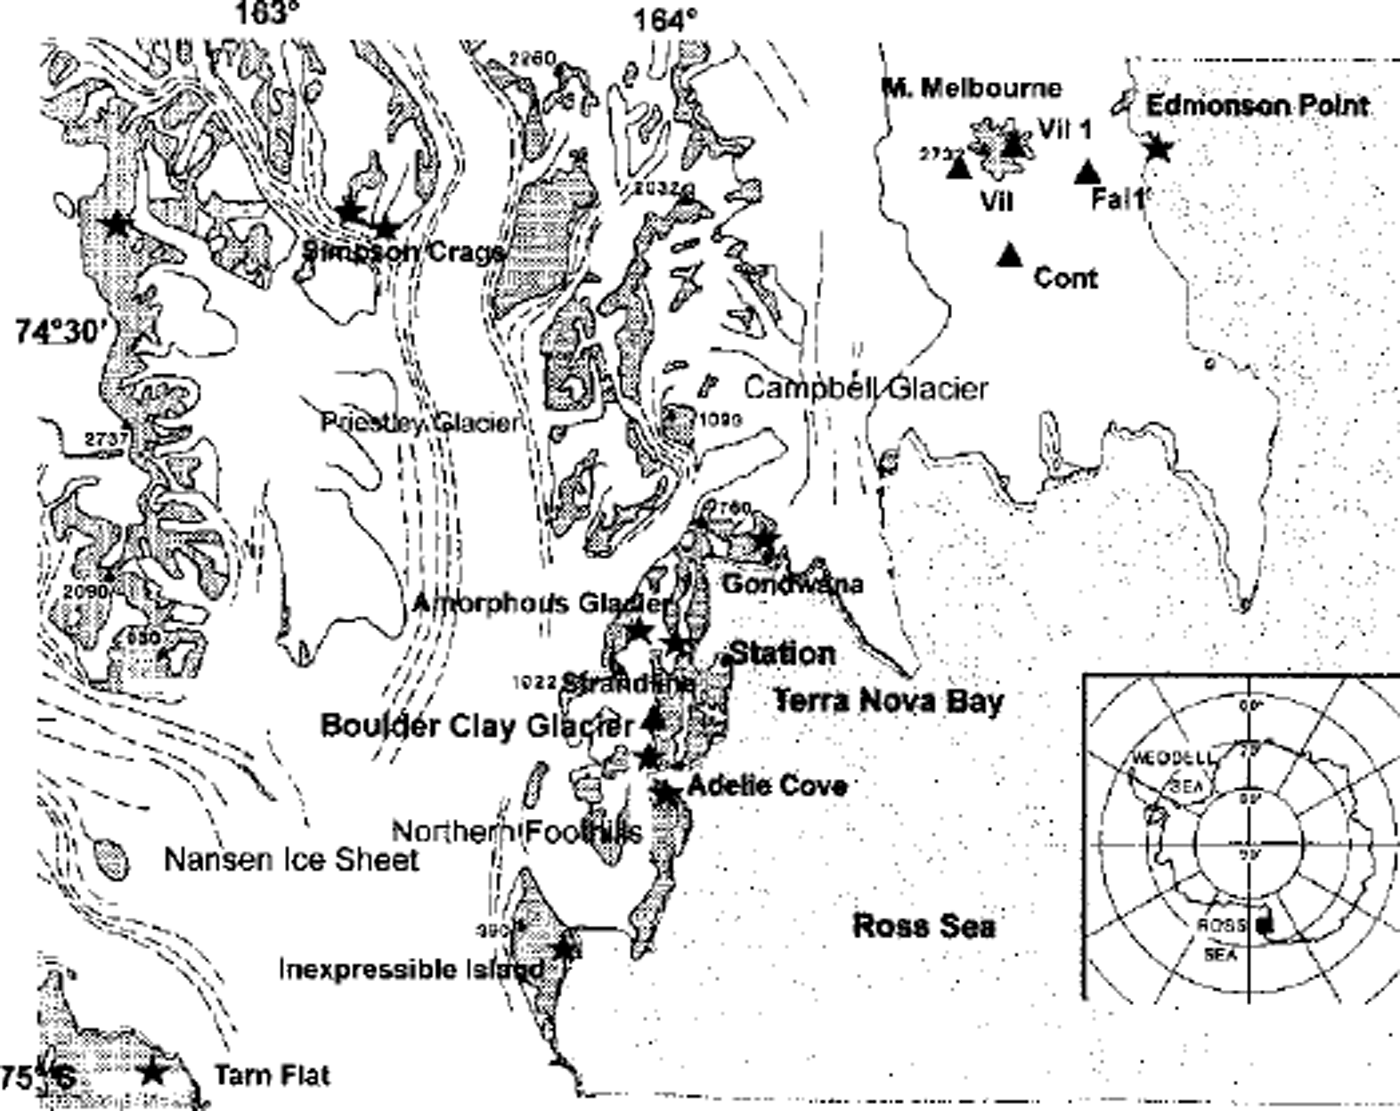
The study area is located in the interior of northern Victoria Land, between Nansen Ice Sheet to the south and Mount Melbourne (2732 ma.s.l.) to the northeast (Fig. 1). In this part of northern Victoria Land, the ice-free areas are predominantly distributed along the coast (Inexpressible Island, Northern Foothills, Edmonson Point) and along Priestley Glacier (Simpson Crags). The upper part of Mount Melbourne and the area of Tarn Flat southwest of Nansen Ice Sheet are also ice-free.
The study area showing the location of thermal monitoring stations (triangles) and geoelectrical soundings (stars).
Some periglacial landforms such as rock glaciers or patterned grounds have been reported in Reference Baroni and OrombelliBaroni and Orombelli (1987a, Reference Baroni and Orombelli1988), Reference Chinn, Whitehouse and HofleChinn and others (1989) and Reference Meneghel, Orombelli and SmiragliaMeneghel and others (1994).
The investigation sites were chosen on the basis of these previous studies and new geomorphological surveys. The locations of geophysical investigation sites, boreholes and ground-temperature monitoring stations are shown in Figure 1.
Geoelectrical Investigations, Boreholes and Trenches
The electrical resistivity of the ground depends upon its mineralogical composition, particle-size distribution, and above all, water/ice content, salt content and temperature.
Two different types of arrays were used for each sounding site: the symmetric Schlumberger quadripole vertical electrical soundings (VES) and the Wenner quadripole. The VES allows vertical electrical sections to be obtained relative to the centre of the quadripole, whereas the Wenner quadripole allows us to obtain an electrical section along a particular transect. All the investigations were carried out with an E2 Digit georesistivimeter, manufactured by PASI (Turin, Italy).
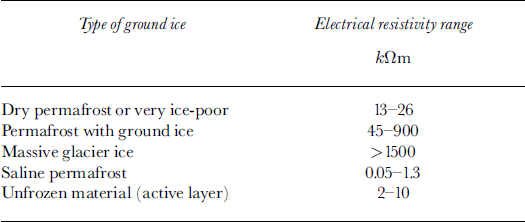
Different types of frozen ground were recognised by electrical prospecting in the ice-free areas covered by glacial drift or by beach deposits (Table 1). For dry or very ice-poor permafrost, resistivity ranged from 13 to 26 kttm. For permafrost with different ice percentages resistivity ranged from 45 to 900 kΩm, whereas for massive glacial ice resistivity was >1500kttm. Saline permafrost, generally distributed below present sea level, showed values of 0.05-1.3 kΩm, i.e. much lower than those found for unfrozen ground (active layer) (2-10 kΩm).
Types of ground ice and detected electrical resistivity
Recognition of massive continental glacier ice (Boulder Clay and Amorphous Glaciers) and sea-ice bodies buried in the ice-free areas allows the position of the palaeo-ground-ing line of the Ross Ice Sheet to be reconstructed.
Information about the age of deglaciation of areas with permafrost ground ice may be derived from the depth of dry permafrost, which is expected to be directly correlated with the time of sublimation of the ice-free ground surface (Reference Campbell, Claridge, Campbell and BalksCampbell and others, 1998). However, further data need to be collected to properly test this hypothesis.
One of the most interesting results obtained by VES investigations is that similar landforms may sometimes correspond to different inner structures. In fact, the debris-covered Amorphous Glacier is clearly characterised by a 65 m thick ice core. Yet the debris-covered Boulder Clay Glacier shows lower electrical resistivity which does not permit clear-cut interpretation since it is impossible, on the basis of resistivity values reported in the literature, to correlate the VES values with either glacier continental ice or permafrost very rich in ice (Reference Guglielmin, Biasini and SmiragliaGuglielmin and others, 1997a).
The rock glaciers investigated also displayed different structures and resistivity readings. The Strandline rock-glacier readings were clearly indicative of an ice-cemented rock glacier since the highest ice content was found in the top layers near the permafrost table, and ice content decreased with increasing depth. In contrast, rock glaciers located on the coast of Adélie Cove have a core with very high resistivity (900-1500 kΩm), interpretable either as buried ice or as permafrost with a high ice content (Reference Guglielmin, Biasini and SmiragliaGuglielmin and others, 1997a, Reference Guglielmin, Biasini, Dramis, Smiraglia and Riccib).
On all the beaches investigated (Inexpressible Island, Adélie Gove, Edmonson Point, Gondwana, Strandline) the VES values were quite similar, characterised by one or more conductive layers below a thin active layer and a more or less thick dry or ice-poor permafrost layer. The conductive layers can be interpreted as saline permafrost ice, in accordance with the values (0.01-2 kΩm) reported in the literature for subsea permafrost in the Arctic (Reference Sellmann, Delaney and ArconeSellmann and others, 1983) and with those found on Seymour Island, Antarctica, by Reference Fournier, Buk and CorteFournier and others (1990).
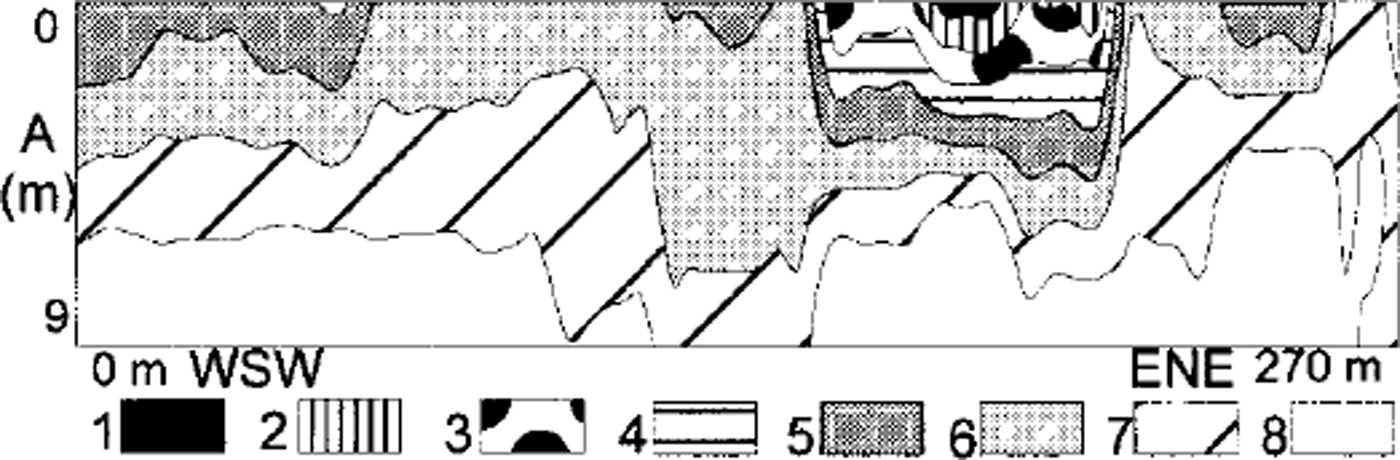
Electrical profiles obtained from the shoreline landwards on some beaches, such as Adélie Gove, Edmonson Point and Gondwana, confirm saline permafrost occurs at depths around or below present sea level. The profile reported in Figure 2 (Adélie Cove South beach) shows the conductive layer reaching the surface at the shoreline and then forming a diapir-like structure inland.
Electrical section of Adélie Cove south beach. Note the occurrence of a thin, superficial permafrost layer with low salt content and of saline subsea permafrost below (1) >35kΩm; (2) 30-35 kΩm; (3) 25-30 kΩm; (4) 20-25 kΩm; (5) 15-20 kΩm; (6) 10-15 kΩm; (7) 5-10 kΩm; (8) 0–5 Ω.
In our opinion, the resistivity values of this conductive layer cannot be interpreted as indicative of salt-water intrusion, because the values of the latter are usually one order of magnitude greater.
The depth of the conductive layers (around 0-10 m below sea level) suggests that this saline permafrost continues under the sea along the continental shelf, and supports the interpretation of these conductive layers as subsea permafrost.
If that interpretation is correct, subsea permafrost could indicate subaerial exposure that permitted freezing of these sediments during an unknown period of time before about 6 ka BP, which is the uplift age of these raised beaches (Reference Baroni and OrombelliBaroni and Orombelli, 1987b).
Alternatively, this saline permafrost could represent the result of the freezing of the beach sediments below a very shallow sea-water layer when the coastline was at sea level or a little below, before the isostatic uplift.
Some boreholes were drilled and some trenches were also dug in the ice-free areas in order to detect the active-layer thickness (10-85 cm in early summer), observe the upper part of the ground ice and collect samples for chemical and isotopic analyses. The latter allowed the ground ice to be referred to different genetic processes (Reference GragnaniGragnani and others, 1998). In particular, the samples collected from debris-covered glaciers (Amorphous and Boulder Clay Glaciers) showed a higher content of CF, Na+, K+ and SO4 2- than those collected from debris cones located in the same area. The particular composition of the debris-cone ground ice could result from the input of snowmelt fresh water, suggesting a periglacial origin for these features (Reference GragnaniGragnani and others, 1998). In other cases, such as in the lower part of Boulder Clay Glacier (<130 ma.s.l.), the ground ice showed a composition that suggests a marine origin. Unfortunately, no datable material has been found (see Table 1).
Geothermal Analyses
The relationships between climate and thermal regimes of the active layer and the upper part of the permafrost were also considered. For this purpose, in December 1996 an automatic monitoring station was installed at Boulder Clay Glacier (at 205 ma.s.l., 5 km south of the Terra Nova Bay Italian base) to record air temperature, global radiation and ground temperatures at depths of-2, -30, -60, -160, -260 and -360 cm. The first two depths are inside the frozen glacial drift, the third is located near the upper boundary of massive ground ice and the lowest three are located in the massive ground ice.
Since the installation, the station has recorded data (and is still recording) every hour. During the period December 1996-December 1997, surface temperature ranged from 10.7° to –35.3°C, with a mean annual value of-16.7°C, while the air temperature ranged from 5.4° to –38°C. Avery good correlation between air temperature and surface temperature was found (Fig. 3). Considering all 366 measurements, the resulting linear regression is

where Ts is the surface temperature and Ta is the air temperature.
Correlations between air temperature and ground surface temperature at Boulder Clay station. Note the thermal inversions during winter.

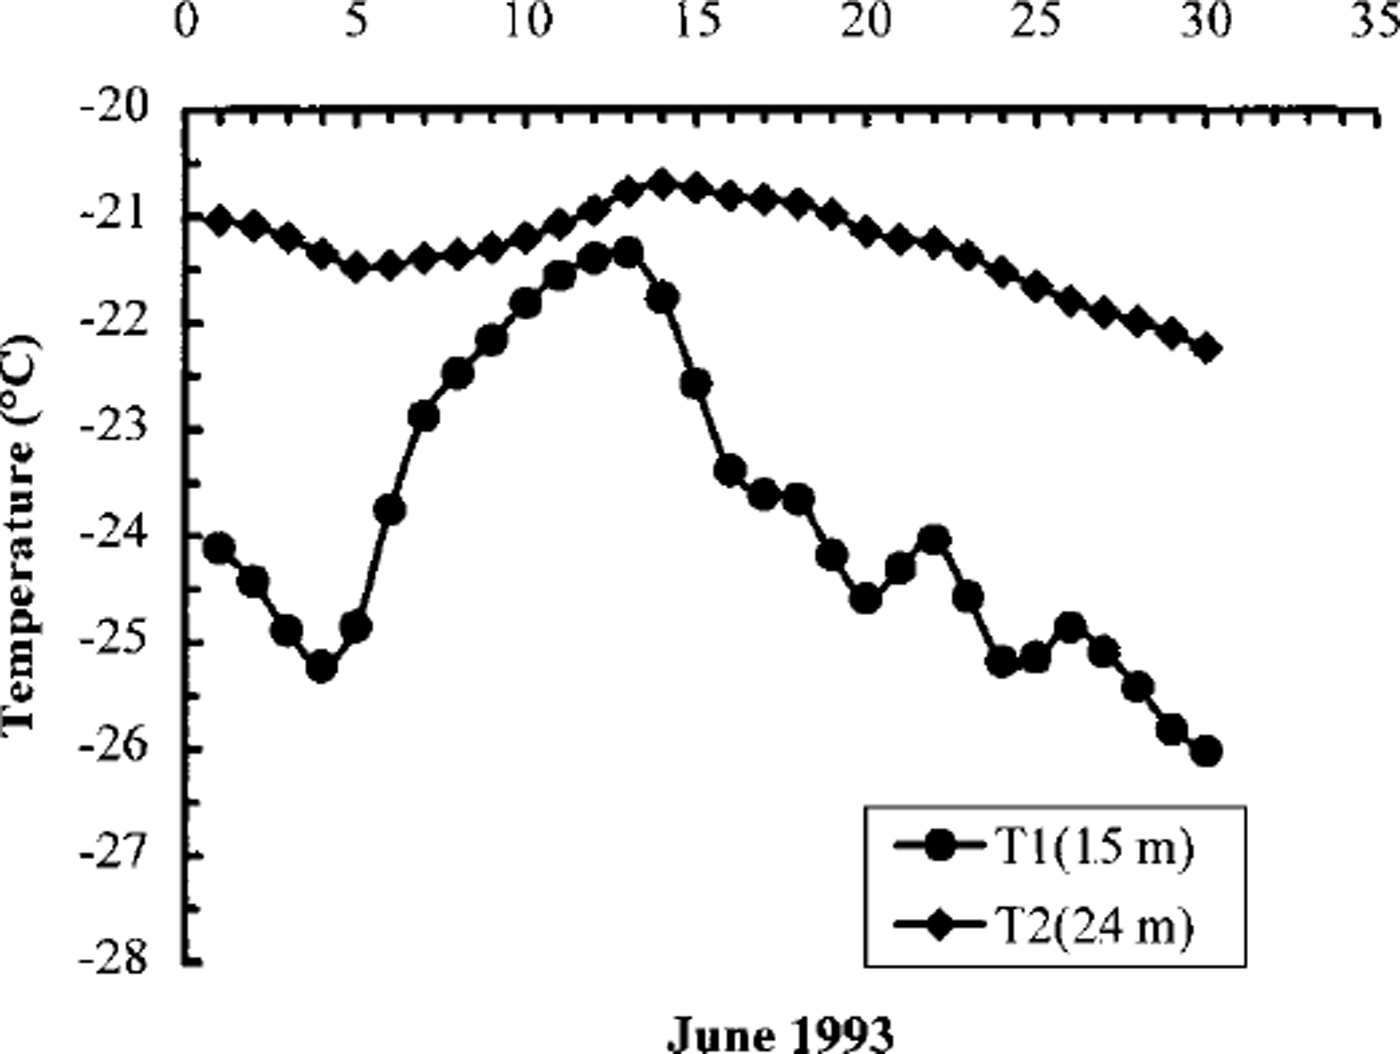
Data on ground temperatures at -1.5 and -2.4 m depth, provided by five stations (VIL, at 2030 ma.s.L, FAL1, at 800 ma.s.L, VIL1 at 1780 ma.s.L, CONT at 1130 ma.s.L and FAL at 1970 m a.s.l.) which were installed in November 1989 around Mount Melbourne (Fig. 1) by the Italian National Institute of Vulcanology, Catania, were also processed. FAL station recorded ground temperatures only from November 1989 to December 1991, so data from this station are not included in the following calculations. From November 1989 to December 1994, the mean monthly ground temperatures at -1.5 m depth ranged from -34.37°C (August 1994, at VIL) to -2.08°C (January 1994, at FAL1); the monthly ground temperatures at 2.4 m depth ranged from -33.54°C (September 1994, at VIL) to -7.35°C (February 1993, at FAL1). Some winter months showed anomalous increases in ground temperature which ranged from 4.3°C (June 1993 at FAL1; Fig. 4) to 0.7°C (July 1992 at CONT). These warm winter ground temperatures were recorded at all the stations in July 1992 and July 1994 but at only three stations (VIL, CONT and FAL1) injune 1993. They were synchronous at all the stations except at FALL the site nearest to the coast and located at lowest altitude, where they occurred 2-3 days earlier. This fact suggests a possible influence of the sea. Analyzing the daily patterns of ground temperature for the months in which the abrupt increases of monthly ground temperature were recorded, it is possible to observe a few thermal events of 4-5 or 7-8 days duration when the ground temperature underwent a strong increase (Fig. 5).
Ground-temperature records at FAL1 station at depths of-1.5and-2.4 m. Note the thermal inversions during winter.

Ground thermal record in June 1993 at station FALL
Ground thermal diffusivity at the five stations between -1.5 and -2.4 m depth was calculated by the formula

where k is the ground thermal diffusivity, P is the time period of the thermal wave considered (days), z1 and z2 are the measuring depths (-1.5 and -2.4 m, respectively) and Ax and A2 are the amplitudes of the temperature variations at depths Zl and z2 during the period P. For FAL1, the resulting ground thermal diffusivity from -1.5 to -2.4 m depth was about 0.05 m2 ^ 1 .
Assuming that air temperatures (Ta) and surface temperatures (Ts) are always linked according to Equation (1), and applying the heat-conduction theory (Reference Carslaw and JaegerCarslaw and Jaeger, 1959) by

it is possible to calculate the thermal variations at -1.5 m depth in July 1993 and 1994 when the maximum thermal increases occurred. Comparing these thermal variations with those of the air temperatures recorded by automatic weather stations in northern Victoria Land around Terra Nova Bay (Reference DellaVedova, Grigioni, De Silvestri, Sarao, Colacino, Giovannelli and StefanuttiDelia Vedova and others, 1996), the values of the latter are more than twice those registered at FAL1 station. The resulting values of the ground-temperature variations at -1.5 m depth (e.g. July 1993 and 1994) are much lower than the values measured at FAL1 for the same events.
It is also possible to calculate the time-span (t) over which the meteorological perturbation reaches -1.5 m depth by

The resulting estimated delay of 2 days is exactly the same as that recorded at FALL
Based on Equations (1) and (3), it is possible to affirm that variations of air temperature during winter cannot explain the thermal events measured at -1.5 m depth in the ground. Theoretically, the measured values of ground temperature at -1.5 m can be explained if the ground surface is thermally insulated by even a thin snow cover. In fact, supposing that after a period of air-temperature increase, a 20 cm thick snow cover with density <200 kg m–3 is deposited and that the air temperature is subsequently lowered to the value before the storm, the ground temperature would be reduced by only a few °C.
The thermal event measured at -1.5 m depth in June 1993 was recorded a few days after a storm reported in the McMurdo area on 2 June 1993. This storm came from the sea and caused an abrupt increase in air temperature. Unfortunately, no snowfall measurements were made during this time to confirm the possible role of winter snowfalls.
Conclusions
Permafrost investigations can provide a useful indication of palaeoclimatic evolution. In particular, analysis of permafrost thermal profiles allows us to reconstruct thermo-plu-viometric regimes with different resolution depending on the temporal scale used, while emphasising the role of snowfall. These investigations may also be useful for reconstructing palaeoclimates and sea-level changes, as has been shown in this reconnaissance study by the presence of subsea permafrost along the coast. Furthermore, the identification of different types of ground ice along the coastal ice-free areas permits us to draw the position of the palaeo-grounding line of the Ross Ice Shelf.
Finally, observation of positive anomalies in the energy balance at the ground surface during winter could help explain the dynamics of atmospheric circulation in Antarctica, an area still not fully understood.