1. Introduction
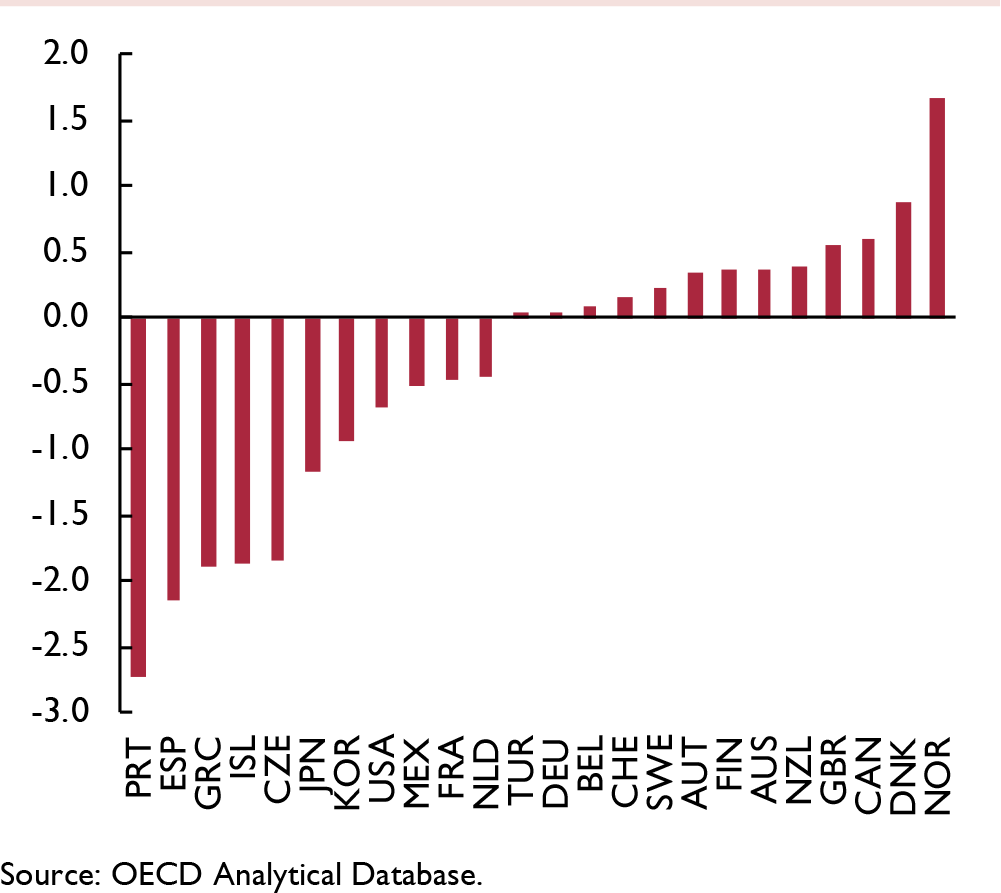
Enhancing the capacity and regulation of public infrastructure is judged to be among the highest priorities in eleven of the 36 OECD countries and eight out of the twelve non-OECD countries surveyed in the OECD's latest annual Going for Growth assessment of structural policies (OECD, 2018). The case for an increase in public investment is further supported by the observation that levels of such expenditure are below pre-crisis levels in around half of the OECD countries shown in figure 1. Shortfalls are particularly apparent in public investment in infrastructure, both in terms of maintenance of existing infrastructure and in responding to changing demands (ASCE, 2017). In Europe, the decline in government investment accounts for about three-quarters of the entire fall in infrastructure investment activities since 2009 (EIB, 2017).
Government investment in 2016 relative to 2000–7 average (nominal shares, percentage points of GDP)

Previous OECD work on a range of models has examined the case for raising public investment (Reference Mourougane, Botev, Fournieri, Pain and RusticelliMourougane et al., 2016). This paper focuses on a single model, NiGEM,Footnote 1 providing an opportunity to highlight the sensitivity of results to different assumptions about policy, to consider more closely cross-country differences and dynamic responses, and to consider in more detail the potential gains from collective action by a number of countries.
The remainder of the paper is organised as follows. The next section compares the effects of a shock to public investment and public consumption, highlighting the different supply-side response from the two shocks. In Section 3, the sensitivity of the results from the public investment shock to alternative monetary and fiscal policy assumptions is examined. In Section 4, cross-country differences are considered as well as the possible gains from collective action. Some concluding remarks are made in Section 5.
2. Public investment compared to public consumption
The short-run multiplier effects of a shock to public expenditure will depend on a variety of country-specific factors, in particular the degree of openness, and the setting of monetary and fiscal policies. To contrast the effect of an increase in public investment and public consumption the focus here is on a single country example – the United States – with both policy shocks undertaken using the same policy rules (monetary policy is set to maintain a nominal GDP target and direct taxes are set so as to maintain an unchanged budget). The simulation exercises are all based on a permanent increase in public investment by the equivalent of ½ per cent of GDP per annum. In practice, achieving a large immediate increase in public investment may be challenging as, for the typical OECD country, it represents an increase in the volume of government investment by about 15 per cent. All shocks are undertaken using NiGEM in forward mode.
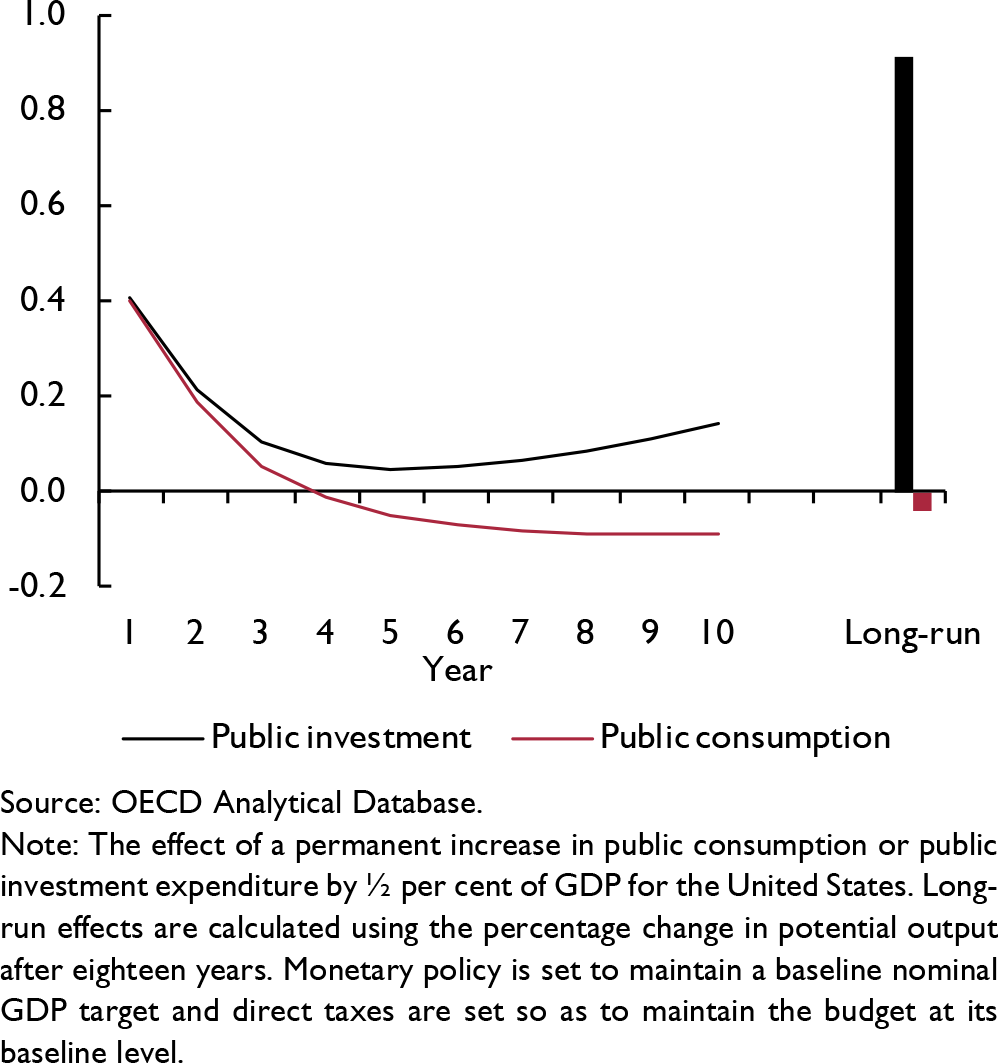
An increase in public investment or public consumption, equivalent to about ½ per cent of GDP, both generate an increase in GDP of about 0.4 per cent in the first year when monetary policy is endogenous, so implying a multiplier of about 0.8. Both multipliers decline in the second and third year, particularly as monetary policy tightens in response to increased inflation (figure 2). It is only from the third year that there is a discernible difference between the two shocks, with the public investment multiplier plateauing and then gradually increasing, whereas the public consumption multiplier continues to decline and becomes mildly negative over time. This illustrates the beneficial effect that an increase in public investment has on supply-side potential by increasing the productive capital stock and hence potential output. A sustained increase in public investment of 0.5 per cent of GDP implies a large adjustment to the public capital stock, of between 10–20 per cent in the very long term in the typical G7 economy.
Comparing public consumption and public investment shocks (percentage change in GDP from baseline)

In the long run (here after the maximum feasible simulation period of eighteen years) potential output has increased by 0.9 per cent following the public investment shock, but is close to zero in the case of the public consumption shock. While the simulation also demonstrates that it takes several years before the differential supply-side effects materialise, the long-run increase in potential output from an increase in public investment is more than twice as high as the first-year effects on GDP.
We show potential output rather than actual output after eighteen years, as adjustment to the long run is not yet complete. Some simulation exercises that point to stronger or faster output gains from public investment do not fully account for the length of time it takes for the eventual steady-state capital stock to accumulate. This accounts for part of the differences in the impact of public investment in the three models used in Reference Mourougane, Botev, Fournieri, Pain and RusticelliMourougane et al. (2016). In the particular example shown here for the United States, the productive public capital stock is over 9 per cent higher than baseline after eighteen years. However, this is less than three-quarters of the eventual steady-state capital stock change, as investment continues to accumulate, implying that potential and actual output would rise further, all else equal, if the simulation horizon were to be extended.
The simulation assumes that the projects undertaken are economically worthwhile. More specifically, the implicit assumption embedded within the aggregate production functions used in NiGEM is that the marginal return on public capital is the same as on private capital. This could understate the return to well-targeted increases in public investment, particularly if the increase were to lead to spillover effects that boost economic efficiency. A recent meta-analysis suggests that such spillovers are larger for public capital installed by local/regional governments and for ‘core public’ capital such as roads, railways and utilities (Reference Bom and LighartBom and Lighart, 2014).
3. The public investment stimulus with alternative macroeconomic policy settings
The size and persistence of the multiplier effects from a shock to public expenditure depend in part on the setting of monetary and fiscal policy. In the default scenario set out above, additional spending on public investment, or public consumption, is offset by a higher effective tax rate on households so as to maintain budget neutrality, and monetary policy in each economy reacts according to the default two-pillar rule in NiGEM. This section focuses on two specific changes to these policy assumptions: using a debt-financed stimulus rather than a budget-neutral stimulus, and allowing monetary policy to be less restrictive than otherwise because of the positive supply shock.
Changes in the monetary policy rule
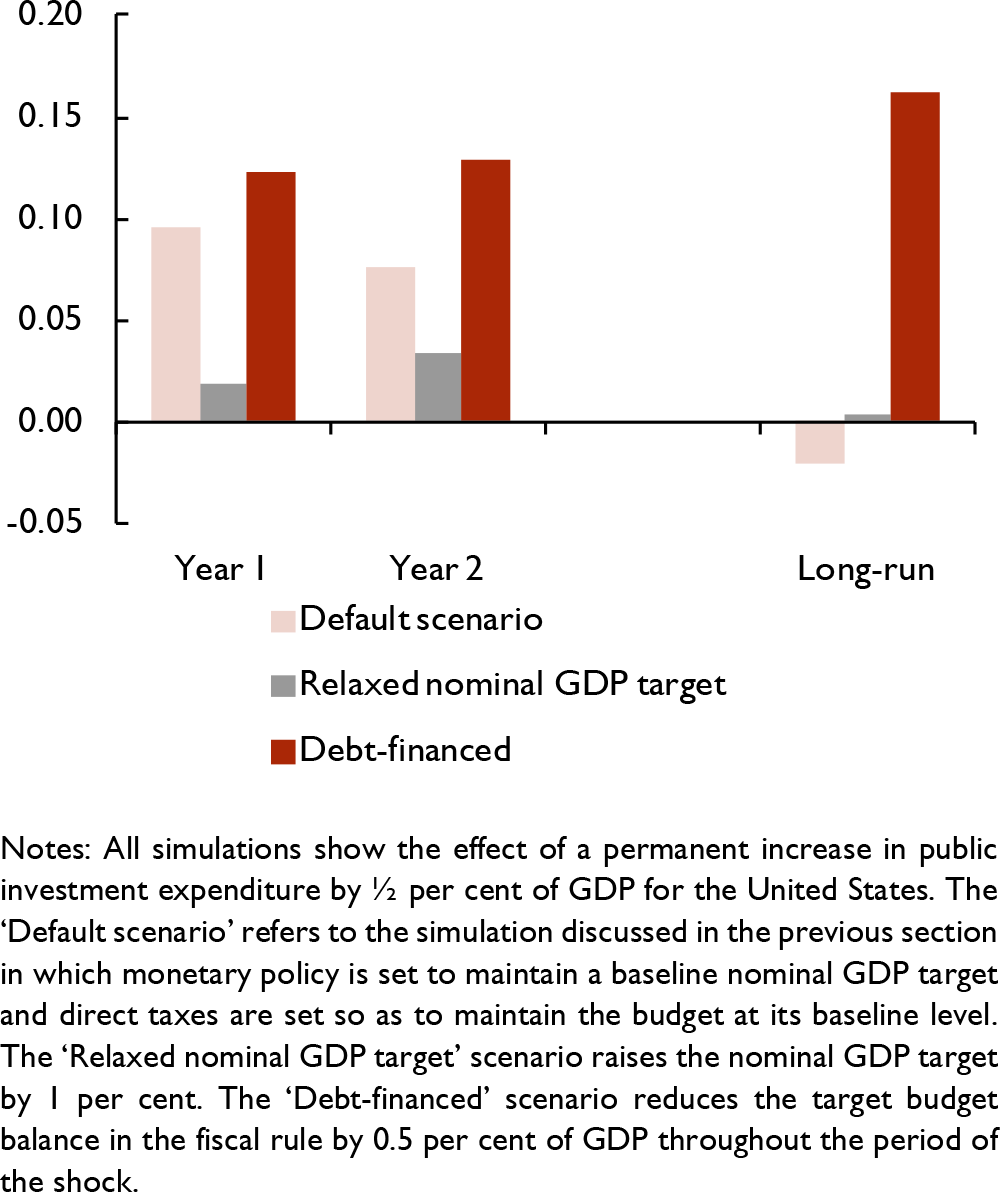
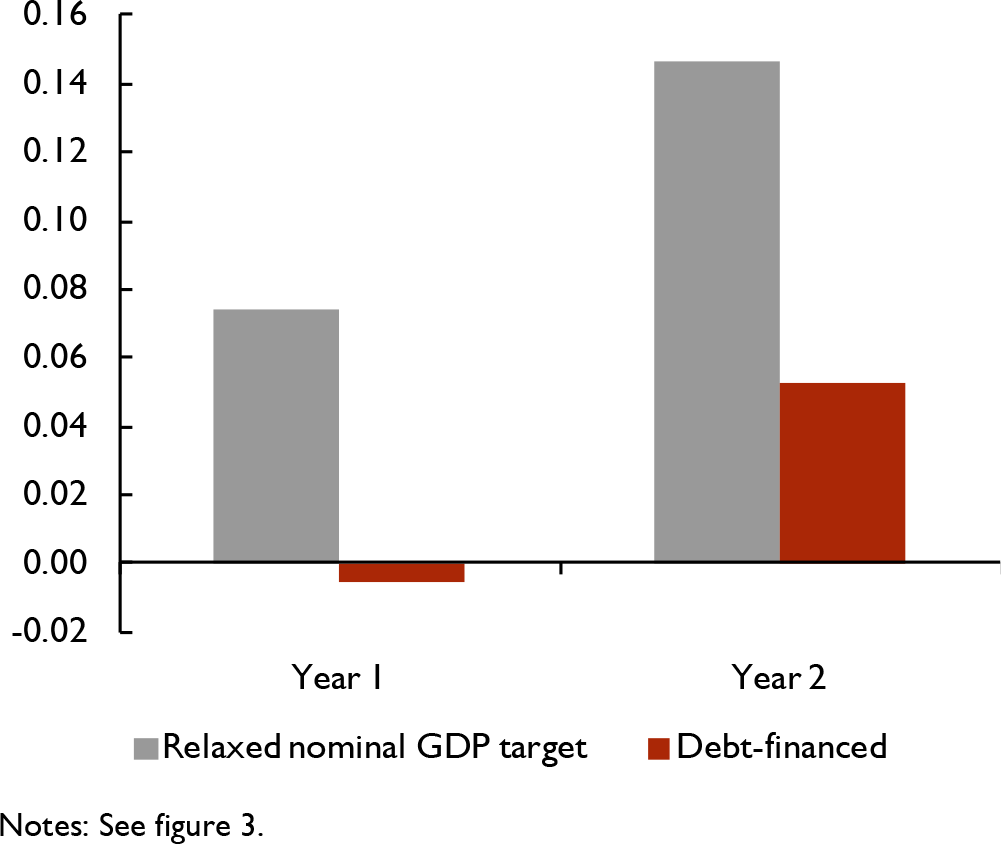
The fiscal expansion pushes up inflation in the near term, as demand rises more rapidly than supply, prompting a rise in policy interest rates. Over time, this reaction fades, as potential output begins to build up. If monetary policymakers allow for the long-term improvement in supply from the higher capital stock, and the extent to which this will reduce medium-term inflationary pressures relative to the baseline, the initial rise in policy interest rates, and so real long-term interest rates, will be smaller (figure 3). Technically, this is implemented in NiGEM by raising the nominal GDP target by 1 per cent in the US monetary policy rule. While this makes little difference to the very long-run outcome, it raises the near-term fiscal multiplier effects by around one-sixth in the first year of the shock, and by more in the second year (figure 4). In turn, this helps to foster additional private spending, and marginally raises the positive spillover benefits for other economies.
Reaction of real long-term interest rates with different macro rules (% points difference from baseline)

Sensitivity of GDP to changes in the underlying macroeconomic rules (% points difference in level of GDP from the default scenario)

Moving to a debt-financed expansion
Financing the fiscal stimulus by debt rather than by taxes makes relatively little difference to the near-term multiplier effects, but significantly lowers the longer-term supply-side benefits. Technically, this is implemented in NiGEM by changing the target budget balance in the fiscal rule, making it more negative by 0.5 per cent of GDP throughout the period of the shock. The additional government debt results in a rise of 7 percentage points in the US government debt-to-GDP ratio over the course of the simulation. In turn, this raises the term premia on US debt by around 8 basis points and results in a permanent increase in the real long-term interest rate and the user cost of capital (figure 3). This crowds out part of the private investment that would otherwise be catalysed by the expansion in the public capital stock. By the end of the simulation period considered, the business capital stock is only 0.2 per cent above baseline, compared with a rise of around 0.8 per cent in the original scenario (with the default rules). Given the importance of the United States in the global economy and in financial markets (Reference ReyRey, 2016), the permanently higher level of US real interest rates in this scenario is also reflected in real interest rates and investment in other economies.
4. Cross-country differences and spillovers from collective action
Collective rather than country-specific action also has a significant influence on both domestic multipliers and spillovers to other economies. The simulation exercises shown here are again all based on a permanent increase in public investment by the equivalent of ½ per cent of GDP, and compare the effects of single country shocks to collective action in each of the G7 economies. Spillover effects, reflecting essentially the response of each country to the initial demand shock in other countries, decrease over time but can be sizable over the short run. Their magnitude varies widely across countries according to country-specific factors, such as overall trade openness or trade linkages with the G7 economies. The results also highlight the importance of monetary policy as a transmission channel.
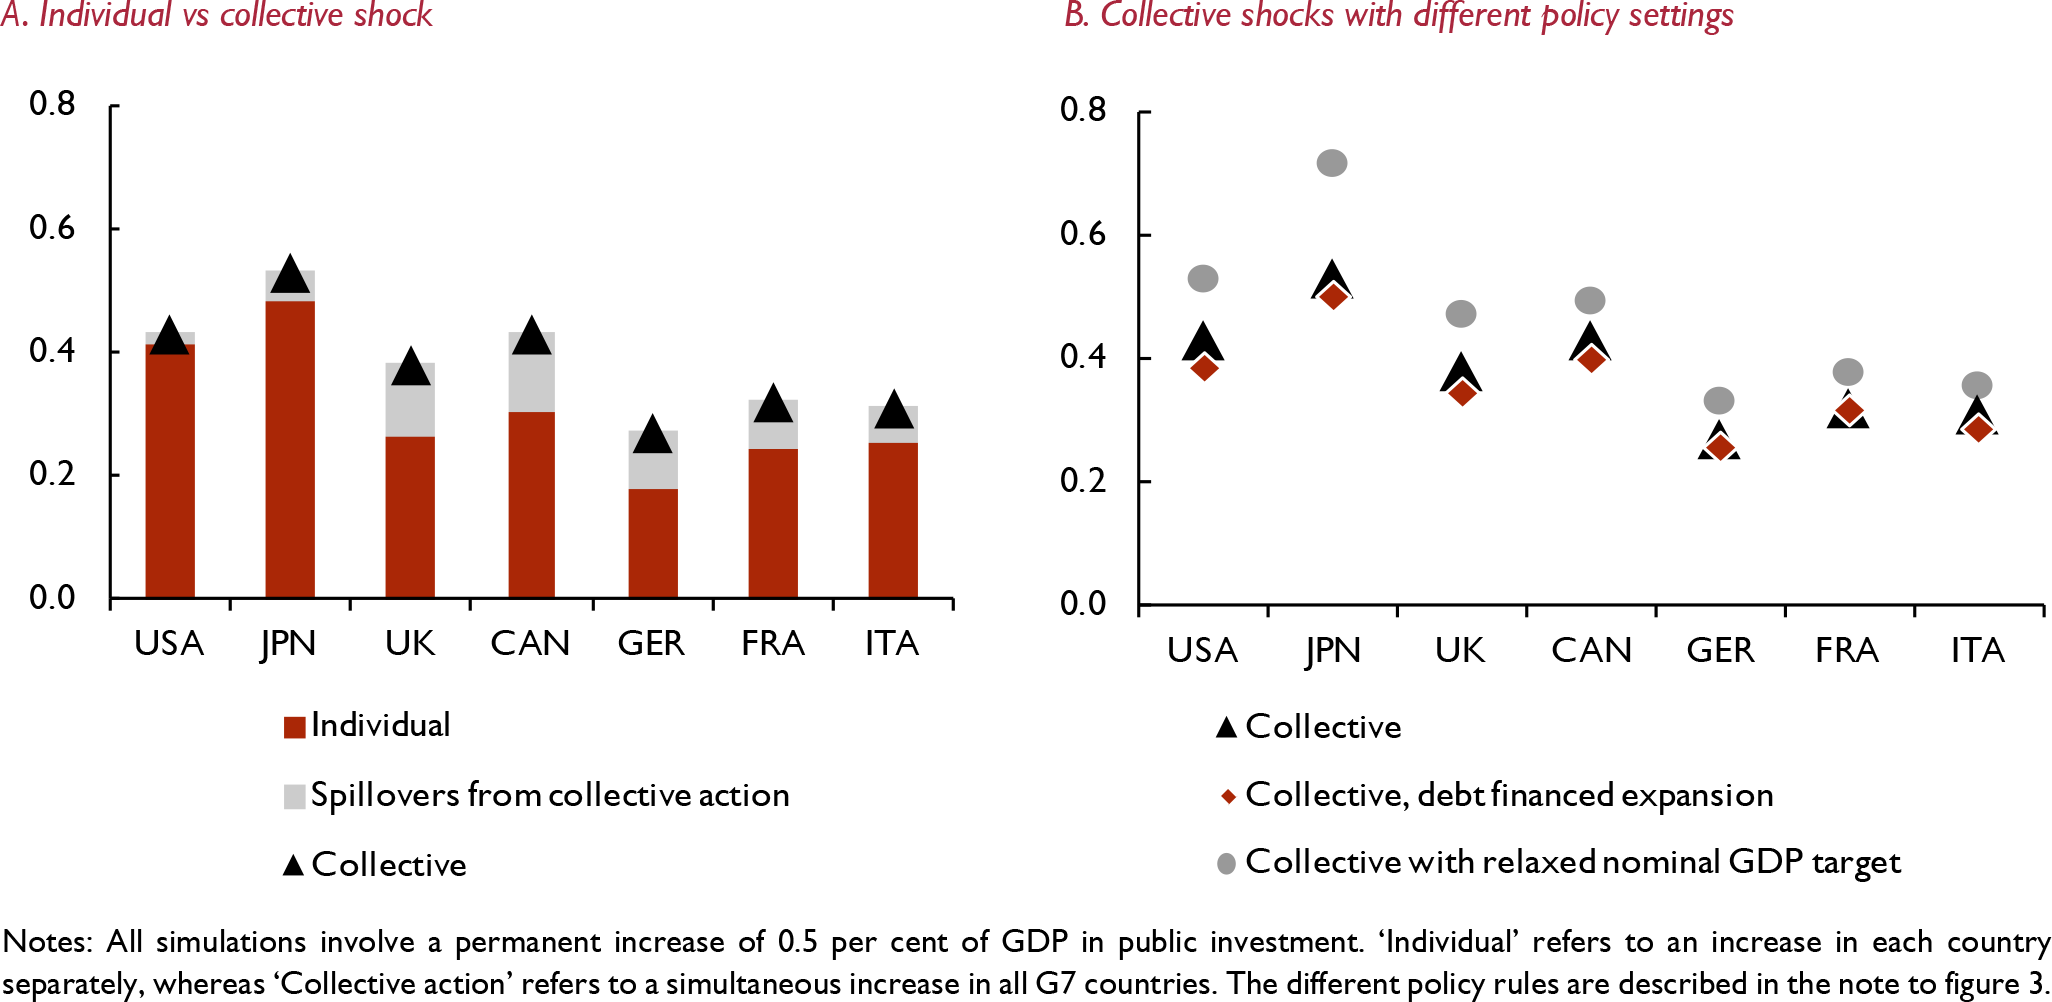
For a single country shock, the first year multipliers are greater for countries where trade is a smaller share of GDP; so multipliers are higher in the United States and Japan, at around 0.8, compared with the major European countries (figure 5, panel A). A corollary of this is that fiscal multipliers in individual economies may have declined somewhat over time as economies have become more open, all else equal.
With globalisation bringing tighter links between countries, collective actions have become more powerful than taking individual actions. If all G7 economies implement the stimulus simultaneously, the first year GDP impact rises on average by nearly 0.1 percentage point, and by more in the countries which are more open to trade (figure 5, panel A).
Policy interest rates rise by around 30 basis points in the United States, Japan, the United Kingdom and Canada and by around 20 basis points in the Euro Area economies in the first 2–3 years of the collective simulation, reflecting the near-term stimulus to demand, before fading thereafter. This contributes to the gradual crowding out of the short-term demand effects of the stimulus.
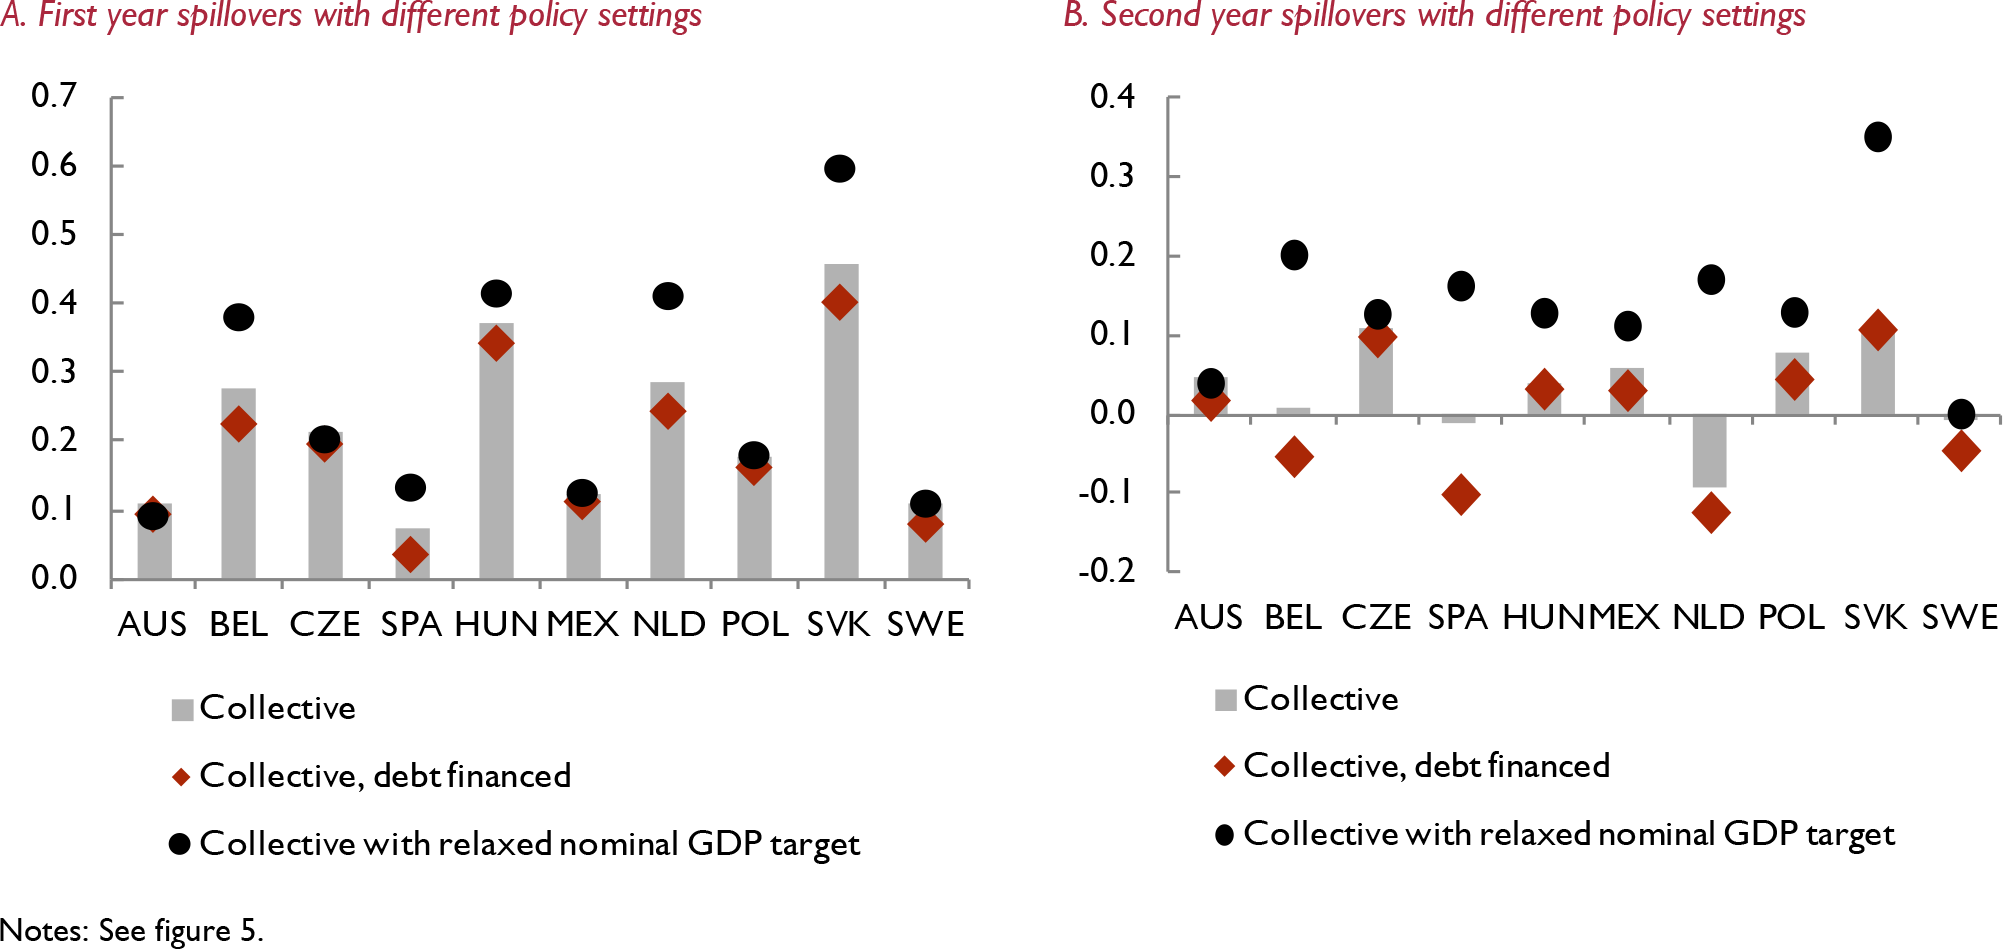
The stimulus to demand in the G7 economies provides a boost to growth in other economies, the magnitude of which depends on country-specific factors. Small, open European economies, such as Belgium, Netherlands, Slovak Republic or Hungary, benefit significantly from the G7 fiscal stimulus due to their strong integration in the European value chain with Germany as a central player (figure 6, panels A and B; Reference De Backer and MiroudotDe Backer and Miroudot, 2014). In some cases, such as the Slovak Republic or Hungary, the first-year multiplier is higher than in Germany, Italy or France. By the second year, these gains have generally faded. In part, this fading reflects the monetary policy responses in many of the smaller economies. Policy interest rates generally rise by between 10–20 basis points, and by more for those economies who are members of the Euro Area, reflecting the spillovers into demand from stimulus elsewhere.
The first-year impact of a collective public investment shock in the G7 economies (change in GDP level from baseline, %)

Spillovers from a collective public investment stimulus in the G7 economies (change in GDP level from baseline, %)

The policy rules being used in the G7 economies have an important bearing on the size and persistence of spillovers to other countries. A more relaxed monetary policy in the G7 economies, with the nominal GDP target being raised by 1 per cent in all economies, lowers long-term real interest rates and boosts their final demand (see section 3). This raises the first-year multipliers from the collective shock in the G7 economies but also outside, especially in the Euro Area countries (with monetary policy being set for the Euro Area as a whole), and allows the demand benefits from the shock to persist for longer (figures 5 and 6).
Financing the fiscal stimulus by debt, on the other hand, leads to higher long-term rates than in the default scenario, so reducing the spillover benefits of the stimulus. Outside the G7 economies, the differences are particularly sizeable in the other countries of the Euro Area, as their interest rates are impacted directly (figure 6, panels A and B). With integrated global financial markets, this persistent increase in long-term interest rates is reflected in other economies as well.
5. Concluding remarks
While the case for increased public investment will partly depend on the need to address structural weaknesses and so on country-specific circumstances and the specific projects being considered, model simulations described here suggest that the supply-side benefits from raising potential output are likely to lead to more favourable macroeconomic outcomes than from using many other standard fiscal instruments. At the same time, the simulations also demonstrate that it takes many years for the full effect on the public capital stock, and so potential output, to accumulate.
Variant model simulations also suggest that a fiscal stimulus will be more effective in the short term the less it is offset by monetary policy, making well-targeted policy initiatives especially effective when policy interest rates are at the zero lower bound. And, as OECD research has shown, choices about the mix of spending and tax policies, including over the ways in which a fiscal expansion is financed, will have longer-term implications for growth and the extent to which improvements in living standards are widely shared (Reference Cournède, Goujard and PinaCournède et al., 2013; Reference Fournier and JohanssonFournier and Johansson, 2016).
Globalisation implies that the spillovers effects from collective action are larger than in the past, boosting multipliers relative to the case where countries take individual action, particularly in the first two years after the policy change. Such spillovers are likely to be particularly important in small open European economies, especially those strongly integrated in European value chains.