


I. Introduction
Norway is generally a low alcohol consumption country (Fogarty, Reference Fogarty2010). Wine consumption is about one-third that of the French, one-half that of the Danish, and on par with consumption in Ireland (Sirus, 2018). There was a steady increase in alcohol sales from 1990 to 2008. Excluding tax-free sales and legal and illegal cross-border trade, sales per adult (≥15 years) increased from 5.0 to 6.8 liters pure alcohol equivalents. However, sales declined to 6.1 liters in 2014 (Statistics Norway, 2016).Footnote 1 During this period, the composition of alcohol sales has moved from spirits and beer and toward wine. Figure 1 shows sales of wine, beer, and spirits per adult over the period 1990–2015. Sales of spirits and beer have declined by more than 10% from 3.0 and 65 liters, respectively, in 1990 to 2.6 and 57 liters in 2015, while sales of wine have increased from 8.0 to 18 liters over the same period of time. These changes are of importance for at least two reasons. First, for wine producers and importers, the dynamics will provide information about the future growth potential of the Norwegian wine market. Second, given the possible risks for future alcohol-related harms, it is important to identify groups at increased risk.
Sales of Alcohol in Norway

Wine consumption has been found to be affected by economic, demographic, and other factors. The effects of prices and income on the demand for alcohol and wine have been investigated in numerous studies (e.g., Clements and Johnson, Reference Clements and Johnson1983; Fogarty, Reference Fogarty2010; Gallet, Reference Gallet2007; Heien and Pompelli, Reference Heien and Pompelli1989; Milhøj, Reference Milhøj2010). In his meta-analysis of alcohol elasticities across the world, Gallet (Reference Gallet2007) reported a median own-price and income elasticity of wine of –0.70 and 1.10, respectively. The mean own-price and income elasticity for wine in the five Norwegian studies included in Fogarty's (Reference Fogarty2010, p. 452) survey were –0.37 and 1.07, respectively. The developments in prices of alcoholic beverages and income are shown in Figure 2. The price indices for beer, wine, and spirits are the sub-indices of the consumer price index (CPI) divided by the total CPI to reflect changes in relative prices, and the index for income is the average annual earnings for all employees divided by the CPI to reflect changes in real income. All the indices are normalized to 1 in 1998. Two points are worth noting. First, the real prices of alcoholic beverages have been relatively stable. This is especially the case for wine for which the price index has varied between 0.99 and 1.02 over the period 1993–2015. This stability is a result of the taxation of wine that has aimed at keeping the real price of wine constant. The price index for spirits fell somewhat after 2000, partly as a result of large cross-border trade, while the price index of beer was below the price index of wine from 2004 to 2011, but has been above it since 2011. Based on the price stability of wine, it seems unlikely that changes in the price of wine can explain the growth in sales, and the price of wine was thus excluded from the analysis.Footnote 2 As shown in Figure 2, there has been stable growth in income over the period. The index for real income grew from 0.9 in 1990 to 1.5 in 2015. Given income elastic demand, this income growth is likely to have increased the sales of wine.
Price Indices for Beer, Wine, and Spirits and Real Income

Demographic and socioeconomic variables are likely to have influenced consumption. Several variables have been found to be important for the consumption of alcohol and wine including gender (e.g., Aristei, Perali, and Pieroni, Reference Aristei, Perali and Pieroni2008; Bruwer, Lesschaeve, and Campbell, Reference Bruwer, Lesschaeve and Campbell2012; Greenfield, Midanik, and Rogers, Reference Greenfield, Midanik and Rogers2000; Kerr et al., Reference Kerr, Greenfield, Bond, Ye and Rehm2004; Kerr et al., Reference Kerr, Greenfield, Ye, Bond and Rehm2013), education (e.g., Aristei, Perali, and Pieroni, Reference Aristei, Perali and Pieroni2008; Heien and Pompelli, Reference Heien and Pompelli1989; Kerr et al., Reference Kerr, Greenfield, Bond, Ye and Rehm2004), region (e.g., Aristei, Perali, and Pieroni, Reference Aristei, Perali and Pieroni2008; Heien and Pompelli, Reference Heien and Pompelli1989; Kerr et al., Reference Kerr, Greenfield, Bond, Ye and Rehm2004), and religion (e.g., Greenfield, Midanik, and Rogers, Reference Greenfield, Midanik and Rogers2000; Yamada, Kendix, and Yamada, Reference Yamada, Kendix and Yamada1996). Wine consumption is also likely to differ with age, period, and birth cohort. In general, age effects in wine consumption will reflect biological and social processes across the life cycle of an individual, such as a possibly reduced intake of wine among older people. Period effects in wine consumption reflect variation over years that influence all age groups simultaneously, such as increased consumption because of increased availability or more interest in wine culture over time. Cohort effects reflect changes across a group of people who experienced an initial event in the same years, for example, growing up in a culture that is favorable to everyday consumption of wine. Age-period-cohort (APC) variables have been included in consumption analysis. Heien and Pompelli (Reference Heien and Pompelli1989) found a negative and significant age effect on the consumption of wine, Fountain and Lamb (Reference Fountain and Lamb2011) found no difference in the proportion of wine consumers between two generations, and Bruwer, Lesschaeve, and Campbell (Reference Bruwer, Lesschaeve and Campbell2012) found that older consumers (≥35 years) consume significantly more wine than younger consumers (<35 years). However, relatively few studies have simultaneously modeled the effects of age with the effects of period and cohort on the consumption of wine. Two exceptions are Kerr et al. (Reference Kerr, Greenfield, Bond, Ye and Rehm2004), who found significant period effects but few significant age or cohort effects in the United States over the period 1979–2000, and Kerr et al. (Reference Kerr, Greenfield, Ye, Bond and Rehm2013), who found a flat age pattern for women's wine consumption and an increasing age pattern for men's wine consumption for the period 1979–2010.
The existence of the state monopoly, Vinmonopolet, was a controversial issue during the negotiations for Norwegian membership in the European Union (EU) during the early 1990s (Nordlund, Reference Nordlund2010). Norway did not become a member of the EU but continued as a member of the European Economic Area (EEA), which resulted in a harmonization of many Norwegian laws with those of the EU. This harmonization resulted in a termination of the monopoly system for import, export, production, and wholesale of alcoholic beverages but the retail sales monopoly continued (Nordlund, Reference Nordlund2010). However, this monopoly lost popular support during the 1990s and the management of the monopoly launched a plan for regaining popularity by increasing the number of retail outlets and introducing self-service in the outlets (Nordlund, Reference Nordlund2010). In 1997, before the plan was implemented, the number of outlets was 114, and this gradually increased to 306, all with self-service, in 2015. This increase has been particularly notable in many counties where there were few outlets in the early 1990s. For example, in the county of Møre and Romsdal on the West coast, the number of outlets increased from three to 19 over the period 1997–2015 (Sirus, 2018; Vinmonopolet, 2016).Footnote 3 Although international studies have found increased consumption after a large increase in the number of alcohol outlets (Babor et al., Reference Babor, Caetano, Casswell, Edwards, Giesbrecht, Graham, Grube, Gruenewald, Hill, Holder, Homel, Osterberg, Rehm, Room and Rossow2003), Nordlund (Reference Nordlund2010) reported small effects on Norwegian wine consumption over the period 1999–2004. It is of considerable interest to investigate how this increased availability of wine has influenced consumption especially among people who have grown up with increased availability.
The effects of attitudes have not been studied in detail, partly due to the lack of good data. Such effects may or may not be captured by APC variables, and we test for specific effects on wine consumption of changes in some potentially relevant attitudes over time.
We have three objectives in this study. First, we estimate the separate influences of APC variables on the consumption of wine in Norway while controlling for changes in income and socioeconomic and demographic variables that typically are controlled for in APC studies. Second, we investigate the extent to which APC effects can be explained by variables related to changes in attitudes and the availability of wine. Third, we predict future wine consumption by simulating the changes in probabilities of drinking wine for different cohorts as they age.
II. Data
We use the Norwegian Monitor Survey (NMS), which is a nationally representative and biannually repeated cross-sectional survey of adults aged 15–95 years. In each survey, 3,000–4,000 respondents participated; roughly 95% of these were aged 18–80 years and we only included these respondents.Footnote 4 Although the survey has been conducted biannually since 1985, before 1991, the data did not include all our variables, and so we use data for the period 1991–2015. The NMS is Norway's most comprehensive consumer and opinion survey and covers a broad range of topics including demographic and socioeconomic information, political preferences, viewpoints on moral and ethical issues, and self-perceived happiness, health, and drinking habits including the frequency of wine consumption (Ipsos-MMI, 2016). The survey includes two questions of interest for our analysis: (1) How often do you drink white wine? and (2) How often do you drink red wine? The respondents check one of the responses: every day, 3–5 times a week, 1–2 times a week, 2–3 times a month, about once every month, 3–11 times a year, less than 3 times a year, or never. As we are interested in the overall wine consumption, we aggregated the two frequencies by first calculating the yearly intervals of consumption of white and red wine, respectively, for each respondent. Then, within each interval and for each respondent, we drew the frequency from a uniform distribution with the limits of the intervals used as the limits of each distribution. The alternative “every day” was set to 365 days and the alternative “never” was set to 0 days. Finally, we added the consumption frequencies of the two wines and restricted the frequency to between 0 and 365 days.Footnote 5
Figure 3 shows the average number of wine drinking days per year in different cohorts over the period 1991–2015 as identified by the NMS database.Footnote 6 In this figure, we define a cohort as respondents who were born in the same five-year period. The oldest cohort was born between 1933 and 1937. Over the entire period, the cohort born between 1943 and 1947 consumed wine more frequently than the other cohorts, and the average frequency increased from about 20 days in 1991 to about 60 days in 2015. The frequency of wine drinking usually increased with the age of the cohort and over time.
Yearly Number of Wine Drinking Days in Cohorts

The average number of wine drinking days is plotted against the age of the respondents in each cohort in Figure 4. The rightmost curve represents the oldest cohort born between 1933 and 1937. The average age of this cohort was 56 years old in 1991, 58 years old in 1993, and so forth. The second oldest cohort is represented by the curve to the left of the oldest cohort. The average age of this cohort was 46 years in 1991, 48 years in 1993, and so forth. The leftmost cohort was born between 1983 and 1987 and was included in the sample for the first time in 1999. Figure 4 shows that when the age of cohorts overlaps, a younger cohort usually has a higher frequency of consumption than the older cohorts. For example, when the cohort born between 1933 and 1937 was on average 56 years of age in 1991, the average frequency of wine drinking was 17 times a year. When the cohort born 10 years later was on average 56 years of age in 2001, the average wine consumption frequency was 52 times a year. A 56-year-old person in 2011, who was born between 1953 and 1957, had an average wine consumption frequency of 62 times a year. This pattern suggests unconditional cohort effects on wine consumption. In addition, the frequency usually increases with age for all cohorts. However, as discussed earlier, there are other potentially important explanatory variables that may modify and possibly explain some of these observed unconditional age and cohort effects.
Yearly Number of Wine Drinking Days in Cohorts

Table 1 presents the mean values and associated standard deviations of the included variables for 1991, 2015, and the total sample. As is evident, there have been large increases in income, educational level, and the number of wine stores over this period of time. In addition, the respondents are less religious and more hedonistic while the percentages of those living in a big city, married people, regular beer drinkers, and health-conscious people have remained quite stable. The variables are explained in more detail later.
Summary Statistics

Notes:
a The values for the 1991 subsample.
b The values for the 2015 subsample.
c The values for the total sample.
d The values in parentheses in the SD columns are the standard deviations.
III. Empirical Model
The probability of drinking wine is estimated by a binary logit model (Cameron and Trivedi, Reference Cameron and Trivedi2005). After some experimentation, we specified the model as:
 $$\eqalign{\Pr (q = 1 \vert x) = & \Lambda _\varepsilon (\beta _1 + \beta _2A + \beta _3A^2 + \beta _4C + \beta _5AC + \beta _6P_1 + \,\beta _7P_2 + \beta _8P_3 + \beta _9I \cr & + \beta _{10}I^2 + \beta _{11}E + \beta _{12}W + \,\,\beta _{13}M + \beta _{14}WM + \beta _{15}BC + \beta _{16}WS \cr & + \beta _{17}Young + \beta _{18}Religion + \beta _{19}Beer + \beta _{20}Hedon + \beta _{21}Health),}$$
where ε has a logistic distribution, Λ is the cumulative distribution function for ε, and the subscripts denoting respondents are deleted for notational simplicity. The model is estimated in four versions.
Model A: A restricted model for moderate drinkers. The outcome variable q = 1 if the respondent drinks wine at least once a week. About 23% of the sample belongs to this group. We include the explanatory variables associated with β 1, …, β 15, where A is the log of age of the respondent, C is the birth cohort (log of year of birth from 1933 to 1994), AC is an interaction variable between age and cohort, P 1 = 1 for the period 1991–1995, P 2 = 1 for the period 1997–2001, P 3 = 1 for the period 2003–2007, I is the log of income deflated by the CPI and the square of number of household members as recommended by OECD (2008),Footnote 7 E = 1 if the respondent has completed more than 12 years of schooling, W = 1 if the respondent is female, M = 1 if the respondent is married, WM = 1 if the respondent is female and married, and BC = 1 if the respondent lives in one of the four major cities of Norway (Bergen, Oslo, Stavanger, and Trondheim).
Model B: A restricted model for regular drinkers. The outcome variable q = 1 if the respondent drinks wine at least three times a week. About 5.5% of the sample belongs to this group. The explanatory variables in Model A are used.
Model C: The unrestricted model for moderate drinkers. The outcome variable q = 1 if the respondent drinks wine at least once a week. In addition to the variables in Model A, this model includes the number of wine stores in the relevant county, and five dummy variables defined as: Young = 1 if the respondent was born in 1980 or later; Religion = 1 if the respondent totally or somewhat agrees with the statement, “religion gives me the best answers to all important questions I ask myself”; Beer = 1 if the respondent drinks beer at least once a week; Hedon = 1 if the respondent totally or somewhat disagrees with the statement, “I would rather spend money on goods that provide pleasure in the long run than on consumption that provides pleasure in the short run, like holidays, going to restaurants, etc.”; and Health = 1 if the respondent answered yes to the question, “It is important for me to eat healthy and stay in good shape.” The Young variable is of interest for investigating the importance of increased availability of wine. As noted, the number of wine outlets started to increase in 1998 when respondents born in 1980 turned 18 years old, which is the age limit for the legal purchase of wine.
Model D: The unrestricted model for regular drinkers. The outcome variable q = 1 if the respondent drinks wine at least three times a week. The explanatory variables in Model C are used.
The four models were estimated with the generalized linear model (GLM) function in the statistical program R (R Development Core Team, 2017). For each respondent, we drew the consumption frequency from a uniform distribution as described earlier, estimated the model using the GLM function, and calculated the marginal effects. This procedure was repeated 500 times with a new bootstrap sample, and the estimation results are based on the average estimates.
The marginal effects were calculated by using the explanatory variables for each of the individuals in the 2015 survey and the average effects of the 500 bootstraps.Footnote 8 For a continuous variable (age, cohort, or number of wine stores), the marginal effect is calculated as 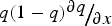 $q(1 - q){\raise0.7ex\hbox{${\partial q}$} \!\mathord{\left/ {\vphantom {{\partial q} {\partial x}}}\right.\kern-\nulldelimiterspace} \!\lower0.7ex\hbox{${\partial x}$}}$, where q is the probability of drinking wine (at least once a week or at least three times a week) and x is the relevant variable. For age and cohort, the marginal effect is calculated for a one year change. For the number of wine stores, the marginal effect is the effect of changing the number of wine stores in the county by one. For income, the marginal effect is the effect of changing income by 1%, which is calculated as
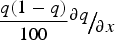 $\displaystyle{{q(1 - q)} \over {100}}{\raise0.7ex\hbox{${\partial q}$} \!\mathord{\left/ {\vphantom {{\partial q} {\partial x}}}\right.\kern-\nulldelimiterspace} \!\lower0.7ex\hbox{${\partial x}$}}$. For a dummy variable, x, the marginal effect is calculated as Δq = (q|x = 1) − (q|x = 0).
IV. Estimation Results
We estimated the four models and performed likelihood ratio tests to choose between the unrestricted and restricted models. The estimated parameters, the associated t values, and some goodness-of-fit measures are presented in Table 2.Footnote 9 The parameters are similar in sign and significance across the models, and the restricted Models A and B were clearly rejected by a likelihood ratio test (p = 0.00 in both cases). These rejections suggest that availability and attitudes have specific and significant roles in wine consumption, and we therefore focus our discussion on the results of the unrestricted Models C and D.
Estimation Results

Note: The estimation results are based on 500 bootstraps.
Age has a negative effect while squared age has a positive effect, which indicates a U-shaped consumption pattern over the life cycle; however, our probabilities follow a logistic distribution and the shape will differ across the levels of the other variables. The negative cohort effect indicates lower wine consumption among younger cohorts. However, there is also a positive interaction effect with age and the total effect is not clear. The period effects are negative for the first period relative to 2009–2015.
Income has a negative effect while squared income has a positive effect, which suggests a similar pattern as the age effect. Increased education increases the probability of wine consumption. Women and married respondents have a higher probability of being moderate drinkers but there is no effect on the probability of being a regular drinker. There is a negative interaction effect of being a married woman so the total effect for this group is not clear. Living in a big city increases the probability of wine consumption.
Both the number of wine stores and the effect of being born after 1980 increase the probability of wine consumption. However, being a regular beer drinker has no effect on wine consumption. The attitudinal variables are significant. Hedonistic and health conscious respondents have an increased probability of consuming wine while religious respondents have a reduced probability.
The marginal effects of the variables are easier to interpret than the parameter estimates, and the marginal effects and associated t values for the unrestricted models are presented in Table 3. The statistically significant (at the 5% level) marginal effects in Models C and D have the same signs in the two models with the exception of the effect of the survey being conducted in the period 1997–2001. Consequently, we discuss the effects for moderate drinkers (Model C).
Marginal Effects

Note: The estimated coefficients and t values are based on 500 bootstraps.
When the age of a respondent increases by one year, the probability of drinking wine increases by 0.4 percentage points; if the cohort of the respondent increases by one year, the probability of drinking wine decreases by 0.4 percentage points. These effects may accumulate to substantial effects over the years. In the first period, there was a 5.9 percentage point lower probability of drinking wine compared with the period 2009–2015; in the second period, there was no significant effect, and in the third period, there was a 2 percentage point higher probability.
If income increases by 1%, the probability of drinking wine increases by 0.2 percentage points. Education has a substantial effect. Completion of a Bachelor's degree or similar increases the probability of wine consumption by 8.6 percentage points. A woman has a higher probability of 0.9 percentage points than a man to drink wine. The effects of being married and living in a big city are 1.9 and 6.1 percentage points, respectively.
If one new wine store opens in the county, the probability of drinking wine increases by 1.2 percentage points. Respondents born in 1980 or later have an increased probability of consuming wine of 7.6 percentage points. If religion is important in a person's life, the probability of drinking wine is reduced by 7.4 percentage points, but there is no effect of being a regular beer drinker. Hedonistic and health conscious attitudes increase the probability of wine consumption by 7.8 and 3.5 percentage points, respectively.
V. Simulation Results
The estimation results were used to simulate future wine consumption. We simulated the probabilities of drinking wine for five different cohorts born in 1955, 1965, 1975, 1985, and 1995. These cohorts correspond to the four youngest cohorts in Figures 2 and 4 and to one younger cohort born in 1995. The initial year of the simulation is 2015 when the age of these cohorts was 60, 50, 40, 30, and 20 years old, respectively. In the simulation, the age of each cohort sequentially increases from the initial age in 2015 until the cohort reaches 80 years old (2035 for the oldest cohort and 2075 for the youngest cohort). The explanatory variables are held constant at their average values in 2015.Footnote 10
The results from the simulations for moderate (those who drink wine at least once a week) and regular (those who drink wine at least three times a week) wine drinkers are shown in Figures 5 and 6, respectively. There are substantial conditional age and cohort effects for both moderate and regular wine drinkers. The probability of drinking wine increases with age in each cohort.
Probability to Drink Wine Once a Week

Probability to Drink Wine Three Times a Week

As shown in Figure 5, the probability of drinking wine at least once a week in the youngest cohort is 0.08 when the respondent is 20 years old. The probability is lowest for this cohort until it reaches the age of 50, but then it increases more with age than in any other cohort. By the time this cohort is 80 years old, it has the second highest probability of wine consumption with a probability of 0.54. The second youngest cohort, born in 1985 and turns 30 years old in 2015, generally has the highest probability of being moderate drinkers when they are measured at the same age as the other cohorts. The probability of drinking also increases for this cohort, but not as fast as for the youngest cohort. The probabilities for the three oldest cohorts increase more slowly than for the younger cohorts. At the age of 65, the two younger cohorts will have higher probabilities of drinking wine at least once a week than the three older ones.
Figure 6 shows that except for the oldest cohort, the probability of drinking wine at least three times a week remains below 0.10 in all cohorts until they are over 70 years old. The oldest cohort reaches 0.10 at 66 years old. However, the probabilities increase with age, and when a respondent in the two youngest cohorts is 80 years old, the probability is above 0.13. As a result of an aging population and these cohort effects, the future probabilities of moderate as well as regular wine consumption are likely to increase.
VI. Conclusions
Given repeated cross-sectional data with different respondents in each survey, it is impossible to estimate the dynamics of wine consumption for each respondent. However, the selected APC approach uses both the cross-sectional and time-series structure of the data, and we find substantial positive marginal effects on the probability of wine consumption of age, period, and cohort.
The analysis also finds many other significant marginal effects. The number of wine stores in a county increases the probability of wine drinking, and respondents who turned 18 years old after the increase in the number of wine stores have higher probabilities of wine consumption than older respondents. Women have a slightly higher probability of drinking wine at least once a week than men. Furthermore, marriage, more education, higher income, and living in a big city all increase the probability of drinking wine. Finally, attitudes are important. Hedonistic and health conscious respondents have a higher probability of drinking wine while religious respondents have a reduced probability. However, we found no significant marginal effects of being a regular beer drinker.
On the assumption that new generations continue to behave according to our simulation model, the results suggest that the total number of wine drinkers will increase as younger cohorts slowly replace older cohorts. Our simulation results suggest a positive age effect on the probability of drinking wine. In most cases, respondents in the youngest cohorts have a higher probability of drinking wine than respondents in the older cohorts when they were the same age. The probability of drinking wine at least once a week is 0.08 when a respondent in the youngest cohort is 20 years old. The probability increases to 0.54 when this respondent becomes 80 years old. A respondent in one of the three oldest cohorts has a probability of 0.44 when he or she is 80 years old.
Different cohort effects may be due to different levels of the control variables in the different cohorts. For example, at the age of 20, a member of the youngest cohort is more likely to have a higher income and more education than a member of one of the older cohorts at the same age. Other potential factors causing differences between the cohorts may be related to increased information about wine in the media and more travels to countries with a long history of wine consumption. Often, the interest in a culture such as wine drinking is created when people are young.



