INTRODUCTION
Plants growing in a forest understorey experience extreme fluctuations in light conditions, as long periods of low diffuse light alternate with brief, unpredictable periods of high light during sunflecks. The period of high light can last for a few seconds to several minutes or even longer, and contributes 10–80% of daily photosynthetic photon flux density (PPFD) received by understorey plants (Chazdon Reference CHAZDON1988). Photosynthetic carbon gain during sunflecks contributes substantially to carbon balance of understorey plants. Upon receiving a sunfleck, understorey leaves increase their photosynthesis from very low to high rates, which is called photosynthetic induction (Chazdon & Pearcy Reference CHAZDON and PEARCY1986a, Pearcy Reference PEARCY1990). Photosynthetic induction involves the increase in the activity of Rubisco, regeneration of RuBP and stomatal opening. The biochemical activation is much quicker compared with the stomatal opening process. When the leaf is shaded after sunflecks, the fast-induction component deactivates rapidly, while the slow-induction component (i.e. stomatal closure) deactivates slowly (Pearcy Reference PEARCY1990, Pons et al. Reference PONS, PEARCY and SEEMANN1992). Maintaining photosynthetic induction after lightflecks affects the responses of leaves to subsequent sunflecks.
Apart from light instability, water limitation also constrains performance of epiphytes, as they usually occupy microhabitats that dry rapidly. Although many vascular epiphytes live in the microhabitats in the lower storeys of the forests, some members of this plant group, especially the so-called ‘bark epiphytes’ that completely lack canopy soil, are subject to frequent water shortage (Benzing Reference BENZING1990). Therefore, drought stress is a strong selection pressure for the epiphytes. Furthermore, insufficient water supply might limit stomatal conductance and further influence the use of sunflecks. Ferns, as a plant group, possess simply branched, occasionally reticulate vascular networks to irrigate fronds (henceforth leaves). Angiosperm leaves commonly utilize xylem vessels in the lower vein orders, which are absent from fern leaves (Carlquist & Schneider Reference CARLQUIST and SCHNEIDER2001). This great variation in vascular system between ferns and angiosperms affects the hydraulic conductance of the leaves (Sack & Frole Reference SACK and FROLE2006), and thus affects the performance in term of gas exchanges (Brodribb et al. Reference BRODRIBB, FEILD and JORDAN2007). However, whether the great variation in vascular system in leaves between ferns and angiosperms affects their lightfleck utilization is poorly understood.
Hemiepiphytic plants grow as true epiphytes at their initial life stage, and then become terrestrial through aerial roots that grow from the canopy to the ground (Patiño et al. Reference PATIÑO, GILBERT, ZOTZ and TYREE1999). They make a soil connection for only a portion of their life cycle, presenting a life form between an epiphyte and a terrestrial plant. Hemiepiphytes are common in Ficus (Moraceae) and Clusia (Clusiaceae). The best known hemiepiphytes are the strangler figs. Approximately 500 fig species are classified as hemiepiphytes, commonly occurring in humid tropical regions in the world (Putz & Holbrook Reference PUTZ and HOLBROOK1986). Like epiphytic ferns, hemiepiphytic figs are also subjected to a higher selection pressure of frequent water deficit during their initial life stage than their later ones, owing to water and minerals being less accessible for hemiepiphytic plants than for terrestrial ones. Therefore, hemiepiphytic plants may continue with a water conservation strategy even after becoming rooted in the ground, which potentially affects the efficiency of lightfleck use.
In this study, the measurements were made of photosynthetic traits, photosynthetic induction in response to simulated lightflecks, and induction loss after a lightfleck in a range of epiphytic and terrestrial ferns, and hemiepiphytic and terrestrial figs. The following two hypotheses were tested: (1) the epiphytes or hemiepiphytes display slower responses to lightflecks and faster induction loss after a lightfleck compared with their terrestrial counterparts; and (2) fern species present slower responses to a lightfleck and slower induction loss after a lightfleck compared with fig species.
METHODS
Study site and plants
This study was carried out at the Xishuangbanna Tropical Botanical Garden (21°41′N, 101°25′E, altitude 600 m), Chinese Academy of Sciences, southern Yunnan, south-west China. The mean annual temperature is 21.6°C, and the annual precipitation is about 1560 mm. Twelve species were chosen for the study, including three epiphytic fern species (Neottopteris nidus (L.) J. Sm. (synonym Asplenium nidus L.) (Aspleniaceae), Microsorum punctatum (L.) Copel. (Polypodiaceae) and Pseudodrynaria coronans (Wall. ex Mett.) Ching (Polypodiaceae)), three terrestrial fern species (Asplenium finlaysonianum Wall. ex Hook. (Aspleniaceae), Paraleptochilus decurrens (Blume) Copel. (Polypodiaceae), and Tectaria fauriei Tagawa (Aspidiaceae)), three hemiepiphytic fig species (Ficus curtipes Corner, Ficus gibbosa Bl. and Ficus altissima Bl.), and three terrestrial fig species (Ficus auriculata Lour., Ficus oligodon Miq. and Ficus hookeriana Corner). Ferns were collected from a nearby nature reserve and then cultivated in a screenhouse of 4% full sunlight for adaption for 1 y. The screenhouse was constructed with neutral shade netting supplying irradiance of 4% daylight. The relative irradiance under the shade plots were estimated by integrating PPFD under the shade plots compared with that in a fully open site over a clear day in the summer. The PPFD was measured with Li-190SA quantum sensors connected to a Li-1400 data logger (LI-COR, Lincoln, NE, USA). Seeds of the six fig species were collected from mature trees planted in the botanical garden, and were germinated in plastic pots (30 cm height and internal diameter) in soils obtained from a tropical rain forest. The potted fig seedlings were also placed in the same screenhouse for 4 mo, watered as needed. When our physiological measurements were made, the ferns were about 35–80 cm high, and the fig seedlings were about 40–60 cm high. All measurements were made on the new fully developed leaves in the screenhouse at ambient temperature, with relative humidity 80–90%.
Leaf structure and chlorophyll concentration
Leaf anatomy and chlorophyll concentration (Chl) were measured on a mature leaf from each of six plants per species. Leaves were sampled and each leaf was then cut into two parts along the midrib. One half of the leaf was used to determine chlorophyll concentration with extraction by 95% ethanol (Lichtenthaler & Wellburn Reference LICHTENTHALER and WELLBURN1983). The area of another half was measured with a portable leaf area meter (LI-3000A, LI-COR, Lincoln, NE, USA). Leaf segments were dried at 80 °C for 48 h and then leaf mass per unit area (LMA) was calculated. Leaf thickness (LT) was measured on hand-cut transverse sections with a light microscope. Stomatal density (SD) and guard cell length (GCL) were measured on epidermal impressions made with colourless nail polish. At least three fields of each of six leaves from six plants per species were observed.
Gas exchange
Gas exchange was measured in the morning (08h00–11h30) September–October 2006 to avoid possible midday and afternoon depression, using an infrared gas analyser (LI-6400, LI-COR, Lincoln, NE, USA). For each species, five to six fully expanded mature leaves from different plants were selected for the measurements. Photosynthetic light response curves were measured with PPFD descending from high to low light. The fern leaves were illuminated with 300 μmol m−2 s−1 PPFD for at least 30 min, and fig species 700 μmol m−2 s−1 for at least 20 min before measurements. CO2 concentration inside the leaf chamber was maintained at 380 μmol mol−1 through the integrated CO2 controlling system of the gas analyser. Mean relative air humidity was 80% ± 5%. According to the method described by Bassman & Zwier (Reference BASSMAN and ZWIER1991), we calculated the photosynthetic parameters: apparent quantum yield (AQY), dark respiration rate (R d), light compensation point (LCP), light saturation point (LSP), and maximum net photosynthetic rate (A max'). Intrinsic photosynthetic water use efficiency (WUE) was calculated as A max'/g s-max', where g s-max' is the maximum stomatal conductance obtained from the light response curve. Photosynthetic induction experiments were conducted on the leaves used for photosynthetic light response curves. The sampled leaves were shaded by a one-layer screen overnight until the measurements were made the next day, preventing leaves from being photosynthetically pre-induced. During the measurements, leaves were enclosed in the leaf chamber and illuminated with low light (approximately 20 μmol m−2 s−1) for at least 30 min. Photosynthetic rate under this low light (A d) was recorded after a steady state was reached. Afterwards, the leaf was exposed to a photosynthetically saturating PPFD determined from the light response curves, using an integrated LED light source. Net photosynthetic rate (A n) was recorded at 2-s intervals for the first 5 min, and then every 56 s until the stable maximum assimilation rate (A max) was achieved. The following parameters were determined: time to reach 50% (T 50) and 90% full induction (T 90), and the initial (gs-initial) and maximum stomatal conductance (gs-max). The T 50 and T 90 were estimated by fitting the curves with a sigmoidal equation (Zipperlen & Press Reference ZIPPERLEN and PRESS1997). The leaf was then shaded (approximately 20 μmol m−2 s−1 PPFD) for 20 min, and then was exposed to a saturating PPFD for 60 s and the net photosynthetic rate at 60 s (A) was determined. The induction state (IS60) after the 20-min darkness was calculated as IS60 = (A–A d)/(A max–A d) (Chazdon & Pearcy Reference CHAZDON and PEARCY1986b).
Statistical analysis
The significances of the differences in the means between two life forms within ferns or figs were assessed by Student's t-test. The relationship between g s-max' and A max' was fitted by a linear regression, and between g s-initial and T 50 or T 90 were fitted by a double exponential decay equation.
RESULTS
Differences in leaf morphological and photosynthetic traits
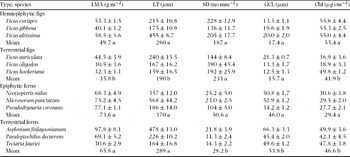
The mean LMA (t34 = 4.17, P < 0.001), LT (t34 = 2.19, P < 0.05) and Chl (t34 = 4.74, P < 0.001) of the hemiepiphytic figs were significantly higher than those of the terrestrial figs, with no differences in mean SD and GCL between these two life forms (Table 1). Epiphytic and terrestrial ferns were similar in LMA and LT, with significantly lower Chl (t34 = −6.25, P < 0.001) in the former. The figs had higher LMA (t70 = −6.26, P < 0.001) and LT (t70 = −3.40, P < 0.001) but smaller and denser stomata than the ferns.
Leaf traits of 12 species studied. Entries are mean ± SE from six individuals of each species. LMA, leaf mass per unit area; LT, leaf thickness; SD, stomatal density; GCL, guard cell length; Chl, chlorophyll concentration. Different letters indicate significant differences in the means between two plant types within figs or ferns.

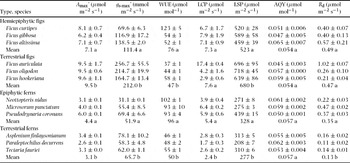
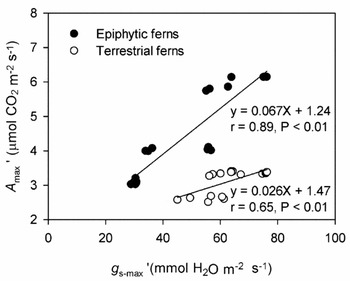
Figs varied strongly in A max', g s-max', and LSP excepting LCP, AQY and R d (Table 2). Photosynthetic light response curves of the four representative species are shown in Figure 1. Epiphytic and terrestrial ferns were statistically different in A max' (t34 = 4.15, P < 0.001), g s-max' (t34 = −3.51, P < 0.01), LCP (t34 = 13.2, P < 0.001), and R d (t34 = −11.0, P < 0.001). The figs had significantly greater A max' (t70 = 11.7, P < 0.001), g s-max' (t70 = 9.48, P < 0.001), LCP (t70 = 3.42, P < 0.01), LSP (t70 = 8.88, P < 0.001), and R d (t70 = −3.35, P < 0.01) than the ferns. Epiphytic ferns and hemiepiphytic figs had higher WUE than the terrestrial plants (t70 = 12.7, 3.51; P < 0.001, 0.01. respectively), with no difference in WUE between ferns and figs (Table 2 and Figure 2).
Photosynthetic light response curves of fully mature leaves of the four representative species studied: the epiphytic fern Neottopteris nidus (●), the terrestrial fern Asplenium finlaysonianum (○), the hemiepiphytic fig Ficus altissima (◆) and the terrestrial fig Ficus oligodon (●). Data are mean ± SE (n = 6).

Gas exchange parameters for the six fig and six fern species. Entries are mean ± SE from six individuals of each species. A max', maximum net photosynthetic rate; g s-max', maximum stomatal conductance recorded during the measurement of light response curve; WUE, water use efficiency; LCP, light compensation point; LSP, light saturation point; AQY, apparent quantum yield; R d, dark respiration rate. Different letters indicate significant differences in the means between two plant types within figs or ferns.

The relationships between maximum photosynthetic rate (A max') and maximum stomatal conductance (g s-max'). Each point is from one measurement of one plant per species (n = 6).

Induction time and induction loss
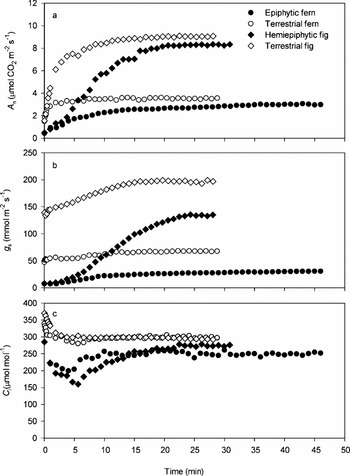
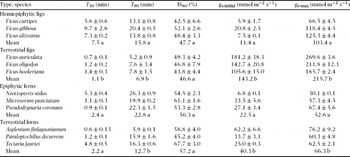
The time courses of photosynthetic induction in the four representative species of different life forms were shown in Figure 3. There was no significant difference in mean T 50 between the epiphytic and terrestrial ferns, whereas hemiepiphytic figs had lower mean T 50 than terrestrial figs (Table 3). The means of T 90 in the epiphytic ferns (19.8–26.3 min) and the hemiepiphytic figs (13.1–20.4 min) were significantly slower than that in the terrestrial ferns (5.9–16.3 min) and terrestrial figs (5.2–7.8 min), respectively. The figs had much faster induction responses compared with the ferns.
The response of net photosynthesis (A n; a), stomatal conductance (g s; b) and intercellular CO2 concentration (Ci; c) to a simulated lightfleck in the four representative species: the epiphytic fern Neottopteris nidus (●), the terrestrial fern Asplenium finlaysonianum (○), the hemiepiphytic fig Ficus altissima (◆) and the terrestrial fig Ficus oligodon (●). Typical data for a leaf are shown. Leaves were first exposed to 20 μmol photons m−2 s−1 until rates of gas exchange were steady; a simulated lightfleck was then imposed by increasing irradiance to the saturated light. The simulated lightfleck started at time 0.

Photosynthetic induction parameters in six fig and six fern species. Data are means ± SE of time required to reach 50% (T 50) and 90% of maximum net photosynthetic rate (T 90), induction state (IS60) measured after 20 min of dark-adaption following the full induction, initial stomatal conductance (gs-initial) and maximum stomatal conductance (gs-max). The group means in one column with the same letter are not significantly different for either figs or ferns, respectively (P > 0.05).
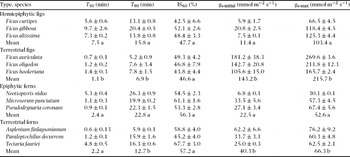
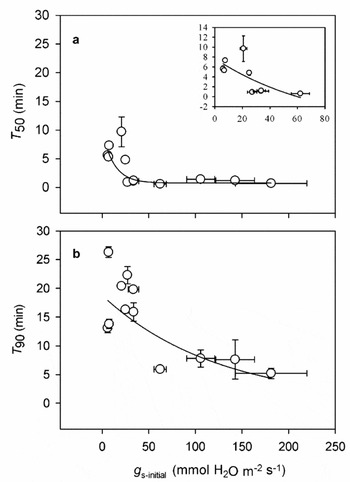
The hemiepiphytic figs had much lower g s-initial compared to their terrestrial counterparts. Similarly, the epiphytic ferns had lower g s-initial than their terrestrial counterparts. g s-initial and T 50 or T 90 were negatively correlated when pooling data for 12 studied species. After g s-initial exceeded the threshold of 50 mmol m−2 s−1, it had no effect on T 50 (Figure 4a). This was not so between T 90 and g s-initial (Figure 4b). Although ferns had slow induction response, they tended to maintain higher photosynthetic induction state than the fig seedlings after full induction (Table 3).
The relationships between time required to reach 50% (T 50) (a) or 90% (T 90) (b) of the maximum net photosynthetic rate and the initial stomatal conductance under the low light (gs-initial) in the 12 species studied. The inset represents the relationship between T 50 and gs-initial when gs-initial is below 70 mmol H2O m−2 s−1.

DISCUSSION
By comparing leaf morphological traits and photosynthetic light induction responses across epiphytic ferns, hemiepiphytic figs, and their terrestrial counterparts, this study provided evidence of a trade-off between conserving water and maximizing carbon gain of these relatively less-investigated plant groups. Water conservation is more important for epiphytic and hemiepiphytic plants. Ferns and figs presented significant differences in stomatal regulation and photosynthetic light induction characteristics, probably resulting from the difference in their vascular system and hence hydraulic conductance.
Difference in leaf morphology between plant groups
Epiphytic ferns and hemiepiphytic figs had thicker leaves than their terrestrial counterparts (Table 1), consistent with previous studies (Holbrook & Putz Reference HOLBROOK and PUTZ1996, Watkins et al. Reference WATKINS, RUNDEL and CARDELUS2007). Thick and dense leaves favour epiphytes to adapt to drought-prone epiphytic habitats, reducing transpiration and increasing water use efficiency (Gratani & Bombelli Reference GRATANI and BOMBELLI2001). The ferns had larger and sparser stomata than figs (Table 1), consistent with other studies (Hietz & Briones Reference HIETZ and BRIONES1998, Holbrook & Putz Reference HOLBROOK and PUTZ1996). Ferns have low stomatal conductance and consequently low photosynthetic capacity in this study, as in other reports (Brodribb & Holbrook Reference BRODRIBB and HOLBROOK2004, Brodribb et al. Reference BRODRIBB, HOLBROOK, ZWIENIECKI and PALMA2005), which could result from the vascular system of ferns not being well developed to allow fast transpiration through dense stomata. However, low density of stomata might be favourable for epiphytic ferns to reduce transpirational water loss (Cao Reference CAO2000). Under low-light condition, ferns had lower LCP and R d than the figs, conferring a positive carbon gain.
Difference in photosynthetic induction time between plant groups
Epiphytes are prone to frequent water deficits, and their water use strategies are conservative. We hypothesized that the conservative water use strategy would influence their performance of lightfleck utilizations. Our results showed that the photosynthetic induction upon receiving lightflecks was slower in the epiphytic ferns and the hemiepiphytic figs compared with their terrestrial counterparts, and the induction time was negatively correlated with initial stomatal conductance, consistent with other studies (Bai et al. Reference BAI, LIAO, JIANG and CAO2008, Valladares et al. Reference VALLADARES, ALLEN and PEARCY1997). Because the time course of photosynthetic induction after 1 or 2 min is predominantly determined by stomatal conductance and Rubisco activation (Kirschbaum & Pearcy Reference KIRSCHBAUM and PEARCY1988, Pons et al. Reference PONS, PEARCY and SEEMANN1992), inter- and intra-specific differences in induction time are likely caused by differences in the dynamic responses of the slow-inducing component, stomatal opening. We found that epiphytes (or hemiepiphytes) had significantly lower gs-initial compared with their terrestrial counterparts under low light in the present study, which should account for the significant difference in the photosynthetic induction time between the groups in view of the relationships between T 90 and g s-intial (Figure 4). Carbon assimilation of epiphytic or hemiepiphytic plants is constrained by slow photosynthetic induction and low stomatal conductance, which reduce water loss and the risk of water deficits. As growing in the habitats with frequent water shortage, conserving water for survival is far more important for the epiphytic or hemiepiphytic plants than maximizing carbon assimilation to enhance growth.
Ferns showed slower responses to lightfleck and induction loss after a lightfleck compared with figs, probably due to higher water diffusive resistance and lower water transport capacity, and consequently slower stomatal opening and closing reactions in the leaf of ferns (Aasamaa et al. Reference AASAMAA, SOBER and RAHI2001, Brodribb et al. Reference BRODRIBB, HOLBROOK, ZWIENIECKI and PALMA2005, Sack & Holbrook Reference SACK and HOLBROOK2006). The range of stomatal movement in ferns is much lower than that in most terrestrial understorey herbs, shrubs and tree saplings (Allen & Pearcy Reference ALLEN and PEARCY2000, Chazdon & Pearcy Reference CHAZDON and PEARCY1986a, Pfitsch & Pearcy Reference PFITSCH and PEARCY1989, Valladares et al. Reference VALLADARES, ALLEN and PEARCY1997). Kaiser & Kappen (Reference KAISER and KAPPEN2000) suggested that the fine-tuning of stomatal conductance may require slow opening and closing reactions to avoid overshooting. This mechanism may also explain why our second expectation, a faster induction loss in ferns, was rejected. Lower rates of induction have also been reported for the epiphytic orchid Aspasia principissa (Zotz & Mikona Reference ZOTZ and MIKONA2003). T 90 in three epiphytic ferns and three hemiepiphytic figs in this study is slower than most understorey shrubs, herbs and saplings reported in the literature (< 10 min; Kursar & Coley Reference KURSAR and COLEY1993, Ögren & Sundin Reference ÖGREN and SUNDIN1996, Rijkers et al. Reference RIJKERS, DE VRIES, PONS and BONGERS2000, Roden & Pearcy Reference RODEN and PEARCY1993, Tang et al. Reference TANG, KOIZUMI, SATOH and IZUMI1994).
The epiphytes are not only adapted to drier conditions but also to the lower air CO2 concentration, as they usually grow higher up on the trunks and branches above the forest floor than the juveniles of their terrestrial counterparts. It is well known that there is a strong gradient in CO2 concentration in forest understoreys that persists through much of the morning. High CO2 concentration is known to increase intercellular CO2 concentration and to reduce the time required for photosynthetic induction, and thereby to increase carbon gain during sunflecks (Leakey et al. Reference LEAKEY, SCHOLES and PRESS2005). This increases the difference in both photosynthetic induction time and stomatal response to sunflecks between the epiphytic or hemiepiphytic and terrestrial plants under experimental conditions of this study.
In conclusion, the epiphytic ferns and hemiepiphytic figs exhibited water-conservation leaf structures, and much slower photosynthetic induction in response to lightflecks than their terrestrial counterparts. These differences in lightfleck use as well as other leaf functional traits may drive the coexistence of ferns and figs with different life forms in a tropical rain-forest community.
ACKNOWLEDGEMENTS
We thank our colleague Y.-J. Zhang for his useful suggestions on the manuscript. This work was supported by Chinese Ministry of Science and Technology through a grant (No. 2006CB403207) under a major 973 project and by West Light Foundation of Chinese Academy of Sciences through a grant to J.-L. Zhang.