Introduction
Alzheimer's disease (AD) is a large threat to public health in the twenty-first century (Thompson et al., Reference Thompson2007). Dementia doubles in frequency every five years after the age of 60, afflicting 1% of all 60–64-year olds and 30–40% of those aged 85 years or more (Jorm et al., Reference Jorm, Korten and Henderson1987; Thompson et al., Reference Thompson2007). The neurofibrillary pathology of AD typically emerges first in the entorhinal cortex and hippocampus before spreading cortically to affect the rest of the temporal, parietal and frontal lobes (Braak and Braak, Reference Braak and Braak1991; Reference Braak and Braak1997; Gomez-Isla et al., Reference Gomez-Isla, Price, McKeel, Morris, Growdon and Hyman1996; Laakso et al., Reference Laakso1996; Thompson et al., Reference Thompson2003). Decreased synaptic density, overt neuronal loss and atrophy are evident on magnetic resonance imaging (MRI) as progressive cortical gray matter loss, reduced subcortical gray and white matter volumes, and expanding ventricular and sulcal cerebral spinal fluid (CSF) spaces (Thompson et al., Reference Thompson2004; Reference Thompson2007). Brain atrophy varies among individuals with clinically diagnosed AD. The brain atrophy in individual AD patients includes not only specific atrophy from AD pathology, but also atrophy induced by normal aging and cerebral vascular diseases (Wu et al., Reference Wu2002).
Medial temporal lobe atrophy (MTA) has been found to be an early sign of AD (Wahlund et al., Reference Wahlund, Julin, Johansson and Scheltens2000). It is also suggested to be one of the most important diagnostic markers for AD, as pointed out in the new diagnostic criteria proposed for AD. Most volumetric studies of mild cognitive impairment (MCI) and AD patients have focused on the medial temporal lobe structures. One of the most important and most studied structures of the medial temporal lobe is the hippocampus. Several studies have shown that patients with mild AD have a hippocampus that is about 25% smaller than age-matched controls (Callen et al., Reference Callen, Black, Gao, Caldwell and Szalai2001; De Santi et al., Reference De Santi2001; Du et al., Reference Du2001; Thompson et al., Reference Thompson2007), whereas MCI patients show a reduction of around 11% (Du et al., Reference Du2001). Female sex has been suggested to be a risk factor for AD (Barnes et al., Reference Barnes, Wilson, Bienias, Schneider, Evans and Bennett2005). The left hippocampus may be more vulnerable in AD than the right hippocampus due to the smaller volume of the former (Du et al., Reference Du2001; Pennanen et al., Reference Pennanen2004; Muller et al., Reference Muller2005). It has also been suggested that small hippocampal volume at baseline may be associated with cognitive impairment and may predict the decline to dementia (Convit et al., Reference Convit1997; Jack et al., Reference Jack2000). One population-based study found that reductions in hippocampal volume can be present before dementia but not until cognitive impairment is relatively severe (Wu et al., Reference Wu2002). To verify the development of MTA and hippocampal atrophy as diagnostic markers for AD, reliable and validated reference values for normal aging are needed. However, the majority of studies on MTA and hippocampal atrophy is based on selected study populations. In order to obtain reliable and clinically useful reference values for hippocampal volume in non-demented healthy aged persons, a study based on randomly selected population needs to be performed.
As a part of the normal aging process, atrophy of the hippocampus and other brain structures has also been found to emerge in healthy adults (Tang et al., Reference Tang, Whitman, Lopez and Baloh2001). Atrophy rate (% per year) was used to express the rate at which hippocampal size is reduced during a follow-up period. Adjusting for head size, an early study showed that the amygdala-hippocampus complex atrophied at a rate of 0.3% per year and the third and lateral ventricles expanded by 2.8% and 3.2%, respectively, in healthy volunteers (36–91 years old), but there was no gender difference in the atrophy rate (Coffey et al., Reference Coffey1992). However, one study (Lupien et al., Reference Lupien2007) reported that the speed of decrease in hippocampal volume is greater in healthy males than in females. It has been reported that age-related hippocampal shrinkage starts in the mid-40s (Pruessner et al., Reference Pruessner, Collins, Pruessner and Evans2001; Jernigan and Gamst, Reference Jernigan and Gamst2005), which is in line with a study of brain weights based on over 20,000 autopsy cases (Dekaban, Reference Dekaban1978). In cross-sectional study, smaller hippocampal volume occurred in middle-aged and old aged healthy males as compared to females (Pruessner et al., Reference Pruessner, Collins, Pruessner and Evans2001). Few studies have reported a lateral asymmetry of the hippocampus in healthy subjects, although many other brain structures have larger volumes on the right side as compared to the left (Carne et al., Reference Carne, Vogrin, Litewka and Cook2006).
The aim of the study is twofold. In order to implement MTA and the hippocampus as a diagnostic marker for AD, more reliable data on normal hippocampal volumes obtained from a large population-based study is needed. The first aim, therefore, is to create a normative database of hippocampal volumes in different age cohorts (60–90+), and study the gender difference and the lateral symmetry as compared with the lateral and third ventricle in our large population-based study. Further, it has not been established if there is an acceleration of hippocampal atrophy in normal aging, as was shown in the progression of AD. If there is, at what age does an acceleration of hippocampal atrophy start in elderly people without dementia? The second aim is therefore to study the aging atrophy trend (AAT; a term used here to express the speed and acceleration of brain atrophy, i.e. the atrophy trend in a cross sectional volume database, rather than atrophy rate as used in longitudinal data).
Methods
Subjects
Five hundred and fifty-two subjects were recruited into the MRI study by using a subsample of an epidemiological sample of 3363 healthy elderly people without dementia aged over 60 years, who were participating in the Swedish National study of Aging and Care in Kungsholmen (SNAC-K). This is a longitudinal, multidisciplinary study on aging and health, which began in 2001. SNAC-K was designed to detect the influence of lifetime genetic, environmental and biological factors on medical, psychological and social health in late adulthood. The SNAC-K samples were stratified by age and year of assessment. Eleven age cohorts were chosen with different assessments intervals: six years in the younger cohorts (60–78 years old), and three years in the older cohorts (age 78+). The follow-up intervals were determined in order to balance the more rapid changes and higher attrition in the older cohort. The baseline data collection includes information on present status and past events. The information has been collected through interviews, clinical examinations, and testing. The baseline data collection was completed in June 2004 and the follow-up data collection is ongoing.
During the baseline SNAC-K examination, 552 subjects were randomly selected from all non-institutionalized and non-disabled participants to undergo an MRI examination in order to recruit an MRI subsample for the study population. On average, these 552 subjects are slightly younger, more educated and cognitively advantaged compared to the remaining sample. Subjects with severe cerebral diseases that directly affect brain atrophy were excluded. After a quality assessment of the baseline MRI images, 544 subjects (aged 60–97 years old; 318 females and 226 males) were finally included in this MRI study at baseline. Due to the small sample size in the groups 87 years old and 87+ years, these groups were combined into one group. Thus, a total of seven age groups (60, 66, 72, 78, 81, 84, and 87+ years) were used in the study.
MRI acquisition
MRI scanning was undertaken on a 1.5T scanner (Philips Intera, Netherlands). 3D FFE (fast field echo) T1, Axial SE (spin echo) PD/T2, Axial FLAIR (fluid-attenuated inversion recovery) and Axial DTI (diffusion tensor imaging) were acquired. In this study, the 3D FFE T1 images (TR = 15ms, TE = 7ms, Flip angle = 5°, number of slices = 128, thickness = 1.5mm, FOV = 240, matrix = 256*256) were used for volumetry.
Image processing
Images were transferred to a HERMES workstation (Nuclear Diagnostics, Stockholm, Sweden) where each volumetric measurement was performed with constant parameters by a neuroradiologist (Y.Z) who was blinded to clinical information. In this way, as much uniformity as possible was achieved in the subjective aspects of image processing and measurement through all subjects in the study. The transversal MPRAGE images were reoriented to coronal sections orthogonal to AC-PC (anterior commissure to posterior commissure) line. STEREOLOGY (Sheline et al., Reference Sheline1996), self-developed volumetric software in HERMES, was used to acquire intracranial volume (ICV). This is a relatively accurate semi-automatic method for estimating large brain structures that would be time-consuming to delineate directly. With a ROI tool in HERMES MultiModality, hippocampal formation was manually delineated. Another semi-automatic tool of Region Growing in HERMES MultiModality was used to measure lateral and third ventricles. Because of the individual variations of signal intensity distribution, a test of the growing effect by visual checking was done to set specific individual parameters before each final growing volume was produced. When “leakage” of ROI happened after growing, manually masking before growing was performed.
Volumetric measurements
Hippocampus formation
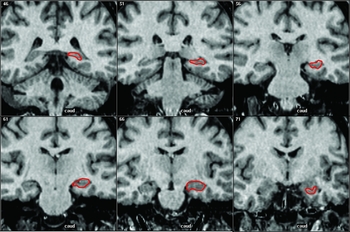
A previous protocol (Pantel et al., Reference Pantel2000), which was focused on anatomic accuracy, was slightly modified to delineate hippocampus formation. It was defined to include the gray matter: hippocampus proper (cornu ammonis regions; Ammon's horn), the dentate gyrus, the subiculum and some white matter (alveus, fimbria). Parahippocampal gyrus, entorhinal cortex, and fornix were excluded. One valuable advantage of the protocol is that it includes the full tail of hippocampus. The anterior limit of hippocampus in the original protocol was modified since it was hard to identify in some brains.
To find the posterior limit, the slice where the fornix is most clearly seen in the coronal plane is determined, and the gray matter of the hippocampus is followed through posterior slices until no more gray matter is seen. Measurement starts at this location, which is the hippocampal tail that extends to the gray matter that protrudes into the triangle of the lateral ventricle, ventral to the splenium of the corpus callosum. The lateral border is defined by the temporal horn of the lateral ventricle and/or white matter adjacent to the hippocampal gray matter. The inferior border is demarcated by the white matter of parahippocampal gyrus. For the superior boundary, the alveus is included where it overlays the hippocampus, excluding the pulvinar. For the mesial boundary on the posterior slices, the natural border of the gray matter is followed. On more anterior slices, the uncal notch is determined and the measurement is done straight up from there as the mesial boundary. The anterior border is complicated by the presence of the amygdala. The signal intensity difference between hippocampus and amygdala is used to identify the border, instead of anatomic markers (Figure 1).
The delineation of hippocampus formation.

Third ventricle
The anterior boundary is where the lower portion of the ventricle opens into the CSF at the outer brain surface, whilw the posterior end is where the superior colliculi first fuse with the cerebrum. The crus of fornix and the prolonged line from it form the superior border. The border of CSF served as the other boundaries.
Lateral ventricle
Except choroid plexus, all of CSF areas of lateral ventricle were included.
ICV
Any structures inside the inner table of the skull were included: total brain, dura, ventricles and extraventriclar CSF, brain stem and cerebellum. The boundary between the spinal medulla and brain stem is considered to be at the level of the bottom of the cerebellum.
Intra-rater reliability
Intra-rater reliability of the measurements was tested in 15 randomly selected subjects by repeated measurements with an interval of one month. The intraclass correlation coefficients (ICC) of the measurements were > 0.93.
Statistical analyses
Descriptive statistics were used to describe normal brain values (volume) in gender groups. MANOVA was used to compare the differences in brain structure volumes between women and men, adjusted by age, ICV and education. Dependent T-tests were performed to identify the difference in hippocampal volume between right and left side. Lateral asymmetry of the hippocampus was defined as the absolute value of (Right – Left)/(Right + Left)/2. The contributions of age, gender and education to structure volumes were analyzed using multiple regression analysis. To avoid the influence of ICV on structure volumes, the volumes used in the multiple regression analyses were normalized by the mean of ICV. The speed of AAT (the percentage decline per year) was calculated from the regression coefficient (β value) in the regression equations, divided by mean volume. The mean volumes of each age group were used to identify the possible age points of atrophy acceleration. To confirm an age point, piecewise regression analyses were used to examine the significance of the possible turning points.
Results
Descriptive statistics
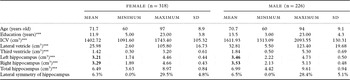
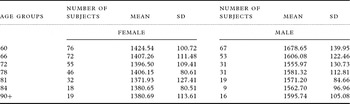
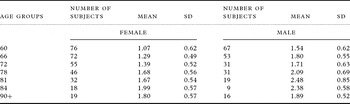
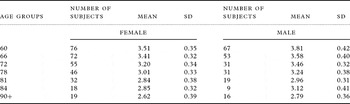
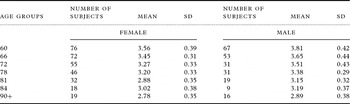
The raw values of the brain volumes are presented in Table 1. The range between maximum (2093.55 cm3) and minimum (1091.60 cm3) ICV in the study was rather large, which reflects the big variation in head size of the subjects. A large variation in the volumes of the lateral ventricles was accordingly seen, with the ratio between maximum and minimum volume being 48 (123.40 cm3/2.60 cm3). The mean ± 1.96 * the standard deviation of total hippocampus volume in males was 6.99 ± 1.84 cm3, and in females 6.49 ± 1.65 cm3. The raw brain volumes for each age group are shown in Table 2.
Descriptive statistics: MONOVA and dependent T-test results for demographic data and brain structures volumes

In the MONOVA results, the variables marked *** indicate strong significant differences (P < 0.001) between the two gender groups. The analysis of intra-cranial volume (ICV) was adjusted by age and education. The other analyses of brain structures were adjusted by age, ICV and education. A strong significant difference (P < 0.001) was found between left and right hippocampal volume (indicated in bold) by a dependent T-test analysis. Lateral symmetry of the hippocampus was defined as the absolute value of (Right – Left)/0.5 × (Right +Left).
Intra-cranial volume (ICV) by age groups

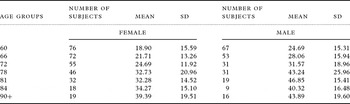
Raw volume of lateral ventricle by age groups

Raw volume of third ventricle by age groups

Raw volume of left hippocampus by age groups

Raw volume of right hippocampus by age groups

The unit of volume is cm3.
Gender differences
The gender differences were calculated using MANOVA (Table 1). The two gender groups did not differ by age. The male sample had received more education than the female sample. ICV was significantly larger (around 15%) in males than in females. The analysis of ICV was adjusted by age and education.
The MANOVA also revealed strongly significant (P < 0.001) gender differences in volume for all brain structures after adjustment for age, ICV and education. The lateral ventricles and third ventricle were larger in males than in females. The normalized volumes of left, right and total hippocampus in males were smaller than those in females, even if the mean of raw volumes were bigger in males (as shown in Table 1).
Lateral asymmetry
A strong significant difference (P < 0.001) was also shown between left and right hippocampal volumes by a dependent T-test analysis. The right hippocampus was larger than the left, regardless of gender. The mean of the lateral asymmetry was around 6% between the left and right hippocampus. The maximum lateral difference was around 29%. Approximately 18% of the subjects had lateral differences over 10%. There was no significant gender difference in the lateral asymmetry of the hippocampus.
Speed of AAT
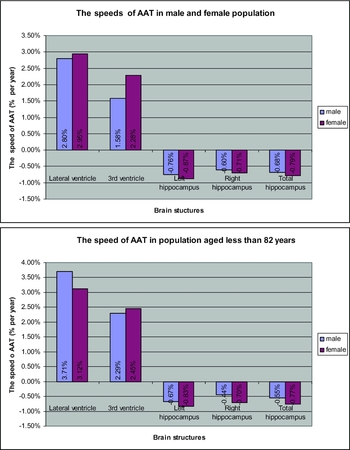
In the first multiple regression analyses, age, gender and especially education (P < 0.001) contributed significantly to all normalized brain volumes. An interaction of age * gender was also found to contribute significantly (P < 0.001) to the volumes. As education had no effect on the volumes, the second regression analyses (only age contributes to volume) were performed separately in the two gender groups for each of the brain structures. The speed of AAT (% decline per year) was calculated from the regression coefficient (β value) in the successful regression equations (P < 0.001), divided by mean volume (Figure 2a). Total hippocampal volume was reduced by 0.68% per year in males, and by 0.79% in females across the entire age span (60–87+ years). The speed of AAT expressed as the expansion of the lateral ventricles (2.80% per year in males, 2.95% per year in females) and third ventricle (1.58% per year in males, 2.28% per year in females) was larger than that in hippocampal shrinkage. The speed of AAT in females was shown to be significantly faster than that in males due to the successful interacted (age * gender) contribution to volume. Owing to the dramatic volume changes in the two oldest age groups (Figure 3), the analyses were repeated in subjects younger than 83 years. Results similar to those for the full age range were obtained (Figure 2b).
The speeds of AAT in the population.

The mean volumes of brain structures by age groups.

Acceleration of AAT
The mean normalized volumes in each age group are shown in Figure 3 in order to identify the possible age point at which atrophy acceleration starts. The significance of each possible turning age point from these observations was tested by piecewise regression analysis. The significant turning point in total hippocampal volume across the whole gender group was at 72 years of age; i.e. there was significant difference in the atrophy slopes for the total hippocampus before and after 72 years of age. This age point is therefore suggested as representing the time when acceleration of AAT in the hippocampus starts in normal aging. Attempts to find similar turning points for other brain structures were negative.
Discussion
Through the use of quality MRI images and volumetric methods, we were able to describe the natural status of brain atrophy in a large number of non-demented elderly people. We focused on the gender differences and lateral symmetry of hippocampal and ventricular size in order to better understand the diversity of results in volumetric studies in the literature. This diversity, which could be due to different selection of samples, different age ranges, protocols of delineations, quality of images, and controlling for ICV or not (Coffey et al., Reference Coffey1992), obscures our understanding of hippocampal shrinkage in normal aging. In this population-based study, the large number of subjects and the carefully selected protocol of delineation that focused on accuracy should make it possible to obtain a more valid assessment of age-related brain atrophy.
The very large individual variance in head size and the significant gender differences indicate that it is essential that the brain volumes are adjusted or normalized by head size in all analyses. Such normalization has been used more and more widely in studies reported in the literature.
Expanding ventricles represent central atrophy, which might be induced by silent cerebrovascular changes in subcortical and peri-ventricular areas in the elderly. Such cerebrovascular changes might be an important component of cerebral degeneration. The large variation in ventricle size found in our study suggests a large variance in distribution and progression of silent cerebrovascular lesions in a non-demented elderly population.
It has been argued that atrophy in the left hippocampus is more severe than that in the right in AD patients and therefore more vulnerable to AD pathology (Barnes et al., Reference Barnes, Wilson, Bienias, Schneider, Evans and Bennett2005). In the non-demented population in this study, however, the left hippocampus was smaller than the right. The finding that lateral asymmetry of the hippocampus is the norm in non-demented elderly, rather than a result of AD pathology, may be seen as contradicting the notion that the left hippocampus is more vulnerable for AD. A larger right cerebral hemisphere has been seen in relatively young adults (Carne et al., Reference Carne, Vogrin, Litewka and Cook2006). This may imply that the right hippocampus has been larger than the left in young adults, but this needs to be proved by further studies with young subjects.
The males in the study showed bigger ventricles and a smaller hippocampus than the females. This finding is in line with other studies showing similar gender differences (Pruessner et al., Reference Pruessner, Collins, Pruessner and Evans2001). However, this does not imply that male elderly persons have more severe brain atrophy since this could just be the natural state in young healthy subjects. To identify whether males or females have more severe atrophy, the rate of volume loss in longitudinal studies and AAT in cross-sectional studies need to be considered. Concerning speed of AAT in this study, the atrophy of the hippocampus in female was faster than that in males, regardless of inclusion or exclusion of the oldest subsamples. Our finding is consistent with that in a previous study (Pruessner et al., Reference Pruessner, Collins, Pruessner and Evans2001), supporting the view that females are more vulnerable to hippocampal atrophy than males, even if the males have bigger ventricles and a smaller hippocampus than the females, which might have existed from early adulthood. To confirm this, however, more studies including younger adults are needed.
The conclusions that age and gender are the important factors in brain atrophy (Tang et al., Reference Tang, Whitman, Lopez and Baloh2001; Raz et al., Reference Raz, Gunning-Dixon, Head, Rodrigue, Williamson and Acker2004) are confirmed in our study. Though education is related to AD (Paradise et al., Reference Paradise, Cooper and Livingston2009), it makes no contribution to hippocampal atrophy and the expansion of ventricles in a non-demented elderly population.
Dramatic volume changes of brain structures in the two oldest age groups were observed (Figure 3). The expansion of ventricles was shown to reverse after 81 years of age, especially in males. Hippocampal atrophy in both genders was reversed between 81 and 84 years, but went on shrinking after 84 years. This could be due to a possible increase in mortality or morbidity due to dementia around 81–84 years, and less atrophy in the surviving or non-demented very aged elderly. Therefore, care should be taken in interpreting results when very old subjects are included in volumetric studies. A small sample size in very aged groups, however, can also influence the results.
In addition to estimating the speed of AAT, a further important aim of this study was to find the acceleration point of AAT. We found that 72 years was the age at which acceleration of total hippocampal atrophy started. To the best of our knowledge, no previous study has shown such an age point for the acceleration of hippocampal atrophy in a non-demented elderly population. For expansion of the ventricles, no such acceleration in atrophy was found. The finding that acceleration of hippocampal atrophy is present among healthy aged subjects must be further evaluated in longitudinal studies. From these data we cannot exclude the effect of selection bias in the older groups. The alternative might be that the accelerated hippocampal atrophy is due to pre-clinical AD pathology striking the medial temporal lobe.
The selection of discontinuous ages in the subjects is one limitation of the study. Somewhere between 70 and 75 years, instead of 72 years, might better represent the age at which acceleration of hippocampal atrophy starts. A continuous age range would make it possible to study more precisely the age point when atrophy acceleration starts. To clarify the full progression of brain atrophy in life span, younger subjects also need to be included in future studies.
In conclusion, males had smaller hippocampal volumes (normalized by ICV) than females; however, the females were more vulnerable to hippocampal atrophy in a non-demented elderly population. An acceleration of hippocampal atrophy may emerge around 72 years of age in a non-demented elderly population.
Conflict of interest
None.
Description of authors’ roles
Yi Zhang analyzed and interpreted the material and data, carried out the statistical analysis and wrote the manuscript. Chengxua Qiu, Laura Fratiglioni, Lars Bäckman, Olof Linberg and Lena Bronge collected the data, designed the study and revised the manuscript. Lars-Olof Wahlund supervised the study and, together with Peter Aspelin, analyzed the data and revised the manuscript.