Introduction
The transition period is the most critical period in the lactation cycle, which is traditionally defined as 3 weeks prepartum to 3 weeks postpartum (Grummer, Reference Grummer1995). This is a period of dramatic physiological and metabolic adaptation for the dairy cow. Basically, most cows experience varying degrees of negative energy balance (NEB) during early lactation (Soviani et al., Reference Soviani, Heuer, Van Straalen and Noordhuizen2000), which is the result of decreased periparturient days in milk (DIM). Increasing periparturient DIM is one of the primary objectives of dairy nutritionists because of the relationship of DIM to NEB (Drackley, Reference Drackley2006). Although the control of postpartum DIM is under metabolic control (Aghaziarati et al., Reference Aghaziarati, Amanlou, Zahmatkesh, Mahjoubi and Hossein Yazdi2011; Allen and Piantoni, Reference Allen and Piantoni2014), the role of other factors such as cow grouping and social hierarchy cannot be ignored (Chebel et al., Reference Chebel, Silva, Endres, Ballou and Luchterhand2016).
Dairy cow grouping is a common and practical method of increasing feed efficiency and provides opportunities for more efficient management in many commercial dairy operations. Dairy farmers may adopt different strategies for cow grouping such as the time to expected calving date, sick cows, fresh cows, pregnant cows and early or late lactating cows (Cabrera and Kalantari, Reference Cabrera and Kalantari2016). Although the fresh cow group is generally the first 21 days, others have defined the fresh period, and by extension time spent in the fresh group from 3 to >30 DIM (Espadamala et al., Reference Espadamala, Pallares, Lago and Silva-Del-Rio2016) and up to 45 DIM (Rossow and Aly, Reference Rossow and Aly2013). In addition, it has been reported that successful dairy farmers monitor fresh cows for 4–14 days depending on the increase in milk yield (Bauer, Reference Bauer2016). This implies that the level of milk production greatly influences the decision to move cows from the fresh group. Furthermore, Allen and VandeHaar (Reference Allen and VandeHaar2016) have suggested three rations as cows progress through the lactation period: a fresh ration (~22–24% forage neutral detergent fibre (NDF) and ~22–26% starch), a high ration (~17–20% forage NDF and ~28–32% starch) and maintenance rations (~24–26% forage NDF and ~18–22% starch). Furthermore, they suggested cows should be changed to the high ration after 10 DIM if they are healthy and eating aggressively. In this regard, they also reported that 95% of fresh cows can be moved to high milking group by 10–14 DIM. After 12 DIM, a greater proportion of the cows in fresh pen are more competitive with new fresh cows (Hutjens and Aalseth, Reference Hutjens and Aalseth2005). Therefore, it appears that keeping fresh cows for more than 12 days with a moderated diet (energy and starch levels between close-up ration and high group ration) may produce greater feed bunk competition with cows of more than 12 DIM pushing cows earlier in lactation from the feed bunk. Much of this competition may be related to greater NEB in cows with more DIM because the typical fresh cow ration has insufficient energy to support the energy demand of increasing milk yield. Although Hernandez-Urdaneta et al. (Reference Hernandez-Urdaneta, Coppock, McDowell, Gianola and Smith1976) showed that cows can be switched from diets of nearly all forage to high concentrate complete feeds (~60% concentrate) 4 days postpartum without adverse reactions, recent data (Stone, Reference Stone2004; Hosseini-Ghaffari et al., Reference Hosseini-Ghaffari, Khafipour and Steele2017) reported that fresh cows are more prone to acidosis when fed high amounts of concentrate. Thus, there is a complicated interaction in terms of how much concentrate should be fed to fresh cows and when fresh cows should move to the high group. To our knowledge, there is no study in which a 10-DIM pen with 21-DIM pen in combination with the different allowable concentrate has been evaluated. We hypothesized that a shorter time kept in fresh pen along with allowable concentrate intake of ~10 kg/day would result in better performance compared with common 21-DIM fresh pen and ~12.5 kg/day allowable concentrate.
Materials and method
Cows, housing and feeding
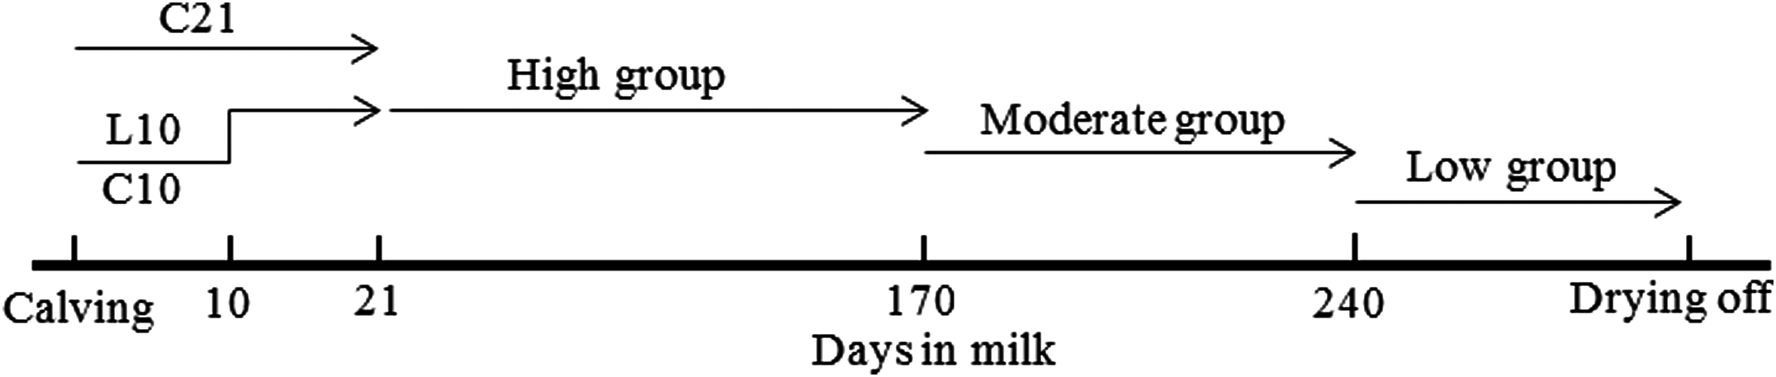
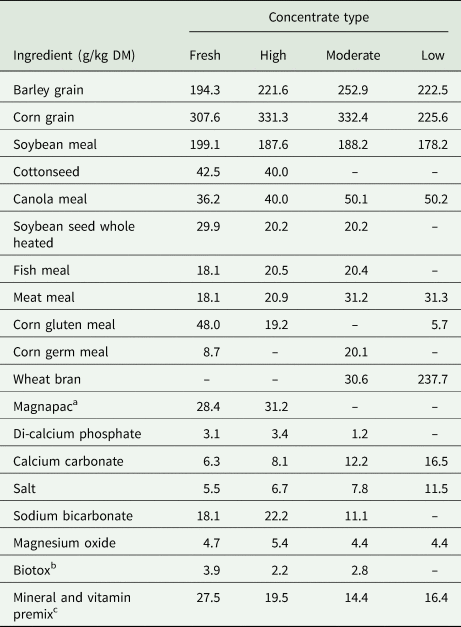
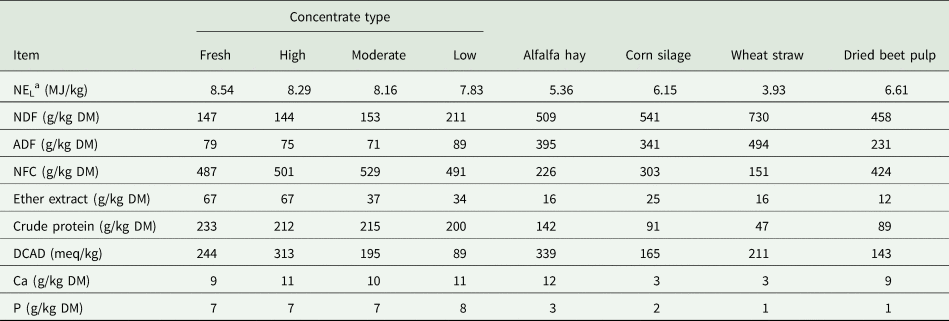
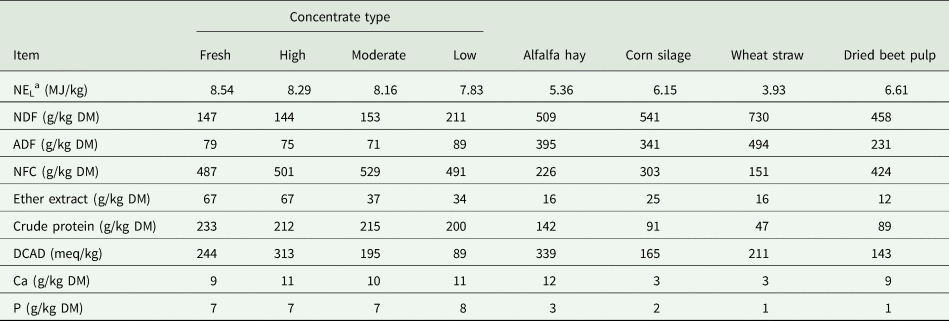
The current study was carried in a commercial dairy farm that had 2800 lactating cows (Magsal, Qazvin, Iran) according to the guidelines of the Iranian Council of Animal Care (1995). This farm is located in a tropical area (longitude 50.31°E and latitude 36.07°N) and reported an average daily milk production of 40.5 kg per head. One day after parturition, 160 healthy multiparous Holstein cows, without any calving-related difficulties, were randomly allocated to the following treatments: 21 days in fresh pen with 12.5 kg/day concentrate (C21, n = 60), 10 days in fresh pen with 12.5 kg/day concentrate (C10, n = 50) and 10 days in fresh pen with 10 kg/day concentrate (L10, n = 50); cows were fed the daily allowance of concentrate plus 3.5 kg alfalfa hay, 11.9 kg corn silage, 2.3 kg beet pulp, 0.3 kg wheat straw. Cows were housed on bedded-pack in the fresh pen, and then were kept in free-stall barns bedded with sand. Cows were group-fed a total mixed ration. Experimental diets and chemical composition are presented in Tables 1 and 2. Feed was offered daily at 06.00 and 15.00 h. Twice a week, samples from total mixed ration (TMR) and diet ingredients were collected and the subsamples were mixed thoroughly by weight, dried in an oven at 105°C for 24 h (method 925.40; AOAC, 1990) to determine dry matter (DM), and ground to pass a 1 mm screen in a mill (Ogaw Seiki CO., Ltd., Tokyo, Japan) before chemical analysis for crude protein (CP) (method 988.05; AOAC, 1990) and lipid (method 920.39; AOAC, 1990). NDF was analysed without using sodium sulphite and α-amylase (Van Soest et al., Reference Van Soest, Robertson and Lewis1991). All cows had free access to fresh water during the experimental period. Cows in each group were moved to a high group and to a low group after that. Briefly, cows were kept in high group until 170 DIM, then in moderate group from 170 to 240 DIM and then in low group from 240 to drying off at 210 days of pregnancy (Fig. 1).
Schematic illustration of how cows were changed from one group to another throughout lactation; 21 days in fresh pen with 12.5 kg concentrate (C21; 3.5 kg alfalfa hay, 11.9 kg corn silage, 2.3 kg beet pulp, 0.3 kg wheat straw), 10 days in fresh pen with 12.5 kg concentrate (C10) and 10 days in fresh pen with 10 kg concentrate (L10). In high group, cows were offered 16.6 kg concentrate, 4.8 kg alfalfa hay, 19.8 kg corn silage, 2.3 kg beet pulp, 0.1 kg wheat straw. In moderate group, cows were offered 13.5 kg concentrate, 5.2 kg alfalfa hay, 19.2 kg corn silage, 2.9 kg beet pulp, 0.2 kg wheat straw. In low group, cows received 7.5 kg concentrate, 5.4 kg alfalfa hay, 15.8 kg corn silage, 3.2 kg beet pulp, 1.4 kg wheat straw. All amounts are as-fed basis.

Ingredients of the experimental concentrate mixture

a Calcium salts of fatty acids distillate from palm oil (Magnapac, NOREL S.A., Suez, Egypt). Analysis: 84%. Fatty acid composition (NOREL S.A. g/kg total fatty acids): C14:0, 1.5%; C16:0, 44%; C18:0, 5%; C18:1, 40%; C18:2, 9.5%.
b B.I.O.Tox® The mycotoxin adsorber (Biochem Zusatzstoffe Handels, Germany).
c Provided (per kg of DM): 500 000 IU of Vitamin A, 100 000 IU of Vitamin D, 1000 mg of Vitamin E, 9000 mg of P, 195 000 mg of Ca, 2000 mg of Mn, 55 000 mg of Na, 2000 mg of Zn, 2000 mg of Fe, 280 mg of Cu, 100 mg of Co, 100 mg of Br, 1 mg of Se, 3000 mg of anti-oxidant.
Measurements
Cows were milked three times daily at 06.00, 14.00 and 22.00 h. Milk yield was recorded daily through the first 28 days; from 29 to 70 DIM, and thereafter monthly until 305 DIM. Milk samples were taken at days 3 through 21, and a composite was formed based on the proportion of daily yield. Milk fat composition was determined using electronic milk analyser (Milk Analyzer-jet2, Dairy scan Co., Bulgaria) according to operating instruction provided by the manufacturer. Cows were scored for body condition using a five-point scale with 0.25 increments to determine BCS changes at 3, 10, 21, 30, 60, 90 and 120 DIM (Wildman et al., Reference Wildman, Jones, Wagner, Boman, Trout and Lesch1982). Two different individuals performed all BCS evaluations independently and the scores were averaged. Blood samples were randomly obtained for 20 cows within each treatment, a total of 60 sampled cows. Care was taken to ensure the same cows were sampled at 14-day intervals for 6 weeks starting 24 h after parturition (d = 0) for determining glucose, beta-hydroxy butyric acid (BHBA), non-esterified fatty acids (NEFA) and blood urea nitrogen (BUN). Blood samples of the same 20 cows per treatment were collected daily from day 10 to 25 postpartum for the determination of plasma progesterone concentrations. Blood samples (10 ml) were collected from coccygeal vessels into anticoagulated (ethylenediamine tetraacetic acid) Vacutainer® tubes, prior to feeding and were kept on ice until processed. All blood samples were centrifuged for 10 min at 2000 × g at 4°C and plasma was harvested and transferred into 2 ml microcentrifuge tubes and kept at −20°C until assayed. Plasma concentrations of glucose (Glucotrend, Roche, England), NEFA (Cat. No. FA 115, Randox Laboratories Ltd., UK), BHBA (Abbott Diabetes Care Ltd. Rang Road. Witney, Oxin, OX29 OYL., UK) were determined enzymatically using a spectrophotometer (Shimadzu 2100, Kyoto, Japan). Intra- and inter-assay coefficients of variation were <5%. Plasma progesterone concentrations were analysed by ELISA following the manufacturer's instructions (DRG, Frauenbergstr, Marburg, Germany). Two professional artificial insemination (AI) technicians performed all inseminations based on oestrus detection following a voluntary waiting period of 50 DIM, using semen from two commercially available sires equally balanced among the experimental groups. Pregnancy diagnosis was performed by ultrasonography (Easi-Scan version 3, BCF Technology Ltd., Livingston, Scotland, UK) 32 days after AI. Pregnancy was defined by the presence of fluid, an embryo and a heartbeat.
Statistical analysis
All statistical analyses were performed with SAS (version 9.4; SAS Institute Inc., Cary, NC, USA). Prior to analysis, all data were evaluated for normality (UNIVARIATE procedure to compute descriptive statistics and perform normality tests). Milk yield and milk fat, blood metabolites and BCS were analysed as repeated measures with cow as the subject using the PROC MIXED procedures of SAS (Littell et al., Reference Littell, Milliken, Stroup, Wolfinger and Schabenberger2006). Time (DIM) was included in the model as a repeated variable. Covariance structures were tested and the most appropriate structure based on the lowest Akaike information criterion, corrected Akaike information criterion and Bayesian information criterion values was used for each analysis. The following model was used: Yij = μ + Groupingi + Timej + (Grouping × Time)ij + Cowk + eijk, where Yij is the dependent variable, μ is the overall mean, Groupingi is the fixed effect of groups, Timej is the fixed effect of time, (Grouping × Time)ij is the fixed effect of diet-by-time interaction, Cowk is the random effect cows nested within treatment and eijk is the residual. Data are reported as least-square means and statistical significances were declared at P ⩽ 0.05 and 0.05 < P < 0.10 as trends towards significance using the Tukey's multiple comparison test. Differences among treatments were assessed using orthogonal contrast statements of effect of time duration in fresh pen (C21 v. C10 and L10) and of concentrate amount for cows 10 days in the fresh pen (C10 v. L10). The POLYANOVA model was considered for production and blood data. Linear and quadratic contrasts were reported from this statistical analysis.
Binomial data (pregnancy at first, second and third service, days open, services per conception and pregnancy loss) were analysed using GLM fitting a binary distribution response.
Results
Milk production and BCS
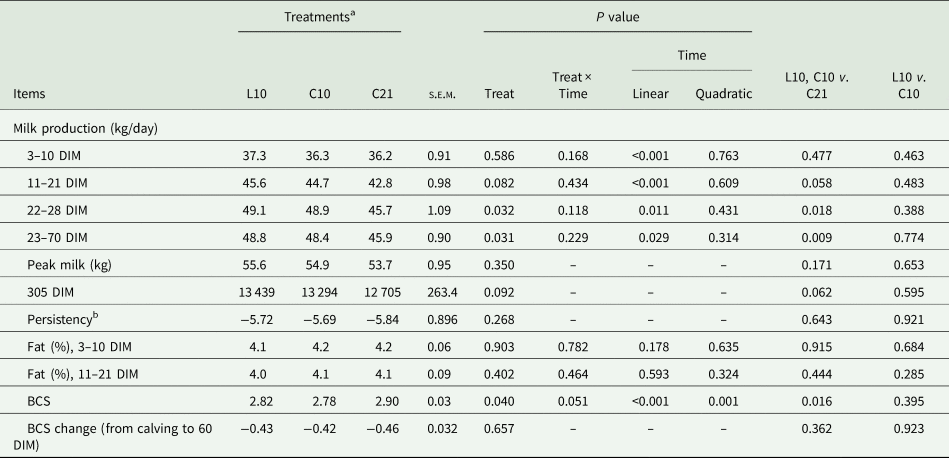
Milk yield data are shown in Table 3. During the first 10 DIM, milk yield was not affected by treatments. However, C10 and L10 cows tended (P = 0.058) to produce more milk than C21 during 11–21 DIM; in addition, greater milk yield (P < 0.032) was obtained in C10 and L10 cows during 22–28 DIM and 29–70 DIM. Although it was numerically greater for C10 group, milk production at peak was not influenced by treatments. Greater milk yield in early lactation resulted in a tendency (P = 0.062) for C10 and L10 cows to produce more milk over the 305 days lactation. In the current study, milk fat content was not influenced by treatments (Table 3). Milk yield was linearly affected by time during the first 70 DIM (P < 0.001). Milk production persistency was similar across treatments thereby all cows in treatments declined monthly milk yield as much as ~5.7%.
Effect of fresh cow grouping strategy on milk production and milk fat content in Holstein dairy cows
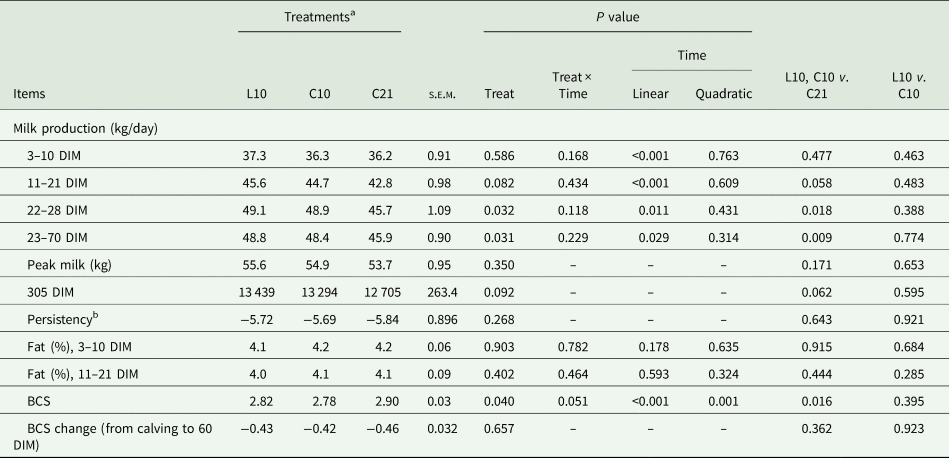
a Treatments: 21 days in fresh pen with 12.5 kg concentrate (C21), 10 days in fresh pen with 12.5 kg concentrate (C10) and 10 days in fresh pen with 10 kg concentrate (L10).
b Persistency is change from previous month.
Without any difference at 10 DIM among treatments, BCS was reduced in C10 and L10 cows compared to C21 cows at 21 DIM (~0.12 unit; P < 0.047) and at 30 DIM (~0.18 unit; P < 0.045); C10 and L10 cows had similar BCS at aforementioned DIM. Nevertheless, BCS was similar across treatments at 60, 90 and 120 DIM. In addition, BCS change from calving to 60 DIM was not affected by treatments.
Blood metabolites
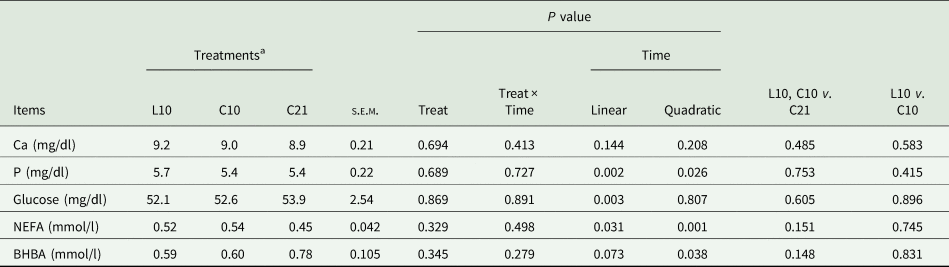
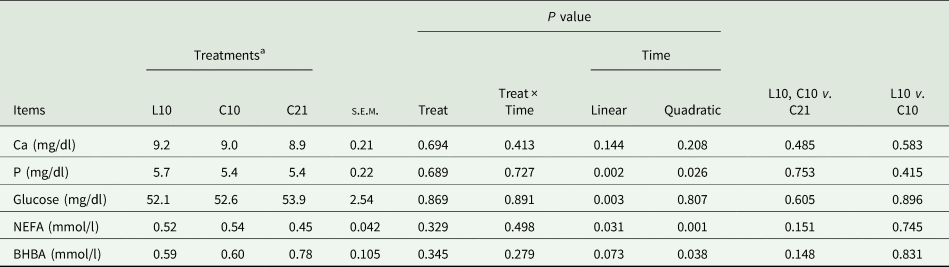
Blood metabolites are shown in Table 4. None of the blood metabolites (Ca, P, NEFA and BHBA) were affected by treatments. Time effect significantly (P < 0.031) influenced NEFA and BHBA (P < 0.073), thereby their concentrations decreased with advance in lactation.
Blood metabolite values for cows subjected to three fresh cow strategies
a Treatments: 21 days in fresh pen with 12.5 kg concentrate (C21), 10 days in fresh pen with 12.5 kg concentrate (C10) and 10 days in fresh pen with 10 kg concentrate (L10).
Reproductive performance
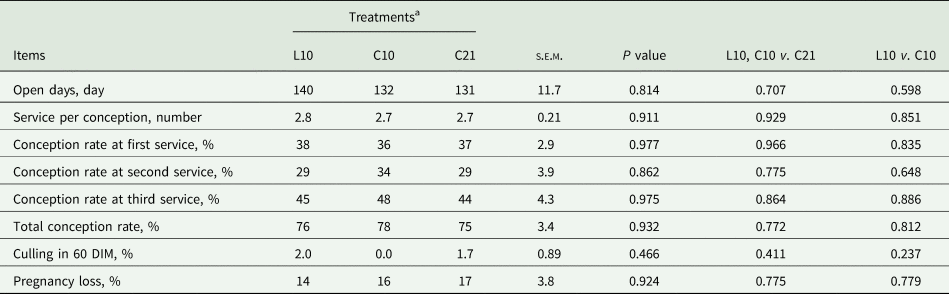
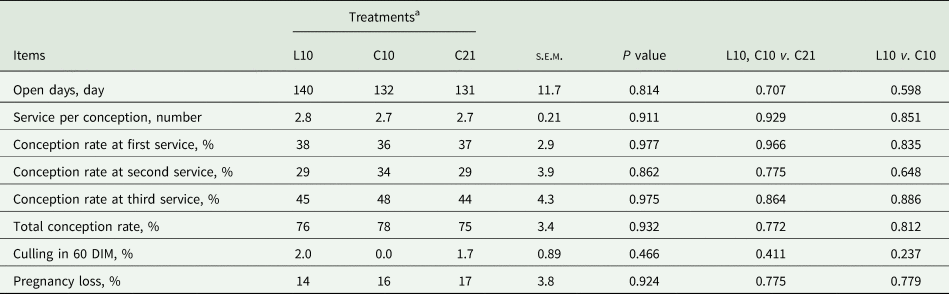
Reproductive-related data are shown in Table 5. Conception rate at first, second and third service did not differ among treatments. Days open, the services per conception and the total number of cows pregnant were also similar for all treatments.
Reproductive performance of cows subjected to three fresh cow strategies
a Treatments: 21 days in fresh pen with 12.5 kg concentrate (C21), 10 days in fresh pen with 12.5 kg concentrate (C10) and 10 days in fresh pen with 10 kg concentrate (L10).
Discussion
Milk production and BCS
To our knowledge, the effect of fresh cows grouping on productivity has not been evaluated yet. Fresh cows are typically kept in a fresh pen from 3 to >30 DIM (Espadamala et al., Reference Espadamala, Pallares, Lago and Silva-Del-Rio2016) or even >45 DIM (Rossow and Aly, Reference Rossow and Aly2013). In contrast, however, it has been shown that successful dairy farmer keep fresh cows for 4–14 days depending on how well they take off in milk yield (Bauer, Reference Bauer2016). Guterbock (Reference Guterbock2004) stated that healthy cows might show a daily increase of up to 4.5 kg of milk, implying typical amounts of fresh cow concentrate might be insufficient for meeting energy requirements during 21 DIM. This suggests that keeping cows for more than 14 days in the fresh pen would result in greater BCS loss. On the other hand, cows with >14 DIM are more competitive compared with cows more recently introduced to the pen, which may exacerbate the condition loss for newly admitted or low-hierarchy cows (Hutjens and Aalseth, Reference Hutjens and Aalseth2005). Therefore, it is logical to postulate that there may be benefits to keeping cows in fresh pen for only 10–12 days.
In line with the current results, Schei et al. (Reference Schei, Voldenb and Bævrea2005) showed that feeding 10 compared to 5 kg/day concentrate to fresh cows did not result in a milk yield increase during the first 3 weeks of lactation, showing that greater concentrate feeding does not guarantee a higher milk yield during this time frame. In addition, fresh cows are more prone to acidosis (Hosseini-Ghaffari et al., Reference Hosseini-Ghaffari, Khafipour and Steele2017) and lower concentrate intake during the first days in lactation may prevent digestive upsets. The current study suggests that lower concentrate allowance (10 v. 12.5 kg/day) would probably create a healthier rumen for housed high-yielding Holstein dairy cows fed TMR.
After 10 DIM, and especially from 10 to 28 DIM, greater milk production in C10 and L10 than in C21 implies that more concentrate (~16.5 kg/day in high group after fresh pen) is needed for more production. Current results demonstrate that more concentrate after 10 DIM probably has no adverse effect on cow performance and may be necessary for higher milk yields. Because of the risk of ruminal acidosis or sub-acute ruminal acidosis due to high concentrate levels in high group, some dairy farmers do not move the cows to the high group earlier than 21 DIM. Our results support those of Hernandez-Urdan et al. (Reference Hernandez-Urdaneta, Coppock, McDowell, Gianola and Smith1976) who showed cows could be switched from a high forage to a high concentrate (~60%) early in lactation, and of Schei et al. (Reference Schei, Voldenb and Bævrea2005) who found that feeding a low level of concentrate did not negatively affect milk production until 3–14 weeks after calving.
The week-4 milk production has been used as a predictor of whole lactation milk yield (Boomer and Kearnan, Reference Boomer and Kearnan2009). Because week-4 milk production was less in C21, it was expected that 305-day milk production would be less. Interestingly, C10 and L10 tended to have greater production than C21 throughout 305 days. Collectively, these results suggest that housing cows in a fresh pen for only 10 days with a lower amount of concentrate and then moving them to high groups can improve milk production for the whole lactation in dairy farms where a TMR is fed to high-yielding Holstein dairy cows.
Milk fat content was not influenced by fresh cow grouping strategy. Schei et al. (Reference Schei, Voldenb and Bævrea2005) found that milk fat was similar between treatments when 10 v. 5 kg/day concentrate was fed for 14 weeks after parturition although milk fat yield declined in cows fed 5 kg/day of concentrate.
Despite the higher BCS in C21 at 10 and 21 DIM, the reduced BCS in C10 and L10 cows at 10 and 21 DIM did not appear to have an effect on productivity or NEB, perhaps because the magnitude of decrease was small. Schei et al. (Reference Schei, Voldenb and Bævrea2005) observed no difference in BCS between treatments which is partly in line with the current results. An increase in milk fat percentage has been a consistent finding when cows are in NEB (DeVries and Veerkamp, Reference DeVries and Veerkamp2000). Given the unchanged milk fat content, it appears that NEB was similar between cows in different treatment groups.
Blood metabolites
None of the blood metabolites were affected by treatments. Calcium and P concentrations were in the recommended range (Jackson and Cockroft, Reference Jackson and Cockroft2008), suggesting that there were no circulating mineral-related problems in these cows. In addition, NEFA and BHBA concentrations were similar among treatments. Both NEFA and BHBA are indicators of NEB in fresh cows. In other words, NEB can be identified by an increase in circulating concentrations of NEFA and BHBA (Ospina et al., Reference Ospina, Nydam, Stokol and Overton2010). In line with the unchanged fat content between treatments, NEFA and BHBA were both less than proposed critical thresholds by Ospina et al. (Reference Ospina, Nydam, Stokol and Overton2010; 0.57 mEq/l and 1.0 mmol/l), implying that grouping strategy had no adverse effect on NEB. Although NEFA concentrations were found to be elevated in cows fed 5 v. 10 kg/day of concentrate in the study of Schei et al. (Reference Schei, Voldenb and Bævrea2005), the magnitude of that increment was small and was also less than proposed critical thresholds (Ospina et al., Reference Ospina, Nydam, Stokol and Overton2010).
Reproductive performance
Cook and Green (Reference Cook and Green2016) showed that the conception by 100 and 150 DIM is positively related to the average produced milk during the fourth week of lactation. Because of greater milk production during 21–28 DIM in C10 and L10 groups, better reproductive performance would be expected. However, and partly in agreement with the current study, Madouasse et al. (Reference Madouasse, Huxley, Browne, Bradley, Dryden and Green2010) illustrated a relationship between lower milk production on the second test day with increased probability of conception before 145 DIM. This implies that there might not be a clear relationship between milk production and reproductive performance. Net energy balance is another important factor which is related to fertility (Leroy et al., Reference Leroy, Opsomer, Van Soom, Goovaerts and Bols2008), and body condition scoring is a way to indirectly evaluate net energy balance. Although BCS decreased slightly for C10 and L10 cows, the magnitude of this decrease did not influence the reproductive performance.
Conclusion
To our knowledge, the effect of fresh cow grouping strategy has not been evaluated previously. Keeping cows for 10 v. 21 days in the fresh cow pen in combination with 10 v. 12.5 kg/day of concentrate have been evaluated in the current study. Results indicated that, under conditions of this experiment, it is advisable to keep multiparous cows in the fresh pen for 10 days rather than 21 days because it has beneficial effects on productivity in the first 70 days and those cows tend to produce more milk throughout the lactation period. Increasing concentrate allowance by 2.5 kg/day in the fresh pen had no effect on milk production. In addition, this grouping strategy did not affect reproductive performance in multiparous cows. In conclusion, it is advisable to keep multiparous cows for 10 days in a fresh pen.
Financial support
This work was supported by the Ministry of Science Research and Technology of Iran which was paid in to the University of Zanjan [Grant number 24407].
Conflict of interest
The authors declare there are no conflicts of interest.
Ethical standards
The experiment was approved by the Ethics Committee on Animal Science at the University of Zanjan (approval no. 24407) and, in compliance with those norms, the animals did not suffer during the experimental procedures.