



%20--%3e%3c!DOCTYPE%20svg%20PUBLIC%20'-//W3C//DTD%20SVG%201.0//EN'%20'http://www.w3.org/TR/2001/REC-SVG-20010904/DTD/svg10.dtd'%3e%3csvg%20version='1.0'%20id='Layer_1'%20xmlns='http://www.w3.org/2000/svg'%20xmlns:xlink='http://www.w3.org/1999/xlink'%20x='0px'%20y='0px'%20width='64px'%20height='64px'%20viewBox='5.5%20-3.5%2064%2064'%20enable-background='new%205.5%20-3.5%2064%2064'%20xml:space='preserve'%3e%3cg%3e%3ccircle%20fill='%23FFFFFF'%20fill-opacity='0'%20cx='37.785'%20cy='28.501'%20r='28.836'/%3e%3cpath%20fill='%23595959'%20d='M37.441-3.5c8.951,0,16.572,3.125,22.857,9.372c3.008,3.009,5.295,6.448,6.857,10.314%20c1.561,3.867,2.344,7.971,2.344,12.314c0,4.381-0.773,8.486-2.314,12.313c-1.543,3.828-3.82,7.21-6.828,10.143%20c-3.123,3.085-6.666,5.448-10.629,7.086c-3.961,1.638-8.057,2.457-12.285,2.457s-8.276-0.808-12.143-2.429%20c-3.866-1.618-7.333-3.961-10.4-7.027c-3.067-3.066-5.4-6.524-7-10.372S5.5,32.767,5.5,28.5c0-4.229,0.809-8.295,2.428-12.2%20c1.619-3.905,3.972-7.4,7.057-10.486C21.08-0.394,28.565-3.5,37.441-3.5z%20M37.557,2.272c-7.314,0-13.467,2.553-18.458,7.657%20c-2.515,2.553-4.448,5.419-5.8,8.6c-1.354,3.181-2.029,6.505-2.029,9.972c0,3.429,0.675,6.734,2.029,9.913%20c1.353,3.183,3.285,6.021,5.8,8.516c2.514,2.496,5.351,4.399,8.515,5.715c3.161,1.314,6.476,1.971,9.943,1.971%20c3.428,0,6.75-0.665,9.973-1.999c3.219-1.335,6.121-3.257,8.713-5.771c4.99-4.876,7.484-10.99,7.484-18.344%20c0-3.543-0.648-6.895-1.943-10.057c-1.293-3.162-3.18-5.98-5.654-8.458C50.984,4.844,44.795,2.272,37.557,2.272z%20M37.156,23.187%20l-4.287,2.229c-0.458-0.951-1.019-1.619-1.685-2c-0.667-0.38-1.286-0.571-1.858-0.571c-2.856,0-4.286,1.885-4.286,5.657%20c0,1.714,0.362,3.084,1.085,4.113c0.724,1.029,1.791,1.544,3.201,1.544c1.867,0,3.181-0.915,3.944-2.743l3.942,2%20c-0.838,1.563-2,2.791-3.486,3.686c-1.484,0.896-3.123,1.343-4.914,1.343c-2.857,0-5.163-0.875-6.915-2.629%20c-1.752-1.752-2.628-4.19-2.628-7.313c0-3.048,0.886-5.466,2.657-7.257c1.771-1.79,4.009-2.686,6.715-2.686%20C32.604,18.558,35.441,20.101,37.156,23.187z%20M55.613,23.187l-4.229,2.229c-0.457-0.951-1.02-1.619-1.686-2%20c-0.668-0.38-1.307-0.571-1.914-0.571c-2.857,0-4.287,1.885-4.287,5.657c0,1.714,0.363,3.084,1.086,4.113%20c0.723,1.029,1.789,1.544,3.201,1.544c1.865,0,3.18-0.915,3.941-2.743l4,2c-0.875,1.563-2.057,2.791-3.541,3.686%20c-1.486,0.896-3.105,1.343-4.857,1.343c-2.896,0-5.209-0.875-6.941-2.629c-1.736-1.752-2.602-4.19-2.602-7.313%20c0-3.048,0.885-5.466,2.658-7.257c1.77-1.79,4.008-2.686,6.713-2.686C51.117,18.558,53.938,20.101,55.613,23.187z'/%3e%3c/g%3e%3c/svg%3e)
%20--%3e%3c!DOCTYPE%20svg%20PUBLIC%20'-//W3C//DTD%20SVG%201.0//EN'%20'http://www.w3.org/TR/2001/REC-SVG-20010904/DTD/svg10.dtd'%3e%3csvg%20version='1.0'%20id='Layer_1'%20xmlns='http://www.w3.org/2000/svg'%20xmlns:xlink='http://www.w3.org/1999/xlink'%20x='0px'%20y='0px'%20width='64px'%20height='64px'%20viewBox='5.5%20-3.5%2064%2064'%20enable-background='new%205.5%20-3.5%2064%2064'%20xml:space='preserve'%3e%3cg%3e%3ccircle%20fill='%23FFFFFF'%20fill-opacity='0'%20cx='37.637'%20cy='28.806'%20r='28.276'/%3e%3cg%3e%3cpath%20fill='%23595959'%20d='M37.443-3.5c8.988,0,16.57,3.085,22.742,9.257C66.393,11.967,69.5,19.548,69.5,28.5c0,8.991-3.049,16.476-9.145,22.456%20C53.879,57.319,46.242,60.5,37.443,60.5c-8.649,0-16.153-3.144-22.514-9.43C8.644,44.784,5.5,37.262,5.5,28.5%20c0-8.761,3.144-16.342,9.429-22.742C21.101-0.415,28.604-3.5,37.443-3.5z%20M37.557,2.272c-7.276,0-13.428,2.553-18.457,7.657%20c-5.22,5.334-7.829,11.525-7.829,18.572c0,7.086,2.59,13.22,7.77,18.398c5.181,5.182,11.352,7.771,18.514,7.771%20c7.123,0,13.334-2.607,18.629-7.828c5.029-4.838,7.543-10.952,7.543-18.343c0-7.276-2.553-13.465-7.656-18.571%20C50.967,4.824,44.795,2.272,37.557,2.272z%20M46.129,20.557v13.085h-3.656v15.542h-9.944V33.643h-3.656V20.557%20c0-0.572,0.2-1.057,0.599-1.457c0.401-0.399,0.887-0.6,1.457-0.6h13.144c0.533,0,1.01,0.2,1.428,0.6%20C45.918,19.5,46.129,19.986,46.129,20.557z%20M33.042,12.329c0-3.008,1.485-4.514,4.458-4.514s4.457,1.504,4.457,4.514%20c0,2.971-1.486,4.457-4.457,4.457S33.042,15.3,33.042,12.329z'/%3e%3c/g%3e%3c/g%3e%3c/svg%3e)
1. Introduction
Understanding the interaction of turbulent flows and sprays is key for the design and development of many engineering applications, for example, aviation gas turbine engine combustors, liquid-fuelled industrial burners, industrial driers and cooling towers; see, e.g. Jenny, Roekaerts & Beishuizen (Reference Jenny, Roekaerts and Beishuizen2012), Sommerfeld & Qiu (Reference Sommerfeld and Qiu1998) and Crowe et al. (Reference Crowe, Schwarzkopf, Sommerfeld and Tsuji2011). Of importance for developing the above understanding is simultaneously measuring the spray droplets position in three-dimensional (3-D) space along with the droplets’ diameter. Despite the importance of the 3-D measurements, the majority of past experimental investigations used techniques for measurements in one-dimensional or two-dimensional (2-D) spaces; see, for example, Allen et al. (Reference Allen, McManus, Sonnenfroh and Paul1995), Kourmatzis, Pham & Masri (Reference Kourmatzis, Pham and Masri2015), Vignat et al. (Reference Vignat, Durox, Renaud, Lancien, Vicquelin and Candel2021) and Skeen, Manin & Pickett (Reference Skeen, Manin and Pickett2015). As such, the experimentally measured location and diameter of the spray droplets in 3-D space is rarely available. The present study is motivated by developing the above knowledge for non-reacting sprays injected in swirling flows, with relevance to gas turbine engine combustors.
The 2-D (planar) measurements of past studies concerning sprays injected in turbulent flows showed that the droplets are not randomly distributed in the measurement plane, and they form clusters, see Manish & Sahu (Reference Manish and Sahu2021). For the 2-D measurements, the characteristics of clusters have been studied for both sprays injected in turbulent flows as well as particle-laden flows, and many review papers have been published; see, for example, Poelma & Ooms (Reference Poelma and Ooms2006) and Balachandar & Eaton (Reference Balachandar and Eaton2010). In past investigations, a laser sheet was employed to illuminate the droplets/particles in a plane and the Mie scattered light from the droplets/particles was collected. Then, the light intensity was used to obtain the location of the droplets/particle centres and these centres were used to identify the Voronoï cells; see, for example, Monchaux, Bourgoin & Cartellier (Reference Monchaux, Bourgoin and Cartellier2010). Then, the probability density function (p.d.f.) of the Voronoï cells area was calculated and compared against the p.d.f. of the Voronoï cells area provided the droplets/particles were randomly distributed in the 2-D space; see Tagawa et al. (Reference Tagawa, Mercado, Prakash, Calzavarini, Sun and Lohse2012), Frankel et al. (Reference Frankel, Pouransari, Coletti and Mani2016) and Boddapati, Manish & Sahu (Reference Boddapati, Manish and Sahu2020). Such comparison showed that there exist two Voronoï cells area below and above which the experimentally obtained p.d.f.s are substantially larger than that of randomly distributed droplets/particles. The cells whose areas are smaller (larger) than the smaller (larger) intersection area were separately merged provided they featured overlapping edges and were referred to as clusters (voids), as detailed in Sumbekova et al. (Reference Sumbekova, Cartellier, Aliseda and Bourgoin2017).
Among many characteristics, the degree of the clustering, the length scale of the clusters and voids, the number densities of the droplets that reside within the clusters and voids, and the joint probability density function (j.p.d.f.) of the diameter of the droplets inside the clusters/voids and the size of the clusters/voids have been studied in past investigations; see, for example, Obligado et al. (Reference Obligado, Teitelbaum, Cartellier, Mininni and Bourgoin2014), Sumbekova et al. (Reference Sumbekova, Cartellier, Aliseda and Bourgoin2017) and Rostami, Li & Kheirkhah (Reference Rostami, Li and Kheirkhah2023). The degree of clustering is defined as  $(\sigma -\sigma _{RPP})/\sigma _{RPP}$, with
 $\sigma$ and
 $\sigma _{RPP}$ being the root mean square (r.m.s.) of the normalized Voronoï cells area estimated from the measurements and from synthetically distributed droplets/particles following a random Poison process (RPP), respectively. The studies of Monchaux et al. (Reference Monchaux, Bourgoin and Cartellier2010), Obligado et al. (Reference Obligado, Teitelbaum, Cartellier, Mininni and Bourgoin2014) and Sumbekova et al. (Reference Sumbekova, Cartellier, Aliseda and Bourgoin2017) showed that the degree of clustering can be primarily influenced by three non-dimensional parameters: the Stokes number (
 $St$) estimated based on the Kolmogorov time scale, the Taylor-length-scale-based Reynolds number (
 $Re_\lambda$) and the volume fraction of the droplets (
 $\phi _{v}$). Specifically, Sumbekova et al. (Reference Sumbekova, Cartellier, Aliseda and Bourgoin2017) showed that in turbulent particle-laden flows with relatively large values of the Taylor-length-scale-based Reynolds number (
 $Re_\lambda \gtrsim 200$), though the Stokes number did not substantially influence the degree of clustering, this parameter followed a power-law relation with
 $Re_\lambda$ and
 $\phi _{v}$. The exponents of the power-law relation between the degree of clustering and
 $Re_\lambda$ and
 $\phi _{v}$ were 1 and 0.5, respectively, as reported in Sumbekova et al. (Reference Sumbekova, Cartellier, Aliseda and Bourgoin2017). Compared with flows with relatively large
 $Re_\lambda$, for moderately turbulent particle-laden flows (
 $Re_\lambda \lesssim 200$), the studies of Monchaux et al. (Reference Monchaux, Bourgoin and Cartellier2010) and Obligado et al. (Reference Obligado, Teitelbaum, Cartellier, Mininni and Bourgoin2014) showed that the degree of clustering featured a peak near
 $St\approx 2\unicode{x2013}4$ for
 $St\lesssim 10$. Motivated by understanding the clustering characteristics at Stokes numbers that are closer to those of gas turbine engine combustors, Rostami et al. (Reference Rostami, Li and Kheirkhah2023) studied sprays injected in turbulent co-flows. In Rostami et al. (Reference Rostami, Li and Kheirkhah2023), it was shown that the degree of clustering plateaus at about 0.3 for flows with Stokes numbers as large as about 25.
The cluster ( $L_{c}$) and void (
 $L_{v}$) length scales were defined as the square root of the corresponding areas in Aliseda et al. (Reference Aliseda, Cartellier, Hainaux and Lasheras2002). The studies of Sumbekova et al. (Reference Sumbekova, Cartellier, Aliseda and Bourgoin2017) showed that both of these length scales were influenced by
 $Re_\lambda$ and
 $St$. Generally,
 $L_{c}$ was about one to two orders of magnitude larger than the Kolmogorov length scale and increasing both the Stokes number and Taylor-length-scale-based Reynolds number increased the cluster length scale normalized by the Kolmogorov length scale. The study of Rostami et al. (Reference Rostami, Li and Kheirkhah2023) showed that
 $L_{v}$ was of the order of the integral length scale (
 $\varLambda$), and
 $L_{v}/\varLambda$ did not change significantly by varying
 $Re_\lambda$ or
 $St$.
The joint characteristics of droplets and clusters/voids for sprays injected in turbulent co-flows were studied in the authors’ previous work (Rostami et al. Reference Rostami, Li and Kheirkhah2023). It was shown that, for  $St \lesssim 10$, increasing this parameter reduced the number density of the droplets that reside within both clusters and voids. However, for
 $10 \lesssim St \lesssim 25$, the number density of the droplets inside the clusters and voids were about 0.45 and 0.06 mm
 $^{-2}$, respectively. For all background turbulent flow conditions tested in Rostami et al. (Reference Rostami, Li and Kheirkhah2023), the number densities of droplets that resided inside the clusters and voids were about 5.5 and 0.8 times the global number density, respectively. Though trends from the j.p.d.f. of the diameter of the droplets that resided within the voids and voids normalized area could not be obtained in Rostami et al. (Reference Rostami, Li and Kheirkhah2023), conclusions were drawn from the j.p.d.f. of the droplet diameter within the cluster and the cluster normalized area. It was concluded in Rostami et al. (Reference Rostami, Li and Kheirkhah2023) that the majority of the droplets reside within clusters with areas smaller than the average cluster area, and a wide range of clusters accommodate droplets with the most probable diameter.
As demonstrated in Rostami et al. (Reference Rostami, Li and Kheirkhah2023), key to understanding the joint characteristics of sprays and clusters is the acquisition of the Mie scattered light of the droplets along with the interference pattern as a result of the reflected and refracted light from the droplets. In Rostami et al. (Reference Rostami, Li and Kheirkhah2023), the interference patterns were acquired using the interferometric laser imaging for droplet sizing (ILIDS) technique, similar to the studies of, for example, Maeda, Akasaka & Kawaguchi (Reference Maeda, Akasaka and Kawaguchi2002), Zama, Kawahashi & Hirahara (Reference Zama, Kawahashi and Hirahara2005), Hardalupas et al. (Reference Hardalupas, Sahu, Taylor and Zarogoulidis2010), Qieni et al. (Reference Qieni, Kan, Baozhen and Xiang2016) and Boddapati et al. (Reference Boddapati, Manish and Sahu2020). Though Rostami et al. (Reference Rostami, Li and Kheirkhah2023) showed that the combination of ILIDS (facilitated via out-of-focus Mie scattering images) and the focused Mie scattering images is enabling, as this combination allows for understanding the joint characteristics of sprays in two dimensions, the simultaneous information regarding the droplets diameter and their position in 3-D space could not be obtained. In fact, the results of past direct numerical simulations (DNS) for particles interacting with turbulence in a box (see, for example, Monchaux Reference Monchaux2012 and Onishi & Vassilicos Reference Onishi and Vassilicos2014) suggested that the clustering characteristics obtained from the 2-D data were different than those obtained from the 3-D data. Specifically, Onishi & Vassilicos (Reference Onishi and Vassilicos2014) used the radial distribution function (RDF) to analyse the particle clustering. They showed that the RDF (obtained using the 3-D DNS data) depends on the Reynolds number that is due to the internal intermittency of turbulence in three dimensions. However, this was not observed in their 2-D simulations. Monchaux (Reference Monchaux2012) studied how the projection of the 3-D location of particles in 2-D planes results in bias in clustering analysis of the particles. They concluded this bias is not significant when the thickness of the volume containing the particles is less than six times the Kolmogorov length scale. Aiming to measure the diameter of the droplets in 3-D space, Shen, Coetmellec & Brunel (Reference Shen, Coetmellec and Brunel2012) and Ouldarbi et al. (Reference Ouldarbi, Pérret, Lemaitre, Porcheron, Coëtmellec, Gréhan, Lebrun and Brunel2015) made improvements to the ILIDS hardware, with the improved version of the ILIDS technique referred to as astigmatic interferometric particle imaging (AIPI); see Wen et al. (Reference Wen, Wu, Zhuo and Wu2021) and Wu et al. (Reference Wu, Wen, Zhuo, Wang and Wu2022).
The above background allows for identifying two gaps in the literature. First, though past investigations that studied the clustering characteristics are of significant importance, the largest tested Stokes number (ratio of the droplet to flow time scales) was about 25, which is at least several folds smaller than those relevant to some engineering applications. For example, the r.m.s. of velocity fluctuations, the integral length scale, the spray most probable diameter, pressure and air temperature can be of the order of  $10\,\mathrm {m}\,\mathrm {s}^{-1}$, 10 cm, 10–100
 $\mathrm {\mu }{\rm m}$ (see Reeves & Lefebvre Reference Reeves and Lefebvre1986), 10 atm and 1500 K, which yield a maximum Stokes number larger than 100. Second, although the AIPI technique has been recently developed and allows for obtaining both the 3-D position and the diameter of the droplets, no investigation has implemented this technique to characterize the clustering of the droplets in turbulent flows. The objective of the present study is to develop our knowledge concerning the joint characteristics of spray droplet diameter and clusters using 3-D measurements and for relatively large Stokes numbers.
2. Experimental methodology
The details of the experimental set-up, diagnostics, coordinate systems and test conditions are presented in this section.
2.1. Experimental set-up
The experimental set-up included air and water delivery systems as well as a flow apparatus. The air delivery system included an Atlas Copco compressor (model GA37FF) and the air flow rate was measured using an MCRH 5000 ALICAT mass flow controller. The water delivery system included a nitrogen bottle to purge water from a pressurized tank as well as a PCD-100-PSIG dual valve pressure controller from ALICAT. For all test conditions, the reservoir pressure was fixed at 62.1 kPa gauge. The liquid flow rate was calibrated following the procedure detailed in Rostami et al. (Reference Rostami, Li and Kheirkhah2023). It was measured that the above reservoir pressure corresponded to an injection of 13.8 grams of water per minute (cf. 21.9 grams per minute in Rostami et al. Reference Rostami, Li and Kheirkhah2023). The reduced flow rate of water in the present study was necessary to produce a dilute spray, which was required for 3-D measurements. Both the air and water delivery systems were identical to those used in our earlier study (Rostami et al. Reference Rostami, Li and Kheirkhah2023).
The flow apparatus included a diffuser section, a settling chamber and a nozzle, which are shown in figure 1. The area ratio of the diffuser was about four, and the settling chamber was equipped with five equally spaced mesh screens, identical to Kheirkhah & Gülder (Reference Kheirkhah and Gülder2013), Kheirkhah (Reference Kheirkhah2016), Mohammadnejad, Saca & Kheirkhah (Reference Mohammadnejad, Saca and Kheirkhah2022) and Rostami et al. (Reference Rostami, Li and Kheirkhah2023). Compared with these studies, the nozzle section was different and was similar to Krebbers et al. (Reference Krebbers, Mohammadnejad, Rostami and Kheirkhah2023). Specifically, the nozzle section included a Delavan pressure swirl atomizer (model S0075-60S1) and a swirler, with details shown in the inset of figure 1. The utilized pressure swirl atomizer is similar to that used in Rostami et al. (Reference Rostami, Li and Kheirkhah2023). It should be highlighted that in our previous study, the background turbulent flow characteristics were adjusted using perforated plates. However, in the present study, a radial swirler generated the background turbulent flow. In past studies, e.g. Wang, Bauer & Gülder (Reference Wang, Bauer and Gülder2019), the combination of the nozzle and a combustion chamber was referred to as the gas turbine model combustor. Compared with Krebbers et al. (Reference Krebbers, Mohammadnejad, Rostami and Kheirkhah2023) and Wang et al. (Reference Wang, Bauer and Gülder2019), improving the quality of our measurements and accommodating a relatively large field of view (FOV), the combustion chamber was removed. Also compared with these past studies, water (instead of Jet A-1) was the working fluid and the flow was non-reacting in the present study.
The flow apparatus, which is composed of a diffuser section, a settling chamber and a nozzle. The inset on the right-hand side is the technical drawing of the nozzle cross-section as well as a picture of the atomizer tip.

2.2. Diagnostics
Three diagnostics, namely, AIPI, stereoscopic particle image velocimetry (SPIV) and shadowgraphy were separately used in the present study. The schematic arrangement of these diagnostics are presented in figure 2(a–c), respectively. The dimensions in the figure are not to scale. The details of the utilized diagnostics are discussed in the following.
The utilized diagnostics. Panels (a–c) are the schematic arrangement of AIPI, SPIV and shadowgraphy technique, respectively. The dimensions are not to scale.

2.2.1. Astigmatic interferometric particle imaging
The AIPI technique was used for the simultaneous measurement of the 3-D location of the spray droplets and their corresponding diameter. The hardware of the AIPI technique consisted of an Nd:YAG dual cavity pulsed laser (model: Evergreen PIV 200), volume illumination optics, an Andor's Zyla 5.5 sCMOS camera (C1) and collection optics for C1. The laser produced a 532 nm laser beam, with a beam diameter of about 5 mm. The energy of the laser was measured using a pyroelectric energy detector from Gentec Electro-Optics Inc. (model: QE25LP-S-MB-QED-INT-D0), with the maximum energy of the laser being about 200 mJ per pulse. For all experiments, the laser was operated at 45 % of its maximum energy to avoid saturation of the AIPI images. The laser beam was converted into a laser slab using the volume illumination optics (see the blue dashed box in figure 2a). The volume illumination optics included the LaVision divergent sheet optics, which were two spherical lenses (SL1 and SL2), a cylindrical lens (CL1) with a focal length ( $\,f$) of
 $-20$ mm, and a spherical lens (SL3 from Thorlabs, model LA1145-AB-ML) with
 $f = 75$ mm. It is important to note that the combination of SL1, SL2 and CL1 allowed for generating a rectangular laser slab, with a maximum thickness of about 10 mm. However, such thickness was not sufficient for the purposes of the volumetric illumination of the spray in the present study, and as such, SL3 was additionally installed. This last spherical lens allowed for increasing the thickness of the illuminated volume from about 10 to 60 mm near the nozzle centreline, which was 1060 mm distant from the centreline of SL3. For presentation purposes, this distance is shortened in figure 2(a). The collection optics included a
 $532\pm 10\,{\rm nm}$ bandpass filter (BF1), a Macro Sigma objective lens (OL1, with
 $f = 105$ mm) and a cylindrical lens (CL2, with
 $f = 250$ mm). The integration of CL2 with OL1 results in the formation of two focal planes P1 and P2 (see figure 2), with P1 being outside of the illumination volume. These two focal planes are formed since the angles of the light refraction along the power and axis meridians of the cylindrical lens are different. The focal length of CL2 is identical to that used in past studies; see, for example, Shen et al. (Reference Shen, Coetmellec and Brunel2012), Wen et al. (Reference Wen, Wu, Zhuo and Wu2021) and Wu et al. (Reference Wu, Wen, Zhuo, Wang and Wu2022). Using the ray transfer matrix method presented in Zhuo et al. (Reference Zhuo, Wu, Wen, Lin and Wu2022), it was confirmed that the selected focal length of CL2 allows for resolving droplets in the entire measurement volume with sufficient sensitivity. The CL2 lens was installed on a rotary mount (model CLR1 from Thorlabs) that allowed us to rotate CL2 with respect to the axis of the collection optics; see figure 2(a). The CL2 lens was positioned between the camera sensor and OL1 to create an astigmatic effect, similar to the studies of Wen et al. (Reference Wen, Wu, Zhuo and Wu2021). The axis of the collection optics was positioned such that it made an angle of
 $\theta = 70^{\circ }$ with the laser beam axis; see the angle between the dotted-dashed lines in figure 2(a). This angle was selected as it yielded the best clarity of interferometric images, following Sahu (Reference Sahu2011). For each test condition (discussed later), 2000 AIPI images were acquired with the acquisition frequency of 10 Hz.
A Cartesian coordinate system was used to locate the AIPI region of interest. This coordinate system is shown by  $x$,
 $y$ and
 $z$ axes in figure 3. The origin of this coordinate system coincides with the intersection of the spray injector centreline (
 $\kern0.7pt y$-axis) and the exit plane of the nozzle. The
 $z$-axis coincides with the axis of the collection optics and points towards the camera sensor. The
 $x$-axis is perpendicular to both
 $y$ and
 $z$ axes. The AIPI region of interest is shown by the transparent green box in figure 3. This region extends from
 $-$42.5 to
 $-$7.5, 43.2 to 71.2 and
 $-$30.0 to 30.0 mm, along the
 $x$,
 $y$ and
 $z$ axes, respectively. Thus, the AIPI volume of interest (
 $V_{AIPI}$) is
 $35\times 28\times 60=58\,800\,\mathrm {mm}^3$. It should be noted that the AIPI region of interest is intentionally selected to be near a sufficiently dilute region of the spray. This was necessary to ensure the accuracy of the 3-D spray measurements by AIPI, with details discussed in § 3.1.
The green box, blue slab and red slab present the AIPI, SPIV and shadowgraphy regions of interest, respectively.  $(x,y,z)$ is the coordinate system used for the AIPI and
 $(x',y,z')$ is that used for the SPIV and the shadowgraphy techniques. The axes in the figure match those in figure 2.

2.2.2. Stereoscopic particle image velocimetry
The SPIV experiments were performed to characterize the background turbulent swirling air flow. The SPIV hardware included a laser (identical to that of the AIPI technique), optics to generate a laser sheet, a programmable timing unit (model PTU X from Lavision) and two Imager CX5 sCMOS cameras (see C2 and C3 in figure 2b) that were equipped with collection optics. The collection optics included two Scheimpflug adapters, SAMYANG lenses with  $f = 85$ mm (see OL2 and OL3 in figure 2b) and two
 $532\pm 10\,{\rm nm}$ bandpass filters (see BF2 and BF3 in figure 2b). The SPIV cameras were placed in the backward–forward scattering configuration, and the angle between the viewing direction of the cameras (the angle between two black dashed lines in figure 2b) was set to
 $21^{\circ }$. For each SPIV experiment, 1200 image pairs were acquired at an acquisition frequency of 10 Hz.
The SPIV experiments were performed while no spray was injected into the air flow. A flow seeder (model PB110 from LaVision) was used to add Aerosil particles into the air flow. The most probable single-particle diameter of the Aerosil
 particles was about 12 nm, which was provided by the producer. The flow seeder used a magnetic stirrer to avoid agglomeration of the particles. Using the formulation provided in Jacobs (Reference Jacobs2007), the Stokes number of agglomerated seed particles of
 $1\,\mathrm {\mu }{\rm m}$ was less than 0.008, rendering the utilized seed particles acceptable for the SPIV measurements.
The FOV of the SPIV experiments is shown in figure 3, using the blue colour. The direction of the laser beam for the SPIV experiments was identical to that of the AIPI (along negative  $x'$) as shown in figure 2(a,b). As a result, the FOV of the SPIV is tilted by
 $90^{\circ }-\theta$, which is
 $20^{\circ }$ with respect to the
 $x$–
 $y$ plane. For the SPIV experiments, a Cartesian coordinate system was used, which is shown by
 $x'$,
 $y$ and
 $z'$ axes in figure 3. It is important to note that the swirling flow is axisymmetric, and as such, the velocity statistics are similar in all azimuthal planes that coincide with the
 $y$-axis. The extent of the SPIV FOV varied from
 $-38.4$ to 38.4 and 10.0 to 78.7 mm along the
 $x'$ and
 $y$ axes, respectively. The above FOV corresponds to a pixel resolution of
 $76.8\,\mathrm {mm}/2240\,\mathrm {pixels}=34.3\,\mathrm {\mu }\mathrm {m}\,\mathrm {pixel}^{-1}$. The LaVision DaVis 10.2.1 software was used to calculate the velocity fields from the Mie scattering images of the seed particles. In the calculations, a spatial cross-correlation algorithm was used to initially calculate the velocity vectors for
 $128\times 128\,\mathrm {pixels}^{2}$ interrogation windows. This was reduced to a final interrogation window size of
 $32\times 32\,\mathrm {pixels}^{2}$ with an overlap of
 $50\,\%$ between the windows. The time separation between the two laser pulses was varied for each experiment and was calculated by dividing 25 % of the final interrogation window size and the mean bulk flow velocity. The above time separation varied from 8.2 to 77.0
 $\mathrm {\mu }$s, depending on the test condition.
2.2.3. Shadowgraphy
The shadowgraphy technique was used to understand the effects of the swirling flow on the spray formation and large droplets breakup. The shadowgraphy hardware included a backlight LED lamp (model NL-360ARC from Neewer) and a Photron Fastcam Nova S12 high-speed camera (C4 in figure 2c) equipped with a Macro Sigma lens, with  $f = 105$ mm and its aperture size was set to
 $f/2.8$. The shadowgraphy images were captured for a duration of 1 s with the acquisition frequency of 10 kHz. The camera exposure time was set to
 $20\,\mathrm {\mu }$s. The FOV of the shadowgraphy imaging was 64 mm along the
 $x'$-axis and 64 mm along the
 $y$-axis. The depth of field (DOF) for the shadowgraphy camera was calculated using the formulation from Gross, Blechinger & Achtner (Reference Gross, Blechinger and Achtner2008), which is given by
 \begin{equation} {DOF} = \frac{2of^2N\tilde{c}(o-f)}{f^4 - \tilde{c}^2N^2(o-f)^2}, \end{equation}
where  $\tilde {c}$ is the camera sensor size,
 $N$ is the aperture number and
 $o$ is the distance between the camera sensor and the plane of focus. In the present study,
 $\tilde {c}$ and
 $o$ were
 $20\,\mathrm {\mu }{\rm m}$ and 500 mm, respectively. Substituting the above values in (2.1), the DOF was calculated and was about 2 mm. The shadowgraphy FOV is shown by the red slab in figure 3.
2.3. Test conditions
In total, eight test conditions were examined with details presented in table 1. For all test conditions, the liquid flow rate was kept constant. The mean bulk flow velocity of the air flow ( $U_{b}$) was estimated by dividing the set air flow rate to the exit area of the nozzle section, which is the area of a circle with diameter
 $D=28.0\,\mathrm {mm}$, subtracted by the surface area of the Delavan injector at its exit; see the inset of figure 1. In the present study,
 $U_{b}$ was varied from 6.1 to
 $27.4\,\mathrm {m}\,\mathrm {s}^{-1}$, with the corresponding values tabulated in the first column of table 1. It is important to note that, for
 $U_{b} < 6.1\,\mathrm {m}\,\mathrm {s}^{-1}$, the spray was too dense and the AIPI was not performed for these velocities. However, qualitative analysis of the spray was possible using the shadowgraphy technique, and as a result, in addition to the mean bulk flow velocities presented in table 1, shadowgraphy experiments were performed for
 $U_{b}= 0\,\mathrm {m}\,\mathrm {s}^{-1}$ (which corresponds to no background air flow). The Reynolds number estimated based on the mean bulk flow velocity was calculated using
 $Re_D=U_{b}D/\nu$, with
 $\nu$ being the kinematic viscosity of the air at the laboratory temperature. The values of
 $Re_D$ are tabulated in the second column of table 1.
Test conditions.

The background turbulent flow characteristics were estimated at the intersection of the SPIV FOV and the AIPI region of interest. This intersection region extends from  $-$39.9 to
 $-$7.0 and 43.2 to 71.2 mm, along the
 $x'$ and
 $y$ axes, respectively. The r.m.s. of the streamwise (along the
 $y$-axis) velocity fluctuations was averaged inside the above region, referred to as
 $\tilde {u}_{rms}$, and listed in the third column of table 1. The integral length scale was calculated using the autocorrelation of the streamwise velocity fluctuations, following the formulations presented in Kheirkhah & Gülder (Reference Kheirkhah and Gülder2015) and Kheirkhah (Reference Kheirkhah2016). Similar to these studies, the calculation of the integral length scale at spatial locations corresponding to
 $y \gtrsim 60.0$ mm was not possible since the autocorrelation of the velocity data did not attain a zero value. As such, the integral length scale was calculated in the intersection region of SPIV and AIPI and for
 $43.2\,\mathrm {mm} \lesssim y \lesssim 60.0\,\mathrm {mm}$. The values of
 $\varLambda$ are listed in the fourth column of table 1. The Taylor (
 $\lambda$) and Kolmogorov (
 $\eta$) length scales were calculated using
 $\lambda = \varLambda (\tilde {u}_{rms} \varLambda /\nu )^{-0.5}$ and
 $\eta = \varLambda (\tilde {u}_{rms} \varLambda /\nu )^{-0.75}$. It should be noted that, in the formulations used for the estimation of
 $\lambda$ and
 $\eta$, it is inherently assumed that the normalized dissipation rate of the turbulent kinetic energy is unity. It is acknowledged this is not necessarily a fixed parameter (see, for example, Vassilicos Reference Vassilicos2015) and can feature dependence on the type of turbulence generator, where it is measured, and
 $Re_\lambda$; see Burattini, Lavoie & Antonia (Reference Burattini, Lavoie and Antonia2005). In the present study, similar to past investigations that studied the droplet-laden flows (see, for example, Sumbekova et al. Reference Sumbekova, Cartellier, Aliseda and Bourgoin2017), the normalized dissipation rate of the turbulent kinetic energy was taken as unity. The values of
 $\lambda$ and
 $\eta$ are presented in the fifth and sixth columns of table 1, respectively. For all test conditions,
 $\tilde {u}_{rms}$ varied from about 1.0 to
 $4.4\,\mathrm {m}\,\mathrm {s}^{-1}$, while the integral length scale was nearly constant (
 $\varLambda = 7.6-7.8\,\mathrm {mm}$). The Taylor and Kolmogorov length scales varied from about 160 to
 $347\,\mathrm {\mu }{\rm m}$ and from 23 to
 $73\,\mathrm {\mu }{\rm m}$, respectively.
The formulation provided in Lefebvre & McDonell (Reference Lefebvre and McDonell2017) and the AIPI data were used to estimate the Sauter mean diameter (SMD) of the spray droplets. The values of the SMD are listed in the seventh column of the table. The AIPI data was also used to estimate the mean droplet diameter ( $\bar {d}$), which is listed in the eighth column of the table. For the conditions tested in the present study, SMD and
 $\bar {d}$ varied from 67 to
 $95\,\mathrm {\mu }{\rm m}$ and 37 to
 $57\,\mathrm {\mu }{\rm m}$, respectively. It should be noted that, since the calculation of the SMD involves the volume-to-surface area ratio of the droplets, it is anticipated that the SMD be skewed toward the diameter of large droplets, resulting in the larger values of the SMD compared with
 $\bar {d}$. In summary, comparison of the results presented in the sixth to eighth columns of table 1 shows that the size of the spray droplets are of the order of the Kolmogorov length scale tested in the present investigation. It is noted that given the differences in the water flow rate and the background turbulence between the present study and those of our previous investigation (see Rostami et al. Reference Rostami, Li and Kheirkhah2023), the mean diameter of the droplets in this study are larger than those in Rostami et al. (Reference Rostami, Li and Kheirkhah2023), which varied from 30 to
 $38\,\mathrm {\mu }{\rm m}$.
Of prime importance in studying the particle-laden flows are the Taylor-length-scale-based Reynolds number, Stokes number and the spray volume fraction ( $\phi _{v}$). The Taylor-length-scale-based Reynolds number was estimated using
 $Re_\lambda = \tilde {u}_{rms} \lambda /\nu$, with the corresponding values listed in the ninth column of table 1. In the present study,
 $Re_\lambda$ varies from about 22 to 47, which are relatively moderate values compared with past particle-laden flow studies; see, for example, Sumbekova et al. (Reference Sumbekova, Cartellier, Aliseda and Bourgoin2017). Following Reade & Collins (Reference Reade and Collins2000), the Stokes number was calculated using
 \begin{equation} St=\frac{1}{18}\frac{\rho_{W}}{\rho_{A}}\left(\frac{d}{\eta}\right)^{2}, \end{equation}
where  $\rho _{W}$ and
 $\rho _{A}$ are the water and air densities both estimated at the laboratory temperature (
 $21\,^{\circ }{\rm C}$) and pressure (1 atm). In (2.2),
 $d$ is a characteristic size for the droplet diameter. In the present study, the mean droplet diameter was used for the estimation of the Stokes number. The values of the Stokes number are tabulated in the tenth column of table 1 and vary from about 34 to 142, which are relatively large compared with those tested in the literature. It is important to note that in the present study, the mean droplet diameter is larger than the Kolmogorov length scale, and following the studies of Xu & Bodenschatz (Reference Xu and Bodenschatz2008) and Monchaux, Bourgoin & Cartellier (Reference Monchaux, Bourgoin and Cartellier2012), the Kolmogorov time scale may not be appropriate for calculating the Stokes number. Specifically, the above studies suggested using the droplet diameter instead of the Kolmogorov length scale for calculating the Stokes number. Using the formulation proposed in Xu & Bodenschatz (Reference Xu and Bodenschatz2008) and Monchaux et al. (Reference Monchaux, Bourgoin and Cartellier2012) led to the Stokes number varying from about 40 to 104. Either of the calculations discussed above leads to values of the Stokes number that are substantially larger than those examined in previous studies. Nonetheless, using either of the definitions of the Stokes number yields similar conclusions. In the present study, (2.2) was used for estimation of the Stokes number, facilitating comparisons with the results of Rostami et al. (Reference Rostami, Li and Kheirkhah2023).
The spray volume fraction was estimated using the formulation in Elghobashi (Reference Elghobashi1994), which is given by
 \begin{equation} \phi_{v} = \bar{n}\frac{V_{d}}{V_{AIPI}}, \end{equation}
where  $\bar {n}$ is the mean number of droplets within the volume of the AIPI region of interest (see the green box in figure 3) and
 $V_{d}$ is the volume occupied by an individual droplet. For each test condition, the number of droplets,
 $n$, was calculated using the AIPI technique and was averaged over all collected images. The volume occupied by a droplet was approximated by
 $V_{d} = ({\rm \pi} /6) \bar {d}^{3}$. The values of
 $\phi _{v}$ are listed in the eleventh column of table 1. In the present study, the spray volume fraction varied from
 $0.35\times 10^{-6}$ to
 $0.74\times 10^{-6}$, rendering the tested sprays dilute, as suggested in Elghobashi (Reference Elghobashi1994).
3. Data reduction
The procedure for reducing the raw AIPI data into the 3-D position and diameter of spray droplets are presented in the first subsection. Then, in the second subsection, the procedure for identifying the 3-D clusters and voids are discussed.
3.1. Three-dimensional positioning and sizing of droplets
A cropped view of a representative image from AIPI is shown in figure 4(a) that corresponds to the test condition with  $U_{b}=15.2\,\mathrm {m}\,\mathrm {s}^{-1}$. As can bee seen, the interferometric images of the droplets are oriented elliptical regions that feature slanted fringes. Similar to the present study, such elliptical interferometric images of droplets are reported in previous investigations; see, for example, Shen, Coetmellec & Brunel (Reference Shen, Coetmellec and Brunel2013) and Wen et al. (Reference Wen, Wu, Zhuo and Wu2021). A sample region is highlighted by the box in figure 4(a) and is enlarged and shown in figure 4(b). The Canny edge detection algorithm in MATLAB
 was used to obtain the boundary of the elliptical regions, with a sample ellipse shown in figure 4(b). The centres of the elliptical regions were obtained fitting an ellipse to the detected elliptical regions using the least square method, and then finding the centres of the fitted ellipses. It is important to note that a discrepancy exists between the true
 $x$ and
 $y$ coordinates of the droplets and the centre of the ellipses. This discrepancy was obtained and corrected, with the correction procedure presented in Appendix A.
Panel (a) is a cropped AIPI raw image. Panel (b) is a sample interference pattern from (a). Panel (c) is the inset of (b) corresponding to the red rectangle in (b). Panel (d) is the 2-D fast Fourier transform magnitude for the interference pattern shown in (c). Overlaid on (d) are the  $x''$ and
 $y''$ axes that are the axes corresponding to the power and axis meridians of the cylindrical lens CL2. In panel (d) the angle between the line that connects the two peaks and the
 $y''$-axis is
 $\alpha$. (e) The red solid curve presents the relation between
 $\alpha$ and the depth of the spray droplets obtained from (3.1). In (e), the blue circular data points are obtained from the calibration experiments.

The depth of the droplets (i.e. the droplets  $z$ coordinate) was obtained using the ray transfer matrix method, which is elaborated in Wen et al. (Reference Wen, Wu, Zhuo and Wu2021). To this end, the elements of the ray transfer matrix for the rays propagating along the power meridian and axis meridian of CL2 were obtained. Then, these elements along with (13) in Wen et al. (Reference Wen, Wu, Zhuo and Wu2021) were used to obtain the depth of the droplets given by
 \begin{equation} \frac{c-b-z}{c-a-z} ={-}\frac{M_1}{M_2}\frac{\tan(\alpha)}{\tan(\alpha_0)}, \end{equation}
where  $a$ and
 $b$ are the distances between the surface of the bandpass filter shown in figure 2(a) and the focal planes 1 and 2, respectively;
 $c=210\,\mathrm {mm}$ is the distance between the origin of the coordinate system and the surface of the bandpass filter;
 $c-a-z$ and
 $c-b-z$ are the distances along the
 $z$-axis between a droplet with the depth of
 $z$ and focal planes 1 and 2, respectively. Please note that the choice of bandpass filter surface for the calculations is arbitrary and choosing other reference planes does not influence the values of
 $z$. This is because
 $c-a$ and
 $c-b$ that appear in (3.1) are the distances between the focal planes and the origin of the coordinate system that are fixed in the experiments. In (3.1),
 $M_1$ and
 $M_2$ are the magnification ratios for imaging at planes 1 and 2, respectively. Separate experiments (with laser turned off and in the absence of spray and air flow) were performed to obtain the above parameters, with details of these experiments discussed in Appendix B. In the present study, the values of
 $a$,
 $b$,
 $M_1$ and
 $M_2$ were 160 mm, 200 mm, 0.53 and 0.54, respectively. Here
 $\alpha _0$ is the angle that the power meridian of the cylindrical lens (CL2) makes with the
 $x$–
 $z$ plane. This angle was set to
 ${\rm \pi} /4$ using the CL2 mount. In (3.1),
 $\alpha$ depends on the orientation of the fringe patterns, with details of the calculation discussed below.
To calculate  $\alpha$, first the angle between the slanted fringes (see, for example, those in figure 4(b)) and the
 $x$-axis was obtained. This angle is referred to as
 $\gamma$. To calculate
 $\gamma$, first, a rectangular region highlighted with the red square in figure 4(b) was selected. This region is enlarged and shown in figure 4(c). Then, a 2-D fast Fourier transform (FFT) was applied to the data in this region, with the results presented in figure 4(d). To help elaborate the calculation of
 $\alpha$, the power meridian (
 $x''$) and axis meridian (
 $\kern0.7pt y''$) of CL2 were overlaid on figure 4(d). As can be seen in figure 4(d), two peaks (see the blue dots) are identified. The angle between the line that connects these two peaks (the brown dashed line) and the
 $f_y$ axis is referred to as
 $\gamma$ (see Gonzalez & Woods Reference Gonzalez and Woods2018). The angle between this line and the
 $y''$-axis is referred to as
 $\alpha$. The variation of
 $\alpha$ vs
 $z$ was obtained using (3.1) and is presented by the solid red curve in figure 4(e). As can be seen, the variation of
 $\alpha$ features an abrupt change at
 $z=10$ mm. The location of this abrupt change corresponds to focal plane 2 and is due to the change in the sign of
 $\tan (\alpha )$ in (3.1). That is, at
 $z = c-b=10\,\mathrm {mm}$,
 $\tan (\alpha )$ becomes zero. In addition to the predictions from (3.1), separate calibration experiments (detailed in Appendix B) were performed to experimentally obtain the relation between the depth of the droplets and
 $\alpha$. The results of these calibration experiments are overlaid on figure 4(e) using the blue solid circular data points. As can be seen, the results obtained from (3.1) and those from the calibration experiments match, suggesting that the formulation in (3.1) can allow for predicting the droplets depth using
 $\alpha$.
Once the  $z$ location of a droplet was calculated using the above procedure, its diameter was obtained from the formulation proposed in Wen et al. (Reference Wen, Wu, Zhuo and Wu2021), which is given by
 \begin{equation} d=F(z)\dfrac{2\lambda_{{L}}}{s} \left[\cos\left(\dfrac{\theta}{2}\right)+\dfrac{m\sin\left(\dfrac{\theta}{2} \right)}{\sqrt{m^{2}-2m\cos\left(\dfrac{\theta}{2}\right)+1}}\right]^{{-}1}, \end{equation}
where  $F(z)$ represents the dependence of the droplet diameter on its position along the
 $z$-axis. Here
 $F(z)$ is given by
 \begin{equation} F(z)=\dfrac{1}{\sqrt{\left[\dfrac{\cos(\alpha_0)}{M_1(c-a-z)}\right]^2+ \left[\dfrac{\sin(\alpha_0)}{M_2(c-b-z)}\right]^2}}. \end{equation}
In (3.2),  $\lambda _{{L}}$ is the wavelength of the AIPI laser,
 $s$ is the fringe spatial spacing, with a sample shown in figure 4(c), and
 $m$ is the index of refraction for distilled water, which is 1.33 as provided in Hardalupas et al. (Reference Hardalupas, Sahu, Taylor and Zarogoulidis2010). The uncertainties associated with measuring the droplet depth and diameter were estimated and the details are presented in Appendix C. These uncertainties depend on the imaging resolution, characteristics of the optics (such as focal length, magnification ratios and the distance between the focal planes), as well as the characteristics of the fringe patterns (such as their orientation and spacing). It was obtained that the maximum relative uncertainties in estimating the droplet depth and most probable diameter are about 13 % and 27 %, respectively.
Though the above procedure allows for estimating the droplets location and size, care must be taken in using the AIPI technique and also reducing the acquired images. Three limitations are of importance and are discussed here. First, it should be noted that this 3-D measurement technique, with details discussed above, can be applicable to dilute sprays but may not be applied to dense sprays such as those used in our previous investigation (Rostami et al. Reference Rostami, Li and Kheirkhah2023). Generally, sprays with significant overlap between the interferometric patterns of droplets (see an example in figure 5a) reduce the ability of the AIPI in resolving the location and size of the droplets. However, reliable 3-D measurements can yield an improved understanding of the sprays compared with the 2-D counterparts, provided the measurements are performed in a dilute spray environment, which is relevant to the present investigation. Second, too large droplets (larger than  $200\,\mathrm {\mu }{\rm m}$, see an example of a large droplet interferometric pattern in figure 5b) cannot be resolved. The procedure for removing too large droplets and those with significant overlap of the interferometric patterns from the analysis of the AIPI data is discussed in Appendix D. Third, the fringe patterns may not be fully developed inside focusing volume(s), and the measurement of the diameter for these droplets is not possible. In the present study, only the focusing plane P2 is located inside the illumination region. The focusing depth around P2 is about 1 mm that is significantly smaller than the total depth of the measurements (60 mm). It is important to note that the AIPI is capable of measuring the location of droplets positioned at P2 (see an example in figure 5c), but the diameter of those droplets cannot be measured. The
 $z$ location of the droplets in P2 equals
 $c-b$. Specifically, at
 $z = c-b$, (3.1) yields
 $\alpha = 0$. Thus, the 3-D position of the droplets located in plane P2 can be obtained but their diameter cannot be calculated.
Panel (a) presents significantly overlapping astigmatic interferometric images of droplets. Panel (b) presents astigmatic interferometric images of too large droplets, which cannot be resolved using the AIPI technique. Panel (c) presents an astigmatic interferometric image of a droplet located at the focal plane P2.

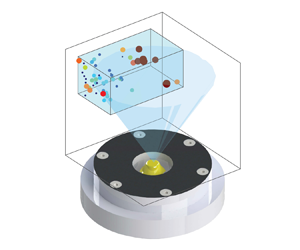
Acknowledging the above limitations, the 3-D position and the diameter of the droplets were obtained for all test conditions. Figure 6(a) shows a representative 3-D distribution of the droplets as well as their diameter. The results presented in the figure are for the test condition with  $U_{b}=6.1\,\mathrm {m}\,\mathrm {s}^{-1}$. To facilitate understanding the location of the droplets with respect to the spray, the spray cone of the utilized atomizer was overlaid on figure 6(a). The cone angle of the spray is
 $60^{\circ }$ in the absence of swirling co-flow and is provided by the manufacturer. The top and side views of the results in figure 6(a) are shown in figures 6(b) and 6(c), respectively. As can be seen, the large droplets are located at the periphery of the spray. It is speculated that the reason that a few of the identified droplets are positioned outside of this cone is the presence of the turbulent swirling co-flow, which is expected to increase the spray cone angle, as also reported in past investigations; see, for example, Rajamanickam & Basu (Reference Rajamanickam and Basu2017). The location of the droplets in three dimensions was used for identifying the clusters and voids, with relevant details discussed in the following subsection.
Panel (a) is the 3-D distribution of the droplets and the droplets diameter. Panels (b,c) are the top and side views of the 3-D distribution shown in (a). The transparent blue box presents the AIPI volume of interest. The results correspond to the test condition with  $U_{b}=6.1\,\mathrm {m}\,\mathrm {s}^{-1}$.

3.2. Clusters and voids identification in the 3-D space
The spatial distribution of the droplets in 3-D space was used to identify the clusters and voids. Using the 3-D position of the droplets centre along with the ‘Voronoin’ function in MATLAB , the 3-D Voronoï cells were obtained first. This was followed by removing the cells intersecting with the boundaries of the AIPI volume of interest. As a representative example, for the droplets identified and presented in figure 6, the Voronoï cells were obtained, those intersecting with the AIPI region-of-interest boundaries were removed, and the remaining cells are shown in figure 7(a). The 3-D position of all detected droplets were used to identify clusters and voids. For joint analysis of the droplet diameter and cluster volume, the droplets with detectable diameter that reside within the clusters/voids were used for the analysis.
Panel (a) is the Voronoï cells generated using the 3-D spatial distribution of droplets in figure 6. Panel (b) presents the p.d.f. of the local Voronoï cells' volumes normalized by their local mean value for the test condition with  $U_{b} =6.1\,\mathrm {m}\,\mathrm {s}^{-1}$. Overlaid on (b) is the p.d.f. of a random distribution of the droplets (see the black solid curve). Panel (c) presents the identified clusters (blue) and voids (green).

Once the Voronoï cells were obtained, the volumes of the cells were calculated using the ‘convhulln’ function in MATLAB . Compared with the particle-laden flow studies in which the particles are initially and relatively uniformly distributed in wind tunnels, in many engineering applications, the particles/droplets feature a biased distribution in space and, as a result, several regions in the 3-D space feature a relatively large concentration of the droplets. In the present study, the pressure swirl atomizer creates an inverted cone of droplets. Such a distribution of droplets leads to biased Voronoï cell volumes, and this bias was removed following the procedure described below, which is similar to that used in Sumbekova et al. (Reference Sumbekova, Cartellier, Aliseda and Bourgoin2017) and Rostami et al. (Reference Rostami, Li and Kheirkhah2023) for 2-D Voronoï cells. To this end, the mean of the local Voronoï cell's volume (
 $\bar {V}(x,y,z)$) was obtained first. To estimate
 $\bar {V}(x,y,z)$, the AIPI volume of interest was divided into several voxels with a length, width and height of
 $\Delta x = 4\,\mathrm {mm}$,
 $\Delta y=4\,\mathrm {mm}$ and
 $\Delta z=6\,\mathrm {mm}$, respectively. Then, the volume of the Voronoï cells corresponding to the droplets located within each of these voxels was obtained for all frames and then averaged for each test condition. To identify the clusters, first, the
 $\mathrm {p.d.f.}(V/\bar {V})$ was obtained, with that for the mean bulk flow velocity of
 $6.1\,\mathrm {m}\,\mathrm {s}^{-1}$ shown in figure 7(b) using the circular date symbol. Provided that the spatial distribution of the droplets followed the RPP, the p.d.f. of the normalized volume of Voronoï cells, referred to as
 $\mathrm {p.d.f.}_{RPP}$, was estimated using that in Ferenc & Néda (Reference Ferenc and Néda2007) and is given by
 \begin{equation} \mathrm{p.d.f.}_{RPP}(V/\bar{V})=\dfrac{B^A}{\varGamma(A)}\left(V/\bar{V}\right)^{A-1}\exp^{({-}B V/\bar{V})}, \end{equation}
where  $A$ and
 $B$ are fitting parameters with
 $A=B=5$, and
 $\varGamma$ is the gamma function with
 $\varGamma (A) = 24$. The variation of
 $\mathrm {p.d.f.}_{RPP}$ vs
 $V/\bar {V}$ is overlaid on figure 7(b) by the black solid curve and for comparison purposes. Furthermore, using MATLAB
 , 2000 synthetic images were generated. These images contained synthetic particles that were randomly distributed in the AIPI volume of interest. The number of synthetic droplets was identical to that shown in figure 7(a). The p.d.f. of
 $V/\bar {V}$ for the above synthetic particles was obtained, and it was confirmed that the p.d.f. of the Voronoï cells normalized volume nearly matches the right-hand side of (3.4). As results in figure 7(b) show, the
 $\mathrm {p.d.f.}_{RPP}$ intersects with the experimentally measured p.d.f. at two normalized volumes, which are
 $V/\bar {V}(x,y,z)=0.58$ and 1.90. These threshold values were used to categorize the 3-D cells shown in figure 7(a) either as clusters (for
 $V \leq 0.58\bar {V}(x,y,z)$) or voids (for
 $V \geq 1.90\bar {V}(x,y,z)$). That is, Voronoï cells with a volume smaller than
 $0.58\bar {V}(x,y,z)$ were labelled as clusters and Voronoï cells with a volume larger than
 $1.90\bar {V}$ were labelled as voids. This was followed by merging the cells with intersecting faces. Finally, the identified clusters and voids are shown in figure 7(c) by the blue and green polyhedrons, respectively. As can be seen in figure 7(c), the identified clusters are 3-D structures elongated along the
 $z$-axis. Such instantaneously resolved 3-D structures cannot be obtained using the conventional 2-D ILIDS. Also, the length scale of such clusters obtained using the 2-D diagnostics would be smaller than the true length scale of the clusters since the 3-D location of the droplets influences the cluster length scale.
4. Results
The results are grouped into four subsections. In the first subsection, the characteristics of the background turbulent swirling air flow are presented. In the second subsection the influence of the background flow on the dynamics of the spray as well as the diameter of the droplets are analysed. This subsection is followed by the analysis of the degree of droplet clustering and the length scales of the clusters and voids. Finally, the inner-cluster characteristics are investigated.
4.1. Characteristic of the background turbulent swirling flow
Though a summary of the background turbulent air flow characteristics was provided in table 1 to estimate the governing parameters, a detailed analysis is presented here. Specifically, the statistics of the background turbulent velocity fluctuations and the swirl number ( $S$) are studied. The local mean velocity and r.m.s. velocity fluctuations were obtained for all test conditions, with the representative results corresponding to
 $U_{b} = 6.1\,\mathrm {m}\,\mathrm {s}^{-1}$ shown in figure 8. The results in figure 8(a–c) present the mean of the velocity vector components normalized by the mean bulk flow velocity along
 $y$,
 $x'$ and
 $z'$, which are
 $\bar {u}/U_{b}$,
 $\bar {v}/U_{b}$ and
 $\bar {w}/U_{b}$, respectively. The results in figure 8(d–f) present the local r.m.s. of the velocity fluctuations normalized by the mean bulk flow velocity along
 $y$,
 $x'$ and
 $z'$, which are
 $u_{rms}/U_{b}$,
 $v_{rms}/U_{b}$ and
 $w_{rms}/U_{b}$, respectively. The intersection of the SPIV FOV and AIPI region of interest is overlaid on the figures using the black dashed boxes. In figure 8(a), the white curves are the contours of
 $\bar {u}/U_{b} = 0$. As the results in figure 8(a) show, there exists a conical vortex breakdown bubble, which is a typical characteristic of swirling flows and has been reported in several past investigations; see, for example, O'Connor & Lieuwen (Reference O'Connor and Lieuwen2012), Smith et al. (Reference Smith, Emerson, Chterev, Noble and Lieuwen2016) and Wang et al. (Reference Wang, Fröhlich, Maas, He and Wang2016). The bubble was present for all test conditions. The results presented in figure 8(d–f) show that at a given vertical distance from the nozzle, the r.m.s. of the fluctuating components of the velocity along
 $x'$ and
 $y$ features a local minimum at the centre (
 $x'=0$) and a local maxima at the shear layers, which are observed and reported in several past investigations; see, for example, Wang et al. (Reference Wang, Fröhlich, Maas, He and Wang2016), Chen et al. (Reference Chen, Langella, Swaminathan, Stöhr, Meier and Kolla2019), Agostinelli et al. (Reference Agostinelli, Laera, Boxx, Gicquel and Poinsot2021) and Kumar, Mathur & Chakravarthy (Reference Kumar, Mathur and Chakravarthy2021). It was confirmed that, for the range of tested mean bulk flow velocities, the mean and r.m.s. of the velocity components normalized by the mean bulk flow velocity feature a similarity behaviour, which agrees with the conclusions reported in past studies; see, for example, Rajamanickam & Basu (Reference Rajamanickam and Basu2017).
Panels (a–c) are the time-averaged velocity vector components normalized by the mean bulk flow velocity along  $y$,
 $x'$ and
 $z'$, respectively. Superimposed on (a) are the contours of
 $\bar {u}/U_{b} = 0$ with white colour curves. Panels (d–f) present the local r.m.s. of the velocity fluctuations normalized by the mean bulk flow velocity along
 $y$,
 $x'$ and
 $z'$, respectively. The black dashed box is the intersection of the AIPI region of interest and the SPIV plane of measurements. The results pertain to the test condition with
 $U_{b}= 6.1\,\mathrm {m}\,\mathrm {s}^{-1}$. Results are shown for (a)
 $\bar {u}/U_{b}$, (b)
 $\bar {v}/U_{b}$, (c)
 $\bar {w}/U_{b}$, (d)
 ${u}_{rms}/U_{b}$, (e)
 ${v}_{rms}/U_{b}$ and (f)
 ${w}_{rms}/U_{b}$.

The swirl number, which is the ratio of the axial flux of the tangential momentum to the product of the axial flux of the axial momentum and  $R = D/2$, was estimated for all test conditions. As shown in Candel et al. (Reference Candel, Durox, Schuller, Bourgouin and Moeck2014), the above definition of the swirl number leads to the appearance of a pressure-dependent term in the formulation of the swirl number, which usually cannot be experimentally estimated. Neglecting this pressure-dependent term, the swirl number can be calculated using the formulation in Candel et al. (Reference Candel, Durox, Schuller, Bourgouin and Moeck2014) and is given by
 \begin{equation} S=\dfrac{\int_{0}^{R} \bar{w} \, \bar{u}r^{2} \,\mathrm{d}r}{R\int_{0}^{R} \bar{u}^{2}r\, \mathrm{d}r}. \end{equation}
For all test conditions, the swirl number was estimated using the velocity data at  $y = 15\,{\rm mm}$ and is about 0.36, which is less than that of typical gas turbine engine combustors (see, for example, Stone & Menon Reference Stone and Menon2002). Following the study of Degenève et al. (Reference Degenève, Vicquelin, Mirat, Caudal and Schuller2021), all test conditions feature a relatively moderate swirl number.
4.2. Dynamics of the spray formation and droplet characteristics
In this subsection, first, the shadowgraphy images are used to study the dynamics of the spray formation. Then, the AIPI data are used to understand the droplet diameter statistics and how these relate to the dynamics of the spray formation.
The shadowgraphy images were analysed for all test conditions, with the sample results presented in figure 9. The results in figures 9(a–e), 9( f–j), 9(k–o) and 9( p–t) correspond to test conditions with  $U_{b}=0, 12.2, 15.2$ and
 $18.2\,\mathrm {m}\,\mathrm {s}^{-1}$, and present time lapses of
 $\Delta t = 72.7, 25.2, 3.9$ and 0.9 ms, respectively. The videos corresponding to the results in figure 9 are also provided as supplementary materials available at https://doi.org/10.1017/jfm.2024.926. As shown in the first column of figure 9 and in the corresponding video, for
 $U_{b} = 0\,\mathrm {m}\,\mathrm {s}^{-1}$, a bulge of liquid is formed at the tip of the injector initially, see the arrow in figure 9(a). As the time is lapsed, this bulge of liquid stretches and detaches from the injector tip. Concurrent with this, a liquid column emerges from the injector, with the corresponding inset presented in figure 9(b). The bulge of liquid is then stretched and broken into two large droplets; and, the thin liquid column atomizes into small droplets, forming a conical spray. The formation of the large droplets and spray are shown in figure 9(c,d). After this, as shown in figure 9(e), the formation of the spray ceases and a bulge of liquid emerges at the tip of the injector, repeating the process presented in figure 9(a–e).
The first to fourth columns present the dynamics of the spray formation for the mean bulk flow velocities of 0, 12.2, 15.2 and  $18.2\,\mathrm {m}\,\mathrm {s}^{-1}$, respectively. The videos corresponding to (a–e), ( f–j), (k–o) and ( p–t) are provided as supplementary materials.

The presence of the swirling flow at relatively small mean bulk flow velocities ( $U_{b} \leq 12.2\,\mathrm {m}\,\mathrm {s}^{-1}$) does not significantly influence the formation of the conical spray discussed above; however, the liquid bulge undergoes a breakup that is different than that at
 $U_{b}= 0\,\mathrm {m}\,\mathrm {s}^{-1}$. Specifically, once the liquid bulge is detached from the injector tip, the bulge is carried into the swirling flow, elongated and broken into several small droplets. A sample of such liquid bulge that undergoes the above process is highlighted by the arrows in figure 9( f–i). Further increasing the mean bulk flow velocity to
 $U=15.2\,\mathrm {m}\,\mathrm {s}^{-1}$ changes the spray formation. Specifically, it is observed that the liquid bulge (which detached from the tip of the injector for
 $U_{b} \leq 12.2\,\mathrm {m}\,\mathrm {s}^{-1}$) remains attached, forming a thin liquid pool at the injector tip and for
 $U_{b} = 15.2\,\mathrm {m}\,\mathrm {s}^{-1}$. The interaction of this liquid pool with the swirling flow leads to the formation of elongated structures, with a sample enlarged and shown in the inset of figure 9(k). These structures disintegrate into large droplets that undergo bag breakup as shown in figure 9(m), similar to that reported in Ade et al. (Reference Ade, Kirar, Chandrala and Sahu2023). The onset of bag breakup can be characterized estimating the Weber number. The critical Weber number at which transition from liquid column vibration to bag breakup occurs depends on the flow configuration and is about 6 and 12 for droplets interacting with counter-flow and cross-flow streams, respectively; see Kirar et al. (Reference Kirar, Soni, Kolhe and Sahu2022). For the swirling flow configuration studied in the present investigation, following Kirar et al. (Reference Kirar, Soni, Kolhe and Sahu2022), the Weber number was calculated using
 \begin{equation} We=\frac{\rho_{A}U_{b}^{2}d_0}{\sigma_0}, \end{equation}
where  $\sigma _0$ is the surface tension of water at laboratory temperature and
 $d_0$ is the initial diameter of a large droplet experiencing breakup. In the present study, the average diameter of droplets undergoing breakup was used for the calculation of the Weber number. This average diameter was about 3 mm (obtained from the shadowgraphy measurements). The test condition with
 $U_{b}=15.2\,\mathrm {m}\,\mathrm {s}^{-1}$ features a maximum Weber number of about 12. This is the critical Weber number at which the bag breakup is anticipated to occur for the examined flow configuration. Indeed, agreeing with the results of the present study, the bag breakup was observed first at
 $U_{b}=15.2\,\mathrm {m}\,\mathrm {s}^{-1}$. For mean bulk flow velocities larger than
 $15.2\,\mathrm {m}\,\mathrm {s}^{-1}$, the formation of the central spray shown in figure 9(a–o) is suppressed, but the liquid pool at the tip of the injector is present and undergoes more frequent formation and shedding of large droplets. These droplets undergo double bag breakup during interaction with the swirling flow (see the inset of figure 9r), which is similar to that reported in Ade et al. (Reference Ade, Kirar, Chandrala and Sahu2023).
The large droplets (with the dynamics of formation discussed above) can influence the quality of the collected AIPI images and their analysis. As shown in figure 3, the AIPI region of interest and shadowgraphy plane of measurement intersect. It should be noted that in figure 9 only the cropped view of the shadowgraphy images is presented. As such, it may be possible for some of the large droplets to appear in the AIPI region of interest. The size of such droplets (which are larger than  $200\,\mathrm {\mu }{\rm m}$) exceeds the upper range of the droplet size that can be resolved by the AIPI and these droplets cannot be resolved using this technique. Such a characteristic of the AIPI ultimately decreases the number of identified droplets.
Given the above dynamics of the large droplets and their relation to the AIPI region of interest, the statistics of the droplet diameter is investigated. Figure 10(a,b) presents the p.d.f. and the cumulative density function (c.d.f.) of the droplet diameter obtained from the AIPI technique. As can be seen, for all test conditions, the p.d.f.s feature a relatively large probability at about  $12\,\mathrm {\mu }{\rm m}$. Also, the p.d.f.s feature relatively large values at
 $d = 51\,\mathrm {\mu }\mathrm {m}$, with the test conditions corresponding to
 $U_{b} < 24.3\,\mathrm {m}\,\mathrm {s}^{-1}$ featuring a local maximum at this droplet diameter. It is observed that increasing the mean bulk flow velocity results in the gradual disappearance of the local maximum present at about
 $d=51\,\mathrm {\mu }\mathrm {m}$. To illustrate and quantify this, the values of the c.d.f.s at
 $d=51\,\mathrm {\mu }\mathrm {m}$ were presented versus the mean bulk flow velocity in figure 10(c). Increasing
 $U_{b}$ from 6.1 to 12.2 changes
 $\mathrm {c.d.f.}(d = 51\,\mathrm {\mu }\mathrm {m})$ from about 0.50 to 0.59; however, increasing the mean bulk flow velocity from about 12.2 to
 $15.2\,\mathrm {m}\,\mathrm {s}^{-1}$ leads to a larger increase of
 $\mathrm {c.d.f.}(d = 51\,\mathrm {\mu }\mathrm {m})$ from about 0.50 to 0.69. Further increasing the mean bulk flow velocity gradually increases the total number of droplets as shown in figure 10(c). It is hypothesized that the reason for the significant increase in the number of the spray droplets at
 $U_{b} = 15.2\,\mathrm {m}\,\mathrm {s}^{-1}$ is due to the occurrence of the (double) bag breakup, with exemplary dynamics presented in figure 9(k–o). For all test conditions, the mean droplet diameter (
 $\bar {d}$) was obtained and presented in figure 10(d). The length of the error bars in figure 10(d) present the bin size (
 $13\,\mathrm {\mu }{\rm m}$) used for calculating the p.d.f.s and c.d.f.s. As can be seen, the mean diameter of the droplet decreases from about 57 to
 $37\,\mathrm {\mu }{\rm m}$ by increasing the mean bulk flow velocity from 6.1 to
 $27.3\,\mathrm {m}\,\mathrm {s}^{-1}$.
Panels (a,b) are the probability and cumulative density functions of the droplet diameter, respectively. Panel (c) presents the variation of the c.d.f. at  $d=51\,\mathrm {\mu }{\rm m}$ versus the mean bulk flow velocity. Panel (d) is the variations of the mean droplet diameter versus the mean bulk flow velocity.

4.3. The characteristics of clusters and voids
In this subsection, the droplets degree of clustering as well as the length scales of the clusters and voids are presented. As discussed in § 3, some droplets are removed from the raw interferometric images during the data reduction process. The effects of such removal of the droplets on the clusters characteristics are quantified and presented in Appendix E. In summary, it is confirmed that, for a relatively large number of the droplets retained from the raw interferometric images, the degree of clustering remained unchanged and the mean cluster length scale varied by less than about 0.5 mm.
4.3.1. Degree of clustering
Compared with the studies of Monchaux et al. (Reference Monchaux, Bourgoin and Cartellier2010) and Rostami et al. (Reference Rostami, Li and Kheirkhah2023), in which the area of the Voronoï cells is used for estimating the degree of clustering, in the present study, the volume of the Voronoï cells is used to calculate the degree of clustering. This approach is similar to that used in the DNS of Tagawa et al. (Reference Tagawa, Mercado, Prakash, Calzavarini, Sun and Lohse2012). For all test conditions, the p.d.f.s of the local Voronoï cells' volumes normalized by their local mean were obtained following the procedure discussed in § 3.2, and the results are presented in figure 11. The results in figure 11 show that the p.d.f.s of  $V/\bar {V}$ collapse for all test conditions. The
 $\mathrm {p.d.f.}_{RPP}$ is also overlaid on figure 11 using the black solid curve. As can be seen, the values of the experimentally obtained p.d.f.s are larger than the
 $\mathrm {p.d.f.}_{RPP}$ for
 $V/\bar {V} < 0.58$ and
 $V/\bar {V} > 1.90$ and, as a result, clustering occurs for all test conditions.
The p.d.f.s of the local Voronoï cells' volumes normalized by their local mean value for all test conditions. The p.d.f. of the random Poisson process is overlaid on the figure with the black solid curve. The blue vertical dashed lines are  $V/\bar {V}=0.58$ and
 $V/\bar {V}=1.90$.

The variation of the degree of clustering versus the mean bulk flow velocity was obtained and presented in figure 12(a). It is important to note that in calculating the degree of clustering, for particles randomly distributed in three dimensions,  $\sigma _{RPP} = 0.45$ (see Ferenc & Néda Reference Ferenc and Néda2007), which is different than
 $\sigma _{RPP} = 0.53$ for particles randomly distributed in the 2-D space. Since our analyses are performed for the 3-D distribution of particles,
 $\sigma _{RPP}$ was set to 0.45 for calculating the degree of clustering. For comparison purposes, the degree of clustering from the present study and those of past investigations are compiled and presented versus
 $Re_\lambda$ and
 $St$ in figures 12(b) and 12(c), respectively. To accommodate the presentation of the results corresponding to large Stokes numbers, the horizontal axis in figure 12(c) was split and different linear scales were used in the figure for results with Stokes numbers smaller and larger than about 34; see the regions with the white and grey backgrounds in the figure. The degree of clustering from 2-D measurements of Monchaux et al. (Reference Monchaux, Bourgoin and Cartellier2010), Obligado et al. (Reference Obligado, Teitelbaum, Cartellier, Mininni and Bourgoin2014), Sumbekova et al. (Reference Sumbekova, Cartellier, Aliseda and Bourgoin2017), Petersen, Baker & Coletti (Reference Petersen, Baker and Coletti2019) and Rostami et al. (Reference Rostami, Li and Kheirkhah2023), as well as that obtained from 3-D DNS of Tagawa et al. (Reference Tagawa, Mercado, Prakash, Calzavarini, Sun and Lohse2012) are overlaid on the region with the white background in figure 12(c). The results of the present study are shown on the region with a grey background colour in figure 12(c). Comparison of the results presented in our previous work (Rostami et al. Reference Rostami, Li and Kheirkhah2023) with those of the present study shows that, for relatively small Taylor-length-scale-based Reynolds numbers (
 $Re_\lambda \lesssim 100$) and for a wide range of Stokes numbers (
 $3 \lesssim St \lesssim 142$), increasing
 $St$ and
 $Re_\lambda$ slightly increases the degree of clustering from about 0.2 to 0.4. However, the sensitivity of the degree of clustering to the Taylor-length-scale-based Reynolds number is larger at larger values of this parameter. For example, the results of Sumbekova et al. (Reference Sumbekova, Cartellier, Aliseda and Bourgoin2017) show that increasing
 $Re_\lambda$ from about 200 to 400 increases the degree of clustering from about 0.5 to 1.2. At a fixed Taylor-length-scale-based Reynolds number (
 $Re_\lambda \approx 100$), results presented in Monchaux et al. (Reference Monchaux, Bourgoin and Cartellier2010), Tagawa et al. (Reference Tagawa, Mercado, Prakash, Calzavarini, Sun and Lohse2012) and Obligado et al. (Reference Obligado, Teitelbaum, Cartellier, Mininni and Bourgoin2014) suggest that the variation of the degree of droplets clustering versus
 $St$ features a peak at
 $St\approx 2\unicode{x2013}4$. It is acknowledged that the background flows in the present study and Rostami et al. (Reference Rostami, Li and Kheirkhah2023) are turbulent swirling and jet flows and are different than those of the past investigations; see, for example, Monchaux et al. (Reference Monchaux, Bourgoin and Cartellier2010), Tagawa et al. (Reference Tagawa, Mercado, Prakash, Calzavarini, Sun and Lohse2012) and Obligado et al. (Reference Obligado, Teitelbaum, Cartellier, Mininni and Bourgoin2014). Such differences along with the differences between the examined non-dimensional parameters may impact the differences in the degree clustering reported in figure 12(b,c).
Panels (a–c) are the variations of the droplets degree of clustering versus the mean bulk flow velocity, Taylor-length-scale-based Reynolds number and Stokes number, respectively. Overlaid on (b,c) are the results from Monchaux et al. (Reference Monchaux, Bourgoin and Cartellier2010), Obligado et al. (Reference Obligado, Teitelbaum, Cartellier, Mininni and Bourgoin2014), Sumbekova et al. (Reference Sumbekova, Cartellier, Aliseda and Bourgoin2017), Tagawa et al. (Reference Tagawa, Mercado, Prakash, Calzavarini, Sun and Lohse2012), Petersen et al. (Reference Petersen, Baker and Coletti2019) and Rostami et al. (Reference Rostami, Li and Kheirkhah2023).

4.3.2. Length scale of clusters and voids
Following the procedure discussed in § 3.2, the clusters and voids were identified using the threshold values of  $V/\bar {V}=0.58$ and 1.90 (see the blue dashed lines in figure 11). Then, the clusters and voids length scales were estimated using
 $L_{c} = \sqrt [3]{V_{c}}$ and
 $L_{v} = \sqrt [3]{V_{v}}$, respectively, with
 $V_{c}$ and
 $V_{v}$ being the cluster and void volumes. For all test conditions, the p.d.f.s of
 $L_{c}$ and
 $L_{v}$ are presented in figures 13(a) and 13(b), respectively. As can be seen, the p.d.f.s of the cluster length scale feature a peak, and the p.d.f.s nearly collapse for
 $L_{c} \gtrsim 10$ mm. It is observed that increasing the mean bulk flow velocity from 6.1 to
 $27.3\,\mathrm {m}\,\mathrm {s}^{-1}$ decreases the most probable value of
 $L_{c}$ from about 5.5 to 4.5 mm. Similar behaviour is also observed for the p.d.f. of the voids length scales. Specifically, the p.d.f.s of this parameter nearly collapse for
 $L_{v} \gtrsim 15$ mm; furthermore, the most probable value of
 $L_{v}$ decreases from about 10.1 to 8.7 mm, increasing
 $U_{b}$ from 6.1 to
 $27.3\,\mathrm {m}\,\mathrm {s}^{-1}$.
Panels (a,b) are the p.d.f.s of the cluster and void length scales, respectively.

The majority of past investigations (see, for example, Obligado et al. Reference Obligado, Teitelbaum, Cartellier, Mininni and Bourgoin2014; Sumbekova et al. Reference Sumbekova, Cartellier, Aliseda and Bourgoin2017; Rostami et al. Reference Rostami, Li and Kheirkhah2023) studied the relations between the mean length scale of the clusters divided by the Kolmogorov length scale as well as how this ratio is influenced by  $Re_\lambda$ and/or
 $St$. To study this, the variations of
 $\overline {L_{c}}/\eta$ vs
 $Re_\lambda$ and
 $St$ are presented in figures 14(a) and 14(b), respectively. The lengths of the horizontal error bars in figure 14(a,c) as well as figure 14(b,d) are the maximum standard deviation in calculating
 $Re_\lambda$ and
 $St$ for the black dashed box shown in figure 8 and from the SPIV data. Also, the lengths of the vertical error bars in figure 14(a,c) and figure 14(b,d) are the maximum standard deviation in calculating
 $\overline {L_{c}}/\eta$ and
 $\overline {L_{v}}/\varLambda$. For comparison purposes, the results of Obligado et al. (Reference Obligado, Teitelbaum, Cartellier, Mininni and Bourgoin2014), Sumbekova et al. (Reference Sumbekova, Cartellier, Aliseda and Bourgoin2017) and Rostami et al. (Reference Rostami, Li and Kheirkhah2023) are also overlaid on the figures. The results in figure 14(a) show that the relation between
 $\overline {L}_{c}/\eta$ and
 $Re_\lambda$ depends on the range of the tested Stokes and Taylor-length-scale-based Reynolds numbers. For relatively large Stokes numbers, the results of Rostami et al. (Reference Rostami, Li and Kheirkhah2023) and those of the present study show that increasing the
 $Re_\lambda$ from about 10 to 47 increases
 $\overline{L}_{c}/\eta$ from about 18 to 244. However, for small Stokes numbers, increasing
 $Re_\lambda$ from about 200 to 477 increases
 $\overline {L_{c}}/\eta$ from about 5 to 80. Compared with the above and independent of the tested
 $Re_\lambda$, the results of the present study and those of Tagawa et al. (Reference Tagawa, Mercado, Prakash, Calzavarini, Sun and Lohse2012), Obligado et al. (Reference Obligado, Teitelbaum, Cartellier, Mininni and Bourgoin2014), Sumbekova et al. (Reference Sumbekova, Cartellier, Aliseda and Bourgoin2017), Petersen et al. (Reference Petersen, Baker and Coletti2019) and Rostami et al. (Reference Rostami, Li and Kheirkhah2023) shown in figure 14(b) suggest that the variation of
 $\overline {L_{c}}/\eta$ versus the Stokes number follows an increasing trend. It is also anticipated that as the Stokes number approaches zero, the cluster size should approach zero. As such, the least square method was used to fit a power-law relation (with
 $\eta ^{-1}\overline {L_{c}}(St = 0) = 0$) to the results in figure 14(a). This relation is shown by the red dashed curve and is given by
 \begin{equation} \frac{\overline{L}_{c}}{\eta} \approx 8.38St^{0.67}. \end{equation}
It is important to highlight that the positive relation between the mean cluster length scale normalized by the Kolmogorov length scale and the Stokes number was proposed for  $St<20$ in our previous work (Rostami et al. Reference Rostami, Li and Kheirkhah2023). This previous study also suggested that
 $\overline {L_{c}}/\eta$ appears to follow a linear relation with
 $St$. For the relatively large Stokes numbers examined in the present study, the positive relation in Rostami et al. (Reference Rostami, Li and Kheirkhah2023) is confirmed. However, a power-law relation in the form of (4.3) appears to best present the large range of Stokes numbers examined here and in past investigations.
Panels (a,b) are the variations of the mean cluster length scale normalized by the Kolmogorov length scale versus  $Re_\lambda$ and
 $St$, respectively. Panels (c,d) are the variations of the mean void length scale normalized by the integral length scale versus
 $Re_\lambda$ and
 $St$, respectively. Overlaid on (a–d) are the results of Obligado et al. (Reference Obligado, Teitelbaum, Cartellier, Mininni and Bourgoin2014), Sumbekova et al. (Reference Sumbekova, Cartellier, Aliseda and Bourgoin2017), Petersen et al. (Reference Petersen, Baker and Coletti2019) and Rostami et al. (Reference Rostami, Li and Kheirkhah2023).

The variations of the mean void length scale normalized by the integral length scale ( $\overline {L_{v}}/\varLambda$) versus both
 $Re_\lambda$ and
 $St$ were obtained, and the results are presented in figures 14(c) and 14(d), respectively. The length of the vertical error bar in figures 14(c) and 14(d) is the maximum standard deviation in estimating
 $\overline {L_{v}}/\varLambda$. Overlaid on these figures by the solid black circular data symbols are the values of
 $\overline {L_{v}}/\varLambda$ from the authors’ past work. As can be seen, the mean length scales of the voids are of the order of the integral length scale (
 $\overline {L_{v}}\approx 1.5 \varLambda$) for the range of examined
 $Re_\lambda$ and
 $St$.
4.4. Inner-cluster and inner-void characteristics
The number density of the droplets inside the clusters and voids as well as the joint droplets and clusters characteristics are studied in this subsection. As discussed in Appendix E, the normalized characteristics presented in this subsection were not significantly influenced by removal of less than 50 % of the droplets from the astigmatic interferometric images.
4.4.1. Number density of droplets within the clusters and voids
Figure 15 presents the j.p.d.f. of the number of droplets ( $N_{d}$) that reside within the clusters and the volume of the clusters (
 $V_{c}$). The j.p.d.f.s are presented in a logarithmic scale to improve the clarity of presentations. The results in figure 15(a–h) correspond to test conditions with the mean bulk flow velocities of 6.1, 9.1, 12.2, 15.2, 18.2, 21.2, 24.3 and
 $27.3\,\mathrm {m}\,\mathrm {s}^{-1}$, respectively. As can be seen, there exists a positive relation between the number of droplets and the volume of the clusters, i.e. larger clusters accommodate a greater number of droplets. It can also be seen that increasing the mean bulk flow velocity influences the above relation. To quantify this, similar to Rostami et al. (Reference Rostami, Li and Kheirkhah2023), the combination of (
 $N_{d}, V_{c}$) data points at which the j.p.d.f. remarkably changes by varying
 $V_{c}$ at a fixed
 $N_{d}$ were obtained, with representative results shown by the white circular data points in figure 15(a). Then, two lines with slopes of
 $m_1$ and
 $m_2$ were fit to the white data points using the least square technique. Then, the average number density was estimated using
 $\bar {m} = 0.5(m_1+m_2)$. The variations of
 $m_1$,
 $m_2$ and
 $\bar {m}$ versus the mean bulk flow velocity are presented in figure 16(a–c), respectively. As can be seen, increasing the mean bulk flow velocity from 6.1 to
 $15.2\,\mathrm {m}\,\mathrm {s}^{-1}$ decreases
 $m_1$,
 $m_2$ and
 $\bar {m}$. The decrease in the number density of the clusters is similar to the observation reported in Rostami et al. (Reference Rostami, Li and Kheirkhah2023) for sprays injected in turbulent co-flows. However, for test conditions with
 $U_{b}\gtrsim 15.2\,\mathrm {m}\,\mathrm {s}^{-1}$,
 $m_1$,
 $m_2$ and
 $\bar {m}$ increase with increasing the mean bulk flow velocity. Similar to the above analysis, for all test conditions, the j.p.d.f. of the number of droplets inside a given void (
 $N_{d}^{\prime }$) and the void volume were obtained, with the corresponding results presented in figure 17. As can be seen, similar to the results presented in figure 15, a positive relation exists between
 $N_{d}^{\prime }$ and
 $V_{v}$, with the slope of this relation depending on the mean bulk flow velocity. Similar to the procedure discussed above for calculation of the droplets number density inside the clusters, those for the voids (
 $m^\prime _1$,
 $m^\prime _2$ and
 $\overline {m^\prime }= 0.5(m^\prime _1+m^\prime _2)$) were calculated, and the sample results are shown in figure 17(a). For all test conditions, the above parameters were obtained and their variation versus the mean bulk flow velocity are presented in figure 16(d–f). As can be seen, similar to the variations of the number density of the droplets that reside inside the clusters (see figure 16a–c),
 $m^{\prime }_1$,
 $m^{\prime }_2$, and
 $\overline {m^{\prime }}$ attain minimum values at
 $U_{b}=15.2\,\mathrm {m}\,\mathrm {s}^{-1}$. Comparison of the results presented in figure 16(a–c) with those in figure 16(d–f) shows that the number density of droplets that reside within the clusters is about one order of magnitude larger than the number density of droplets that reside within the voids. This is similar to the conclusions presented in Rostami et al. (Reference Rostami, Li and Kheirkhah2023); however, the results of the present study extends those in Rostami et al. (Reference Rostami, Li and Kheirkhah2023) to large Stokes numbers that are of more relevance to engineering applications such as gas turbine engine combustors.
The logarithmic j.p.d.f.s of the number of droplets within clusters and the cluster volume. Panels (a–h) correspond to test conditions with  $U_{b}=$ 6.1, 9.1, 12.2, 15.2, 18.2, 21.2, 24.3 and
 $27.3\,\mathrm {m}\,\mathrm {s}^{-1}$, respectively.

Panels (a–c) present the variations of  $m_1$,
 $m_2$ and
 $0.5(m_1+m_2)$ vs
 $U_{b}$, respectively. Panels (d–f) are the variations of
 $m^\prime _1$,
 $m^\prime _2$ and
 $0.5(m^\prime _1+m^\prime _2)$ vs
 $U_{b}$, respectively.

The logarithmic j.p.d.f.s of the number of droplets within voids and the void volume. Panels (a–h) are for test conditions with  $U_{b}=$ 6.1, 9.1, 12.2, 15.2, 18.2, 21.2, 24.3 and
 $27.3\,\mathrm {m}\,\mathrm {s}^{-1}$, respectively.

It is of interest to investigate the reason for the number density of the droplets within both clusters and voids featuring a minimum at the mean bulk flow velocity of  $15.2\,\mathrm {m}\,\mathrm {s}^{-1}$. To this end, the total number density (
 $\bar {M}$, the ratio of the total number of droplets identified in the AIPI region of interest divided by the volume of this region) was obtained for all test conditions and the results are shown in figure 18. As can be seen, the values of the total number density of the droplets also feature a minimum at
 $U_{b}= 15.2\,\mathrm {m}\,\mathrm {s}^{-1}$. For
 $0 \lesssim U_{b} \lesssim 15.2\,\mathrm {m}\,\mathrm {s}^{-1}$, increasing the mean bulk flow velocity disperses the particles out of the AIPI region of interest, decreasing the total number of the detected droplets. However, for
 $U_{b} \gtrsim 15.2\,\mathrm {m}\,\mathrm {s}^{-1}$, the Weber number exceeds the critical Weber number and leads to the occurrence of the (double) bag breakup (see figure 9 and the videos in the supplementary materials), which increases the number of generated droplets. It is concluded that the dynamics that influences the droplets generation and atomization plays a role in the trend associated with the variation of
 $\bar {M}$ vs
 $U_{b}$, which affects the variations of
 $\bar {m}$ and
 $\overline {m^\prime }$ with
 $U_{b}$.
The mean number density of the droplets versus the mean bulk flow velocity.

Rostami et al. (Reference Rostami, Li and Kheirkhah2023) showed that, though the number density of the droplets that reside within the clusters and voids can vary by changing the background flow characteristics,  $\bar {m}/\bar {M}$ and
 $\overline {m^{\prime }}/\bar {M}$ remain nearly unchanged and about 5.5 and 0.8, respectively. It is of interest to study if the findings of Rostami et al. (Reference Rostami, Li and Kheirkhah2023) can be extended to sprays injected to turbulent swirling co-flows with relatively large Stokes numbers. As such, the variations of
 $\bar {m}/\bar {M}$ versus the Taylor-length-scale-based Reynolds and Stokes numbers are presented in figures 19(a) and 19(b), respectively. Also, the variations of
 $\overline {m^{\prime }}/\bar {M}$ vs
 $Re_\lambda$ and
 $St$ are presented in figures 19(c) and 19(d), respectively. Additionally, the results of Rostami et al. (Reference Rostami, Li and Kheirkhah2023) are overlaid on the figures. It can be seen that, for similar values of
 $Re_\lambda$ and
 $St$,
 $\bar {m}/\bar {M}$ and
 $\overline {m^{\prime }}/\bar {M}$ obtained from the present study match those of our past work. This may suggest that the normalized number densities of the droplets within clusters and voids are independent of the presence of the swirling flow and the type of utilized diagnostics (two versus three dimensional) for
 $20 \lesssim Re_\lambda \lesssim 40$. The results presented in figures 19(c) and 19(d) show that increasing
 $Re_\lambda$ and
 $St$ to about 50 and 140 do not change the normalized number density of the droplets within voids and this number remains about 0.8. However, the results of the present study and those of Rostami et al. (Reference Rostami, Li and Kheirkhah2023) show that increasing
 $Re_\lambda$ from about 10 to 47 and
 $St$ from about 3 to 142 increase the normalized number density of the droplets inside the clusters from about 4.6 to 7.4.
Panels (a,b) are the variations of the mean number density of droplets within clusters divided by the mean global number density versus  $Re_\lambda$ and
 $St$, respectively. Panels (c,d) are the variations of the mean number density of droplets within voids divided by the mean global number density versus
 $Re_\lambda$ and
 $St$, respectively. Overlaid in (a–d) are the results of Rostami et al. (Reference Rostami, Li and Kheirkhah2023).

4.4.2. Joint p.d.f. of the droplet diameter and cluster volume
The j.p.d.f.s of the clusters volume normalized by their mean value ( $V_{c}/\overline {V_{c}}$) and the mean diameter (
 $\tilde {d}$) of the droplets that reside within a given cluster were obtained for all test conditions, and the results are presented in figure 20. The results shown in figure 20(a–h) pertain to test conditions with the mean bulk flow velocities of 6.1, 9.1, 12.2, 15.2, 18.2, 21.2, 24.3 and
 $27.3\,\mathrm {m}\,\mathrm {s}^{-1}$, respectively. The j.p.d.f.s are presented in logarithmic scale to improve the presentation of the results. A similar analysis was also performed in Rostami et al. (Reference Rostami, Li and Kheirkhah2023) using 2-D measurements. Compared with these measurements, for a similar total number of droplets, the 3-D measurements yield a smaller number of droplets in the clusters. As such, the j.p.d.f.s of
 $V_{c}/\overline {V_{c}}$ and
 $\tilde {d}$ are scattered, especially at small mean bulk flow velocities. However, conclusions can be made for mean bulk flow velocities larger than
 $15.2\,\mathrm {m}\,\mathrm {s}^{-1}$. For these large mean bulk flow velocities, the results show that clusters with large volumes are occupied by droplets with a relatively small mean diameter and a small variability of their diameter. However, the clusters with relatively small volumes carry droplets with a broader range of diameters. This observation is consistent with the results obtained from the 2-D measurements reported in Rostami et al. (Reference Rostami, Li and Kheirkhah2023). However, those reported here extend the findings of Rostami et al. (Reference Rostami, Li and Kheirkhah2023) to larger Stokes numbers that are more relevant to engineering applications and using the 3-D measurements.
The logarithmic j.p.d.f.s of the normalized cluster volume and the mean diameter of the droplets residing within the clusters. Panels (a–h) correspond to test conditions with  $U_{b}=$ 6.1, 9.1, 12.2, 15.2, 18.2, 21.2, 24.3 and
 $27.3\,\mathrm {m}\,\mathrm {s}^{-1}$, respectively.

5. Concluding remarks
The joint droplets' and clusters' characteristics of large-Stokes-number dilute sprays interacting with turbulent swirling air flows were investigated experimentally. A flow apparatus, which facilitated the injection of water spray droplets in a swirling co-flow of air, was employed. The AIPI technique was used for measuring the 3-D position as well as the diameter of the spray droplets. Separate shadowgraphy measurements were performed to visualize the influence of background flow on the formation of spray droplets. The characteristics of the background turbulent flow were studied using a separate SPIV technique. For all test conditions, the water injection flow rate and the swirl number were fixed at about  $14\,{\rm gr}\,{\rm min}^{-1}$ and 0.4, respectively. All tested sprays were dilute, with volume fractions ranging from about
 $0.4\times 10^{-6}$ to
 $0.7\times 10^{-6}$. The mean diameter of the droplets varied from about
 $37\,\mathrm {\mu }{\rm m}$ to
 $57\,\mathrm {\mu }{\rm m}$, changing the Stokes number from about 34 to 142, which is relatively large compared with that of past investigations. The Taylor-length-scale-based Reynolds number varied from about 22 to 47, rendering our test conditions moderately turbulent compared with those of past studies.
The shadowgraphy images showed that the presence of the swirling flow significantly changed the spray formation dynamics as well as the breakup of relatively large droplets. Specifically, for mean bulk flow velocities larger than  $15.2\,\mathrm {m}\,\mathrm {s}^{-1}$, the (double) bag breakup of large droplets led to their atomization. It was shown that the Weber number for test conditions with a mean bulk flow velocity of
 $15.2\,\mathrm {m}\,\mathrm {s}^{-1}$ is about 12, which is the relevant critical Weber number for the occurrence of bag breakup. Analysis of the droplets diameter measured from the AIPI technique showed that, for mean bulk flow velocities smaller than
 $15.2\,\mathrm {m}\,\mathrm {s}^{-1}$, the p.d.f. of the droplet diameter featured a peak at about
 $51\,\mathrm {\mu }{\rm m}$. However, once the mean bulk flow velocity increased to values larger than
 $15.2\,\mathrm {m}\,\mathrm {s}^{-1}$, the above peak of the droplet diameter p.d.f. gradually disappeared. The cumulative distribution function of the droplet diameter and shadowgraphy images showed that the occurrence of the (double) bag breakup leads to the generation of a large number of droplets with diameters smaller than
 $51\,\mathrm {\mu }{\rm m}$, which smeared out the presence of the local maximum at this diameter and at large mean bulk flow velocities.
The spatial location of the droplets was used to obtain the 3-D Voronoï cells. The utilized 3-D diagnostic allowed for resolving the 3-D geometry of the clusters. It was shown that the droplets form elongated clusters. The p.d.f. of the cells' volumes normalized by their locally mean value was used to obtain the degree of clustering as well as the length scale of clusters and voids. The diameter of the droplets as well as the identified clusters in three dimensions were then used to obtained the joint characteristics. The results showed that, for relatively moderate values of the Taylor-length-scale-based Reynolds number, increasing the Stokes number plateaus the degree of clustering at about 0.4. The p.d.f.s of the cluster and void length scales featured a peak that is skewed towards small length scales. It was reported that increasing the mean bulk flow velocity from about 6.1 to  $27.3\,\mathrm {m}\,\mathrm {s}^{-1}$ decreased the most probable cluster and void length scales from about 5.5 to 4.5 mm and 10.1 to 8.7 mm, respectively. It was concluded that the variation of the mean cluster length scale normalized by the Kolmogorov length scale versus the Stokes number followed a power-law relation, with the exponent of the power law being 0.67. Compared with the normalized mean cluster length scale, the mean void length scale normalized by the integral length scale was nearly insensitive to the examined conditions and was about 1.5.
The results showed that, although the mean number density of the generated droplets featured a minimum at the mean bulk flow velocity of  $15.2\,\mathrm {m}\,\mathrm {s}^{-1}$, which was specific to the swirling flows and sprays used here, the ratio of the droplets number density residing within the clusters and voids followed trends comparable to our past study in which a turbulent jet co-flow was used. It was concluded that, for moderately turbulent co-flows and Stokes numbers smaller than about 20, the ratio of the number density of droplets residing within the clusters and voids to the mean number density of the droplets were about 5–6 and 0.7–0.9, respectively. Though increasing the Stokes number to about 140 did not change the ratio of the normalized mean number density of droplets residing within voids, this ratio for droplets residing within clusters increased to about 8. The j.p.d.f. of clusters volume normalized by the locally estimated mean value and the mean diameter of the droplets within the clusters showed that although clusters with a small volume were occupied by droplets with a broad range of diameters, large volume clusters accommodated droplets with a small variation in their diameters. Overall, the present study extends the findings of past particle-laden flow investigations performed for relatively small Stokes numbers and using 2-D measurement techniques to large Stokes numbers relevant to engineering applications using 3-D diagnostics.
Supplementary movies
Supplementary movies are available at https://doi.org/10.1017/jfm.2024.926.
Funding
The authors are grateful for the financial support from the University of British Columbia and Canada Foundation for Innovation.
Declaration of interests
The authors report no conflict of interest.
Appendix A. Estimation of the droplets centre discrepancy for AIPI
Past investigations that utilized 2-D interferometric measurements for droplet positioning (see, for example, Hardalupas et al. Reference Hardalupas, Sahu, Taylor and Zarogoulidis2010, Boddapati et al. Reference Boddapati, Manish and Sahu2020 and Rostami et al. Reference Rostami, Li and Kheirkhah2023) have shown that the centres of the imaged circles (corresponding to the droplets) do not match the true centres of the droplets and, as a result, a discrepancy exists in droplet centre identification. In previous investigations, such discrepancy was quantified and the true location of the droplets' centres were obtained. Similar to the 2-D measurements, here, it was confirmed that the centres of the imaged ellipses (obtained from the AIPI technique) are different from the true location of the droplets' centre, with details for obtaining the above centres discrepancies provided in the following.
First, a target plate that featured 1 mm diameter holes arranged in a rectangular pattern (spacing of 10 mm) was manufactured and positioned in the  $x$–
 $y$ plane shown in figure 3. Then, the camera (that was used for the AIPI technique, i.e. C1 in figure 2a) was positioned at several locations along the
 $z$-axis, the plate was illuminated with an LED backlight and the images of the target plate were captured, with a sample image corresponding to
 $z=-20$ mm shown in figure 21(a). As can be seen, the images of circular holes created on the target plate are tilted ellipses, and these ellipses do not entirely follow the rectangular arrangement of the circular holes. To obtain the mapping relation between the position of the ellipses centres (see the black circular data points in figure 21a) and the centre of the holes on the target plate, the centres of four adjacent ellipses were used to estimate the slope of the connecting lines (see
 $S_{1}$ and
 $S_{2}$ in figure 21a). These slopes were used to obtain the above mapping relation and quantify the centre discrepancies along the
 $x$ and
 $y$ directions, which are referred to as
 $\mathcal {D}_x$ and
 $\mathcal {D}_y$, respectively. The variations of
 $\mathcal {D}_x$ and
 $\mathcal {D}_y$ in the
 $x$–
 $y$ plane are shown in figures 21(b) and 21(c), respectively. The above experiment was performed for values of
 $z$ ranging from
 $-$25 mm to 25 mm and the values of the centre discrepancies were insensitive to
 $z$. The results in figure 21(b,c) show that the centre discrepancy is nearly zero at the centre of the region of interest and increases linearly towards the edges of this region with the maximum discrepancies being about 1.4 mm near the corners of this region. For each identified ellipse centre, the centre discrepancies in figure 21(b,c) were used to obtain the true location of the droplet's centre.
Panel (a) is the image of the target plate captured using the AIPI camera positioned at  $z=-20\,\mathrm {mm}$. Panels (b,c) present the spatial distribution of centre discrepancy along the
 $x$ and
 $y$ axes, respectively.

Appendix B. Calibration of the AIPI for droplet positioning and sizing
First, the procedure for obtaining the  $z$ location of the AIPI focal planes (
 $c-a$ and
 $c-b$) as well as the corresponding magnification ratios (
 $M_1$ and
 $M_2$) are elaborated. Then, the procedure for measuring the relation between the orientation of the fringe patterns (
 $\alpha$) and
 $z$ (see the blue circular data points in figure 4e) is discussed. A checkerboard target plate was prepared, see figure 22(a), printed and used to obtain the locations of the focal planes as well as the magnification ratios. To this end, the target plate was mounted on a translation stage that moved along the
 $z$-axis. Once the target plate was positioned at focal planes (1) and (2), its corresponding images were slanted lines, which are respectively parallel with the axis meridian and power meridian of the cylindrical lens CL2 in figure 2(a). The images of the target plate positioned at focal planes (1) and (2) are shown in figures 22(b) and 22(c), respectively. The distance between the two adjacent slanted lines in figures 22(a) and 22(b) were calculated, which were 0.745 and 0.765 mm, respectively. Here,
 $M_1$ and
 $M_2$ were obtained by dividing the above-measured distances by the actual distance, which was
 $\sqrt {2}$ mm. That is,
 $M_1 = 0.745/\sqrt {2} = 0.53$ and
 $M_2 = 0.765/\sqrt {2} = 0.54$.
Panel (a) is the checkerboard plate printed and used for the AIPI calibration. Panels (b,c) are the images of the checkerboard positioned at focal planes (1) and (2), respectively.

In order to assess the analytically obtained calibration relation in (3.1), which relates the depth of the droplets and the angle of the fringes, separate calibration experiments were performed. Specifically, the spherical lens (SL3) in figure 2 was removed, the distance between SL1 and SL2 was changed to produce a 1 mm thick laser sheet and the AIPI was performed for a planar illumination of the spray. This was conducted for several planes along the  $z$-axis by positioning the camera at several locations along this axis, with the sample collected fringe patterns shown in figure 23. The results in figure 23(a–d) are the cropped AIPI images and correspond to
 $z= -20$, 0, 10 and 20 mm, respectively. As can be seen, for a fixed value of
 $z$, the angles of the fringe patterns within an image do not change, since the illumination volume is thin (1 mm). Also, for droplets positioned at
 $z=10\,\mathrm {mm}$, no fringe patterns are formed, since these droplets are located at the focal plane. For each examined value of
 $z$, 500 images were collected, the angles for all imaged fringe patterns were obtained, and the variation of the mean angle versus
 $z$ was presented in figure 4(e), with the largest error bar being twice the largest standard deviation of
 $\alpha$ obtained from the calibration measurements. This was performed for all tested mean bulk flow velocities, and it was obtained that the relation between the
 $z$ location of the droplets versus
 $\alpha$ is independent of the tested mean bulk flow velocities.
Panels (a–d) are the representative cropped images obtained from AIPI for planar laser illumination at  $z=-20$, 0, 10 and 20 mm, respectively. The results correspond to a mean bulk flow velocity of
 $9.1\,\mathrm {m}\,\mathrm {s}^{-1}$.

Appendix C. Uncertainty in estimating the droplet location and its diameter
The uncertainty in calculating the droplet position along the  $z$-axis was estimated following Coleman & Steele (Reference Coleman and Steele2018), assuming
 $\alpha$,
 $c-b$ and
 $c-a$ are independent measurable variables. Specifically, the uncertainty in calculating the droplet location along the
 $z$-axis was estimated from
 \begin{equation} \delta z= \sqrt{\left[\frac{\partial z}{\partial \alpha}\delta \alpha\right]^{2}+\left[\frac{\partial z}{\partial (c-b)}\delta (c-b)\right]^{2}+\left[\frac{\partial z}{\partial (c-a)}\delta (c-a)\right]^{2}}, \end{equation}
with terms  ${\partial z}/{\partial \alpha }$,
 ${\partial z}/{\partial (c-b)}$ and
 ${\partial z}/{\partial (c-a)}$ being the sensitivities in measuring the
 $z$ location of the droplets with respect to the independent variables. Here,
 $\delta \alpha$ is the uncertainty in measuring the fringe orientation and was estimated to be
 $1^{\circ }$ using the imaging resolution,
 $\delta (c-b)$ and
 $\delta (c-a)$ are the uncertainties in measuring
 $c-b$ and
 $c-a$ that were about 1 mm. The variation of relative uncertainty in measuring the droplet location along the
 $z$-axis (
 $\delta z/z$) versus the fringe orientation was estimated using (C1), with the corresponding results presented in figure 24(a). As can be seen, the largest relative uncertainty is about 13 % and corresponds to droplets with
 $\alpha =0$ (i.e. droplets that are located at the focal plane
 $z=10$ mm).
Panel (a) is the variation of relative uncertainty in measuring the droplet  $z$ location versus the fringe angle. Panel (b) presents the variation of relative uncertainty in estimating the droplet diameter versus the fringe angle and fringe spatial spacing. Overlaid on (b) are the contours of the minimum measurable and most probable droplet diameter; see the white colour curves.

Following Coleman & Steele (Reference Coleman and Steele2018), (3.2) and (3.3) were used to estimate the uncertainty in measuring the droplet diameter ( $\delta d$) from AIPI that is given by
 \begin{equation} \delta d= \sqrt{\left[\frac{\partial d}{\partial \alpha}\delta \alpha\right]^{2}+\left[\frac{\partial d}{\partial s}\delta s\right]^{2}+\left[\frac{\partial d}{\partial \theta}\delta \theta\right]^{2}}, \end{equation}
where the terms  ${\partial d}/{\partial \alpha }$,
 ${\partial d}/{\partial s}$ and
 ${\partial d}/{\partial \theta }$ are the sensitivities of the droplet diameter with respect to the independently measured variables;
 $\delta \alpha = 1^{\circ }$,
 $\delta s=13\,\mathrm {\mu }{\rm m}$ and
 $\delta \theta = 1^{\circ }$ are the uncertainties in measuring
 $\alpha$,
 $s$ and
 $\theta$, respectively. The relative uncertainty in measuring the droplet diameter (
 $\delta d/d$) can be estimated using (C2) and is given by
 \begin{equation} \frac{\delta d}{d}= \sqrt{\left[\frac{\mathrm{d}F}{\mathrm{d}\alpha}\frac{1}{F}\delta \alpha\right]^{2}+\left[\frac{1}{s}\delta s\right]^{2}+\left[\frac{\mathrm{d}g}{\mathrm{d} \theta}\delta \theta\right]^{2}}, \end{equation}
with the formulation for  $F(\alpha )$ obtained by combining (3.3) and (3.1). In (C3),
 $g = 2\lambda _{{L}} F/(sd)$. In the present study,
 $\theta$ was unchanged and equals
 $70^{\circ }$. The relative uncertainty versus
 $\alpha$ and
 $s$ is presented in figure 24(b). The contours of the minimum measurable diameter from AIPI (
 $d_{min}=5\,\mathrm {\mu }\mathrm {m}$) and the most probable droplet diameter (
 $d=51\,\mathrm {\mu }\mathrm {m}$) are also overlaid on figure 24(b) using the white colour curves. The results in figure 24(b) show that the maximum relative uncertainty in reporting the most probable droplet diameter is about 27 %.
Appendix D. The validation ratio of the AIPI technique
To quantify the capability of the AIPI technique for sizing and locating droplets in dilute sprays, a parameter referred to as the validation ratio was estimated, which is the ratio of the droplets identified and used after the post processing of the interferometric images to the total number of droplets present in a raw AIPI image. A representative raw AIPI image corresponding to the test condition with  $U_{b}=15.2\,\mathrm {m}\,\mathrm {s}^{-1}$ is shown in figure 25(a). In the figure, the black dashed box highlights the ‘cropped’ region that was referenced in figure 4(a). As can be seen, the number of droplets in the volume of interest is
 $O(100)$. Interferometric images with significant overlaps can exist and are observed in figure 25(a). Such overlap leads to multiple and small amplitude peaks to appear in the 2-D FFT calculations of the AIPI. In the present study, the droplets with overlapping images were removed, with the removal criterion set based on the 2-D FFT of the interferometric images of the identified droplets featuring only two peaks. Applying this criterion, droplets with significant overlap were removed. Additionally, droplets larger than
 $200\,\mathrm {\mu }{\rm m}$ do not yield discernible peaks in the FFT; see, for example, the interferometric image near
 $x = -21.2$ mm and
 $y = 64.5$ mm in figure 25(a). Such droplets were removed as well. Finally, the retained and removed droplet interferometric images are shown using the solid black and red boxes, respectively (figure 25a). For a representative test condition of
 $U_{b}=15.2\,\mathrm {m}\,\mathrm {s}^{-1}$, the ratio of the number of retained droplets (
 $n_{AIPI}$) to the total number of droplets (
 $n_{T}$) was obtained, with the variation of this ratio versus the frame number shown in figure 25(b). This ratio (
 $n_{AIPI}/n_{T}$) is referred to as the validation ratio. For the above test condition, the mean value of
 $n_{AIPI}/n_{T}$ is about 0.65, which is shown using the dashed red line in figure 25(b). Thus, on an averaged basis, 35 % of the droplets in the volume of interest are removed. Similar results were obtained for the rest of the test conditions.
Panel (a) is a representative raw AIPI image. The solid black and red boxes show the retained and removed astigmatic interferometric images of droplets, respectively. Panel (b) is the validation ratio versus the frame number. The results in (a,b) correspond to the test condition with  $U_{b}=15.2\,\mathrm {m}\,\mathrm {s}^{-1}$.

Appendix E. The effect of sub-sampling of the droplets on clusters characteristics
Similar to Monchaux (Reference Monchaux2012), the effect of sub-sampling of the droplets on cluster analysis was studied. To this end, the droplets were randomly removed from the AIPI images and an auxiliary parameter ( $\beta$, which is the ratio of the number of droplets retained after randomly removing some droplets to
 $n_{AIPI}$) was estimated. That is,
 $\beta = 0$ means that all droplets are removed and
 $\beta = 1$ means that no droplet is removed from the processed AIPI images. Here,
 $\beta$ is referred to as the sub-sampling ratio and was varied from 0.2 to 1 with an increment of 0.1. In the following, the effect of such sub-sampling of the droplets on the degree of clustering, length scale of the clusters and the number density of the droplets within the clusters are discussed.
For a representative test condition of  $U_{b}=18.2\,\mathrm {m}\,\mathrm {s}^{-1}$, figure 26(a) presents the p.d.f. of the local Voronoï cells' volumes normalized by their local mean for various sub-sampling ratios using the coloured diamond symbol. As can be seen, for
 $V/\bar {V}\lesssim 0.58$ and
 $V/\bar {V}\gtrsim 1.90$, the p.d.f.s are sensitive to the sub-sampling ratio. To quantify such sensitivity, the variation of the degree of droplet clustering versus
 $\beta$ was obtained, with the results presented in figure 26(b). As can be seen, for
 $\beta > 0.4$, the degree of clustering increases with increasing
 $\beta$ and plateaus at 0.38. Similar results were obtained for the rest of the test conditions. Agreeing with the above, the results in Monchaux (Reference Monchaux2012) suggested that their degree of clustering also converged for sub-sampling ratios larger than 0.4 and concluded that the Voronoï analysis (which is also used in the present study) is robust to the removal of droplets for sufficiently large sub-sampling ratios.
(a) Probability density functions of the local Voronoï cells' volumes normalized by their local mean value for several sub-sampling ratios. (b) Variation of the degree of droplet clustering versus sub-sampling ratio. The results are presented for the representative test condition of  $U_{b}=18.2\,\mathrm {m}\,\mathrm {s}^{-1}$.

The variation of the mean cluster length ( $\overline {L_{c}}$) versus sub-sampling ratio was obtained, with the representative results pertaining to the test condition with
 $U_{b}=18.2\,\mathrm {m}\,\mathrm {s}^{-1}$ shown in figure 27. As can be seen, for
 $\beta \lesssim 0.4$, the estimated length scale decreases remarkably by increasing the sub-sampling ratio. However, for
 $0.8 \lesssim \beta \leq 1$, increasing this parameter decreases
 $\overline {L_{c}}$ less than 0.5 mm. Similar results were obtained for the rest of the test conditions.
The variation of the mean length scale of the clusters versus the sub-sampling ratio. The results pertain to the test condition with  $U_{b}=18.2\,\mathrm {m}\,\mathrm {s}^{-1}$.

The sensitivity of the number density of droplets residing within the clusters versus the sub-sampling ratio was studied. To this end, similar to the procedure discussed in § 4.4, the j.p.d.f. of the number of droplets that reside within the clusters and the volume of the clusters were obtained. It should be noted that performing the above j.p.d.f. analysis was not possible for  $\beta \leq 0.4$ due to the scarcity of the data. The results (not presented here for brevity) show that increasing the sub-sampling ratio increases the number density of the droplets within the clusters, which is anticipated. Additionally, for
 $\beta \geq 0.5$, the mean number density of the droplets (
 $\bar {M}$) was obtained, and the variation of
 $\bar {M}$ vs
 $\beta$ is presented in figure 28(a). To investigate the impact of the sub-sampling ratio on the relative number density of the clusters (
 $\bar {m}/\bar {M}$), the variation of this parameter versus
 $\beta$ is shown in figure 28(b). As can be seen,
 $\bar {m}/\bar {M}$ is nearly unchanged with varying
 $\beta$. This means that the sub-sampling of the droplets for
 $\beta \geq 0.5$ did not substantially influence the value of
 $\bar {m}/\bar {M}$ reported in the present study.
Panel (a) presents the variation of the mean number density of the droplets versus sub-sampling ratio. Panel (b) is the variation of the mean number density of droplets within the clusters divided by the mean global number density versus the sub-sampling ratio. The results pertain to the test condition with  $U_{b}=18.2\,\mathrm {m}\,\mathrm {s}^{-1}$.


 Open access

