Introduction
Endogenous opioids play an important role in processing sensory information such as pain (Akil et al., Reference Akil, Watson, Young, Lewis, Khachaturian and Walker1984; Pan et al., Reference Pan, Wu, Zhou, Chen, Zhang and Li2008), but only sporadic data suggest that endogenous opioids are present in the mammalian retina: enkephalin was detected in inner retinal neurons of guinea pigs (Altschuler et al., Reference Altschuler, Mosinger, Hoffman and Parakkal1982) and in rat retinal extract (Peng et al., Reference Peng, Huang, Lee, Chen and Ma2009), and we recently demonstrated the expression of β-endorphin in cholinergic amacrine cells in mouse (Gallagher et al., Reference Gallagher, Witkovsky, Roux, Low, Otero-Corchon, Hentges and Vigh2010). The three classes of opioid receptors do not show exclusive endogenous substrate specificity; however, β-endorphin binds preferentially to μ-opioid receptors (MORs), enkephalins to δ-opioid receptors (DORs), and dynorphins to κ-opioid receptors (Kieffer, Reference Kieffer1995). Of these three receptor classes, binding studies with [3H]dihydromorphine indicated autoradiographic labeling in the inner plexiform and ganglion cell layers (IPL and GCL, respectively), suggesting the presence of MORs and/or DORs in rat and monkey retinas (Wamsley et al., Reference Wamsley, Palacios and Kuhar1981). In rat retina, Peng et al. (Reference Peng, Huang, Lee, Chen and Ma2009) showed the presence of both MORs and DORs through real-time polymerase chain reaction (RT-PCR) and Western blot analysis, and MORs were also detected by immunohistochemistry on processes of bistratified ganglion cells (GCs) (Brecha et al., Reference Brecha, Johnson, Kui, Anton, Keith, Evans and Sternini1995).
In the mammalian retina, opioids regulate cell proliferation during development (Isayama & Zagon, Reference Isayama and Zagon1991), influence cell survival following hypoxic or ischemic challenge (Husain et al., Reference Husain, Potter and Crosson2009; Peng et al., Reference Peng, Huang, Lee, Chen and Ma2009; Riazi-Esfahani et al., Reference Riazi-Esfahani, Kiumehr, Asadi-Amoli and Dehpour2009), and regulate dopamine release via DOR and MOR activation (Dubocovich & Weiner, Reference Dubocovich and Weiner1983). As dopamine—released from dopaminergic amacrine cells (DACs)—exerts action in a paracrine fashion on most retinal cell types to promote adaptation to bright light conditions (Witkovsky, Reference Witkovsky2004), opioid regulation of dopamine release could have profound physiological consequences in the retinal circuitry.
The aim of this study was to investigate the presence and the location of opioid receptors in the mouse retina with immunohistochemical methods. Here, we show that MOR and DOR immunolabeling are associated with ganglion and GABAergic amacrine cells, including DACs. We propose that in the mouse retina, β-endorphin, released from cholinergic amacrine cells (Gallagher et al., Reference Gallagher, Witkovsky, Roux, Low, Otero-Corchon, Hentges and Vigh2010), acts on MORs (and perhaps DORs) relatively close to its release site in the inner retina and might affect visual processing by amacrine, and GCs, much like substance P (Brecha et al., Reference Brecha, Sternini, Anderson and Krause1989; Zalutsky & Miller, Reference Zalutsky and Miller1990). Specifically, the results of this study predict that in the mouse retina, endogenous opioids can exert their effect via direct action on MORs and DORs expressed by DACs and might modulate dopamine release.
Materials and methods
Animals
Adult male and female wild-type C57 and C57BL/6J mice, GAD67-EGFP transgenic mice (Tamamaki et al., Reference Tamamaki, Yanagawa, Tomioka, Miyazaki, Obata and Kaneko2003), and Sprague-Dawley dams were used for experimentation. Animals were handled in compliance with the Colorado State University Institutional Animal Care and Use Committee, and all procedures met U.S. Public Health Service Guidelines. All efforts were made to minimize the number of animals used and any possible discomfort. Mice were obtained from Jackson Laboratories, Bar Harbor, ME, and rats from Harlan Laboratories, Indianapolis, IN. Animals were kept on a 12-h light:12-h dark cycle with lights on at 6:00 AM, fed standard chow and water ad libitum.
Immunohistochemistry
Immunohistochemical procedures on retina, brain, and dorsal root ganglia (DRG) sections were conducted as previously described for retinal sections (Gallagher et al., Reference Gallagher, Witkovsky, Roux, Low, Otero-Corchon, Hentges and Vigh2010), except an antigen retrieval step (15 min in boiling 10 mM sodium citrate) followed by 0.5% sodium borohydride treatment for 45 min was included. Brain slices were prepared from anesthetized [i.p. 0.1–0.15 ml of 50 mg/ml Beuthanasia-D (Schering-Plough Animal Health, Summit, NJ)] mice transcardially perfused with 0.1 m phosphate buffer (PB) and 4% paraformaldehyde (PFA) in PB. After perfusion, brain was removed, postfixed for 1–2 h, cryoprotected, and sectioned (50 μm). Rats were anesthetized with isoflurane and euthanized via decapitation. DRGs were removed, fixed in 4% PFA, cryoprotected, and sectioned (20 μm).
Antibodies
Antibody raised against Brn-3a
This goat anti-Brn-3a antibody (C-20) was generated against a synthetic peptide corresponding to the N-terminus region of human Brn-3a (sc-31984; Santa Cruz Biotechnology, Santa Cruz, CA). Western blot analysis of rat retina lysate yielded a 48-kD band (Nadal-Nicolás et al., Reference Nadal-Nicolás, Jimenez-Lopez, Sobrado-Calvo, Nieto-Lopez, Canovas-Martinez, Salinas-Navarro, Vidal-Sanz and Agudo2009). In the mouse retina, this antibody has been used to exclusively label retinal GCs (Galindo-Romero et al., Reference Galindo-Romero, Aviles-Trigueros, Jimenez-Lopez, Valiente-Soriano, Salinas-Navarro, Nadal-Nicolas, Villegas-Perez, Vidal-Sanz and Agudo-Barriuso2011).
Antibodies raised against DORs
The first rabbit anti-DOR antibody was generated against a synthetic peptide corresponding to amino acids 2–18 (ELVPSARAELQSSPLVN) of the N-terminus of mouse DOR (AOR-014/AN-01: Alomone Labs, Jerusalem, Israel). Western blot analysis of rat cortex lysate showed bands representing receptor monomers (37–43 kD) and dimmers/oligomers (>75 kD), which were absent in experiments preincubated with control peptide (manufacturer’s specifications). This antibody was used in mouse DRG, showing immunolabeling of both large and small neurons, which was abolished via preadsorption with control peptide and absent in DOR knockout mice (Wang et al., Reference Wang, Zhao, Zhong, Li, Li, Wang, Lu, Zhang, He, Zheng, Wu, Hokfelt, Bao and Zhang2010).
The second polyclonal rabbit anti-DOR antibody (AB1560/LV1480422; Millipore, Billerica, MA) used in this study was raised against the N-terminus of mouse DOR (LVPSARAELQSSPLV). Western blot analysis of adult rat brain homogenate identified bands representing receptor monomers, dimmers, and possible oligomers, which were blocked with preadsorption in control peptide (Persson et al., Reference Persson, Thorlin and Eriksson2005). In rat, this antibody has been shown to label DOR+ and large, medium, and small neurons in DRG (Kabli & Cahill, Reference Kabli and Cahill2007). In our hands, this anti-DOR antibody showed similar and appropriate labeling in cryostat-sectioned rat DRG (data not shown).
Antibodies raised against MORs
The first rabbit anti-MOR antibody used in this study was generated against a peptide corresponding to amino acids 22–38 (CSPAPGSWLNLSHVDGN) of the extracellular N-terminus of rat MOR (100% homology with that of mouse) (AOR-011/AN-01: Alomone Labs, Jerusalem, Israel). Western blot analysis of rat hippocampus lysate showed a band of 55–60 kD (manufacturer’s specifications).
The second rabbit anti-MOR antibody (3675-1/H101201; Epitomics, Burlingame, CA) was raised against a synthetic peptide corresponding to amino acids 386–398 (LENLEAETAPLP) of the intracellular C-terminus of mouse MOR. Western blot analysis of mouse brain homogenates resulted in a broadband labeling of ∼70–80 kDa in wild type but not in knockout mouse preparations (Lupp et al., Reference Lupp, Richter, Doll, Nagel and Schulz2011). In our hands, this antibody showed similar immunolabeling in mouse hippocampus (data not shown) as seen in rat (Lupp et al., Reference Lupp, Richter, Doll, Nagel and Schulz2011).
Antibody raised against tyrosine hydroxylase
The mouse anti-tyrosine hydroxylase (TH) monoclonal antibody (MAB318/LV1556893: Millipore) was generated against TH purified from PC12 cells, and its characterization in mouse retina has been previously described (Gallagher et al., Reference Gallagher, Witkovsky, Roux, Low, Otero-Corchon, Hentges and Vigh2010).
Data from images
Confocal laser microscopy
Fluorescent images were taken with a Zeiss LSM 510 confocal microscope (Carl Ziess, Oberkochen, Germany). For all acquisitions, sequential scans at the different wavelengths were performed. Z-stack images through the full thickness of immunolabeled tissues were taken at 40×, 2–5 μm increments. Brightness and contrast of images were adjusted uniformly in Photoshop CS3 (Adobe 10.1). Images were compiled and analyzed using Zeiss LSM Image Examiner software (Carl Zeiss).
Quantification and data analysis
Compiled single-plane (“Z-stack”) images were used for subjective visual assessment of immunolabeling colocalization. Quantitative analysis of opioid receptor colocalization with TH immunolabeling was performed on single-plane confocal images through the center of TH+ cell bodies or processes (see dashed lines in Fig. 2C) using Image J software (NIH, Bethesda, MD). The JACoP plugin was used to calculate the Pearson’s coefficient (PC) ± s.e.m. (Bolte & Cardelières, Reference Bolte and Cordelières2006) using the Costes’ approach. PC provides an analysis of pixel intensity and location in a dual-channel image with values ranging from −1 to 1 (−1: negative correlation; 0: no correlation; 1: complete correlation) (Gonzalez & Wintz, Reference Gonzalez and Wintz1987). The Costes’ approach sets an automatic threshold level for both channels to eliminate inconsistent or irreproducible results. Furthermore, it provides a statistical probability for disrupting the level colocalization (PC) found on a given two-channel image by randomizing the pixels independently 1000 times. In practice, P > 95% indicates that a colocalization pattern is nonrandom (Costes et al., Reference Costes, Daelemans, Cho, Dobbin, Pavlakis and Lockett2004; Bolte & Cardelières, Reference Bolte and Cordelières2006).
Results
MORs in the mouse retina
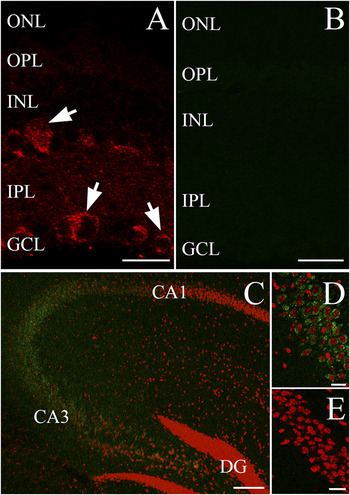
To assess the immunohistochemical labeling of MORs in the mouse retina, an antibody recognizing the N-terminus of MOR (Alomone) was tested on vertical cryostat sections. This antibody at 1:500 dilution produced punctate labeling in the inner retina, which was associated with somatic profiles in both the inner nuclear layer (INL) and GCL, but no immunolabeling was noted in the outer retina (arrows, Fig. 1A). MOR immunolabeling was completely abolished by preincubation of the antibody with its control peptide (1:10, antibody: control peptide—per manufacture’s guidelines) (Fig. 1B). Control experiments were performed on mouse brain coronal sections. MOR immunolabeling of hippocampal neurons corresponded nicely with previous reports in mouse (Kwon et al., Reference Kwon, Seo, Choi, Lee, Jung, Park and Suh2008) (Fig. 1C and 1D). Similar to the retina, preadsorption of the MOR antibody with its immunogenic peptide blocked the immunolabeling of hippocampal neurons (Fig. 1E).
Immunohistochemical localization of MORs in mouse retinal and hippocampal tissues. (A) 40× confocal single-plane image of vertical cryosectioned mouse retina showing immunolabeling with anti-MOR antibody directed against the N-terminus of MOR (Alomone). MOR+ puncta are observed in the inner retina with discernible cells labeled in the INL and GCL (arrows). (B) 40× image similar to (A) showing control peptide preadsorption for MOR antibody. (C) 10× confocal image of mouse brain slice focusing on the hippocampus. MOR antibody showing appropriate immunolabeling (green), colabeled with the nuclear marker ToPro3 (red). (D) 40× focused confocal image of the CA3 region of mouse hippocampus immunolabeled for MORs (green), colabeled with ToPro3 (red). (E) 40× image similar to (D) showing preadsorption of MOR antibody with control peptide, colabeled with ToPro3 (red). ONL: outer nuclear layer; OPL: outer plexiform layer; INL: inner nuclear layer; IPL: inner plexiform layer; GCL: ganglion cell layer; DG: dentate gyrus. Scale bars: (A), (B), (D), and (E): 20 μm, (C): 100 μm.

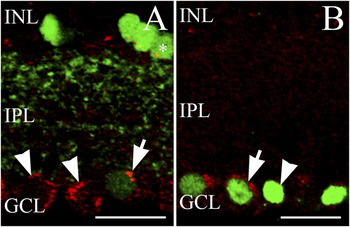
Some GCs and GABAergic amacrine cells are MOR+. (A) 40× single-plane merged image of vertically sectioned GAD67-EGFP mouse retina immunolabeled for MOR (red; Alomone). GAD67-EGFP somas are seen in the INL (bright green) and GCL (dim green) with processes in the IPL. Punctate MOR+ labeling of a displaced GABAergic amacrine cell is shown in the GCL (arrow). Some putative MOR+ somas in the GCL are GAD67-EGFP negative (arrowheads). In the INL, some GAD67-EGFP cells colabel MOR+ puncta that could indicate colocalization (asterisks). (B) 40× merged confocal image of cryosectioned wild-type mouse retina coimmunolabeled for MOR (red) and Brn-3a (green). Some Brn-3a+ retinal ganglion cells (arrow), but not all (arrowhead), are MOR+. INL: inner nuclear layer; IPL: inner plexiform layer; GCL: ganglion cell layer. Scale bars: 20 μm.

The GCL is comprised of GCs and displaced amacrine cells (Jeon et al., Reference Jeon, Strettoi and Masland1998; Kong et al., Reference Kong, Fish, Rockhill and Masland2005), whereas the INL is the most heterogeneous nuclear layer in the mouse retina containing horizontal, bipolar, amacrine, and Müller cell somas, with amacrines making up a large fraction (∼39%) of all the INL somata (Jeon et al., Reference Jeon, Strettoi and Masland1998). Due to the diverse size, morphology, and location of the MOR+ somas (Fig. 1A), it was likely that there are multiple types of MOR bearing cells in the inner retina. In a GAD67-EGFP knock-in mouse line, the presence of EGFP reliably marks GAD67-positive GABAergic neurons in the central nervous system (Tamamaki et al., Reference Tamamaki, Yanagawa, Tomioka, Miyazaki, Obata and Kaneko2003) including various GABAergic amacrine cells in the retina (May et al., Reference May, Nakamura, Fujiyama and Yanagawa2008). We found that MOR immunolabeling occasionally colocalized with the GAD67-EGFP signal in both the INL and GCL (Fig. 2A, asterisk and arrow, respectively). The presence of MOR+/GAD67-EGFP cells in the GCL (Fig. 2A, arrowheads) indicated that displaced amacrines lacking GAD67-EGFP and/or GCs express MORs as well. To further test this notion, colabeling studies were performed using a known GC marker, Brn-3a (1:200 dilution), which labels many but not all GCs in the mouse retina (Xiang et al., Reference Xiang, Zhou, Macke, Yoshioka, Hendry, Eddy, Shows and Nathans1995). We found several Brn-3a-labeled cell bodies in the GCL colocalize with MOR immunolabeling (Fig. 2B, arrow), but not all Brn-3a cells were colabeled with MOR (Fig. 2B, arrowhead).
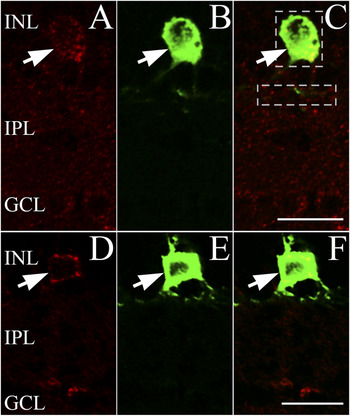
To evaluate whether DACs are also MOR+, a colabeling study was performed with the DAC marker anti-TH antibody (Witkovsky et al., Reference Witkovsky, Arango-Gonzalez, Haycock and Kohler2005). A representative image (Fig. 3A–3C) shows colocalization of MOR and TH immunolabeling in the INL (arrow). Visual evaluation of 124 TH+ DAC somas in retinal sections from nine different mice showed that 117 (>94%) were also MOR+.
Dopaminergic amacrines in the INL are MOR+. (A) 40× single-plane image of vertically sectioned mouse retina showing MOR+ (red) puncta in the INL (arrow) using the N-terminus directed MOR antibody (Alomone). (B) Image displaying the same retinal region as (A), immunolabeled for TH (green) showing a single TH+ cell (arrow) in the INL with TH+ projections in the IPL at the border with the INL. (C) A merged image of (A) and (B), displaying colocalization of the MOR+ and TH+ cell (arrow). (D) 40× confocal image, vertical section of mouse retina showing immunolabeled somata (red) in the INL (arrow) with the anti-MOR antibody directed against the C-terminus of the receptor (Epitomics). (E) Image illustrating the same region as in (D), showing a TH+ (green) soma in the INL (arrow). (F) A merged image of (D) and (E), indicating colocalization of MOR and TH immunolabeling. INL: inner nuclear layer; IPL: inner plexiform layer; GCL: ganglion cell layer. Dashed lines (C) demarcate example focused images used for colocalization analysis (see Materials and methods section). Scale bars: 20 μm.

A more objective test to assess whether MOR and TH immunolabeling precisely overlap is to calculate PC using Costes’ approach (see Materials and methods section). Analysis of five MOR/TH immunolabeled somata (see Fig. 3C dashed line for example of focused somatic colocalization analysis) from three animals gave an average PC of 0.603 ± 0.015; P = 100%. This PC indicates colocalization between TH and MOR and the P value proves that it is nonrandom. Similar analysis of three TH+ DAC somas that were deemed as MOR− by visual assessment was also performed. The results of this analysis (PC = 0.4 ± 0.094; P = 100%) suggest that our (subjective) visual assessment was too conservative and underestimated the colocalization percentage; based on these results, in the mouse retina, essentially, every (TH+) DAC soma was labeled with the MOR antibody directed against the N-terminus.
Processes from DACs form a distinct horizontal band at the border of the INL and IPL (Witkovsky et al., Reference Witkovsky, Arango-Gonzalez, Haycock and Kohler2005). Both visual assessment and quantitative analysis of colocalization were performed on five images focused on TH+ processes (see, e.g., Fig. 3C IPL dashed line) yielding little to no colocalization with MOR immunolabeling (PC = 0.062 ± 0.006).
Studies with a second anti-MOR antibody directed against the C-terminus of MOR (1:10 dilution) showed similar immunolabeling in the inner retina as was seen with the N-terminus directed MOR antibody (compare Fig. 3D with Figs. 1A and 3A). Additionally, this second MOR antibody provided consensus colabeling with TH (arrow, Fig. 3D–3F). We found >93% of TH+ somas were MOR+ by visual assessment (28/30, four mice), whereas no colocalization was noted in the IPL. Detailed statistical evaluation of colocalization was performed on five images focused on TH+ cell bodies from three animals resulted in a PC of 0.754 ± 0.025, with a P value of 100%, indicating a nonrandom colocalization between TH and MOR immunolabeling provided by the C-terminus antibody.
DORs in the mouse retina
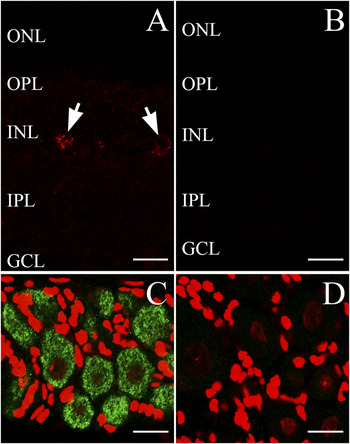
The physiological data in rabbit retina showed that DADLE reduces dopamine release (Dubocovich & Weiner, Reference Dubocovich and Weiner1983). DADLE, a synthetic enkephalin, is considered to be a DOR-selective agonist (Kosterlitz et al., Reference Kosterlitz, Lord, Paterson and Waterfield1980). Therefore, cryostat-sectioned mouse retinal tissue was labeled with an antibody directed against the N-terminus of DOR (Alomone). This antibody (1:500 dilution) provided punctate immunolabeling in the inner retina, with the strongest signal seen in the INL (arrows, Fig. 4A). Preadsorption of the antibody with its control peptide (1:10, antibody: control peptide—per manufacture’s guidelines) completely blocked labeling (Fig. 4B). Immunohistochemical studies of DOR distribution have been performed extensively in the rat DRG. In our hands, this anti-DOR antibody also labeled neurons within the rat DRG (Fig. 4C) consistent with published data (Kabli & Cahill, Reference Kabli and Cahill2007), which was completely abolished by preadsorption with its control peptide (Fig. 4D). Taken together, the DOR immunolabeling provided by the anti-DOR antibody from Alomone appeared to be specific both in the DRG and in the retina.
Localization of DOR immunolabeling in mouse retinal and rat DRG tissues. (A) 40× confocal image of cryosectioned mouse retina immunolabeled with an anti-DOR antibody (Alomone). Note the puncta in the inner retina with putative somatic labeling in the INL (arrows). (B) 40× image similar to (A) showing control peptide preadsorption for DOR (Alomone) antibody. (C) 40× confocal image of rat DRG with DOR+ somas (green). Colabled with the nuclear marker ToPro3 (red). (D) 40× image similar (C) showing preadsorption of DOR antibody with control peptide, colabeled with ToPro3 (red). ONL: outer nuclear layer; OPL: outer plexiform layer; INL: inner nuclear layer; IPL: inner plexiform layer; GCL: ganglion cell layer. Scale bars: 20 μm.

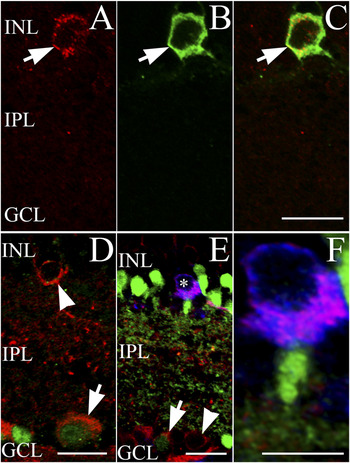
Colabeling studies with anti-TH antibody indicated that one of the DOR+ retinal cell types is the DAC (Fig. 5A–5C, arrow). Of 36 TH+ DAC somata analyzed from retinal sections of three mice, 35 (>97%) were judged to be DOR+ by visual assessment. Detailed colocalization analysis of five TH/DOR-labeled cells from three animals resulted in a PC of 0.699 ± 0.052 and a P value of 100%. These values indicate a strong and nonrandom somatic colocalization of DOR and TH immunolabeling in mouse retina.
Multiple inner retinal cell types including dopaminergic amacrines are DOR+. (A) 40× single-plane confocal image, vertical section of mouse retina showing DOR+ (red; Alomone) somata (arrow). (B) Image displaying the same region as (A), immunolabeled for TH (green). (C) A merged image of (A) and (B), showing a DOR+ and TH+ amacrine cell in the INL (arrow). (D) 40× single-plane merged confocal image of vertically sectioned wild-type mouse retina coimmunolabeled for DOR (red; Millipore) and Brn-3a (green). Some Brn-3a+ retinal GCs are MOR+ (arrow). Arrowhead indicating a putative DOR+ soma in the INL. (E) A 40× single-plane merged confocal image of cryosectioned GAD67-EGFP mouse retina coimmunolabeled for DOR (red; Millipore) and TH (blue). GAD67-EGFP somas are seen in the INL (bright green) and GCL (dim green) with processes in the IPL. A GABAergic (EGFP+) displaced amacrine cell in the GCL is DOR+ (arrow). Some putative DOR+ somas in the GCL are GAD67-EGFP negative (arrowhead). In the INL, a TH+ soma (blue) is DOR+ (asterisks). (F) Focused view of DAC from (E) showing that the TH+ soma is EGFP− and DOR+. INL: inner nuclear layer; IPL: inner plexiform layer; GCL: ganglion cell layer. Scale bars: (C), (D), and (F): 20 μm, (E): 10 μm.

Analysis of DOR and TH immunolabeling colocalization was also performed for TH+ processes. By visual assessment, no colocalization was detected within the IPL. Computer-based analysis of five images focused on TH+ processes in the IPL from three mice gave a PC of −0.058 ± 0.018. Although negative, the near-zero PC implied noncolocalization of TH and DOR immunolabeling in the mouse IPL—suggesting that DOR labeling was limited to DAC somas.
Similar results were obtained by using a second anti-DOR antibody from Millipore. This DOR antibody (1:500 to 1:600 dilution) labeled robustly within the inner retina, including somatic labeling within the INL (Fig. 5D, arrowhead) and Brn-3a+ GC somas in the GCL (Fig. 5D, arrow). Colabeling studies with DOR and TH antibodies in retinal sections made from GAD67-EGFP mice showed corresponding colocalization of DOR and TH (Fig. 5E–5F). Note that the GAD67-EGFP signal does not colocalize with TH, consistent with the notion that DACs might use GAD65 to generate GABA (May et al., Reference May, Nakamura, Fujiyama and Yanagawa2008; Witkovsky et al., Reference Witkovsky, Gabriel and Krizaj2008). Of 62 TH+ cell bodies from six mice >93% (58/62) were also deemed DOR+ by visual assessment. Detailed statistical evaluation of colocalization was performed on five images focused on TH+ cell bodies from five animals and resulted in a PC of 0.767 ± 0.032 and a P value of 100%, confirming that the labeling pattern produced by second anti-DOR antibody also colocalized with that of anti-TH antibody, in a nonrandom manner. Although not investigated further in the current study, it is important to note the presence of DOR+ GAD67-EGFP+ displaced amacrine cells (Fig. 5E, arrow) in the mouse retina.
Discussion
In the current study, we demonstrate MOR immunolabeling in the mouse retina, for the first time showing strong somatic labeling in the INL and GCL (Fig. 1A). Although systematic classification of all MOR+ somas was not attempted in this study, our data indicate that in the mouse retina, a subpopulation of Brn-3a+ GCs (Fig. 2B), GAD67+ GABAergic ACs (Fig. 2A), and DACs express MORs (Fig. 3). Similarly, DOR immunolabeling in the mouse retina implicated multiple DOR+ inner retinal cell types (Fig. 4A), including Brn-3a+ GCs (Fig. 5D) and GAD67-expressing GABAergic amacrines (Fig. 5E). Importantly, our data confirm that DACs are DOR+ (Fig. 5A–5C and 5E–5F).
TH+ dopaminergic processes showed neither MOR nor DOR immounolabeling. This labeling pattern is not unprecedented: natriuretic peptide receptor labeling was also associated primarily with the somatic region of DACs (Abdelalim & Tooyama, Reference Abdelalim and Tooyama2010). Nonetheless, it is not known whether the somatic punctate labeling is associated with functional neuropeptide receptors in the plasma membrane or with newly synthesized receptor protein in the cytoplasm.
The majority of opioid receptor activity is mediated through the Go-/Gi-coupled superfamily of receptors, and the cellular effects include: (1) activation of inwardly rectifying potassium current; (2) inhibition of voltage-gated calcium current; and (3) inhibition of adenylate cyclase, depending on the actual cell type (Kieffer, Reference Kieffer1995). Consequently, opioid receptor activation is generally believed to be inhibitory at cellular level—often expressed as a reduction of transmitter release from neurons possessing opioid receptors, such as reduction of dopamine release in the striatum (Loh et al., Reference Loh, Brase, Sampathkhanna, Mar, Way and Li1976).
Morgan and Boelen (Reference Morgan and Boelen1996) proposed an intercellular feedback loop in the avian retina formed by the endogenous opioid system and DACs that mediate dark light switch. Considering that besides birds (Su & Watt, Reference Su and Watt1987), retinal dopamine release is reduced by opioids in multiple species (turtle: Kolbinger & Weiler, Reference Kolbinger and Weiler1993; rabbit: Dubocovich & Weiner, Reference Dubocovich and Weiner1983); this model might be more generally applicable to vertebrate retinas. Here, MOR and DOR immunolabeling were found to be associated with (TH+) DACs in the mouse retina, which predicts that opioids modulate the function of DACs directly, via MORs and DORs located on DACs and might influence dopamine release as in other species.
Whether these opioid receptors are coexpressed in any other retinal cell type besides DACs require further study. However, in other parts of the mammalian nervous system, in cell types that coexpress MOR and DOR, MOR/DOR heteromerization has been shown to modulate signaling (Gomes et al., Reference Gomes, Gupta, Filipovska, Szeto, Pintar and Devi2004; Rozenfeld & Devi, Reference Rozenfeld and Devi2011). Besides DACs, we found that MOR and DOR immunolabeling were associated with a heterogeneous cell population in the inner retina including GABAergic displaced amacrine cells and GCs. These findings suggest that opioids might affect retinal function at multiple sites of action, thus, our work adds to a framework on which future histological and physiological characterizations can occur.
Acknowledgments
We wish to thank Dr. Leslie M. Stone, Dr. Shane T. Hentges, Dr. Michael M. Tamkun, Dr. Mina B. Pantcheva, Sara H. Monahan, Connie M. King, and Imelda Ontoria for their assistance in the completion of this study. The authors also thank Dr. Paul Witkovsky for helping the project with valuable discussions and Ryan E. Tooker for critical reading of the manuscript. This work was supported by a grant from NIH R01 EY019051 (J.V.).