


Introduction
Ice-sheet research over the last two decades has particularly focused on the dynamics of ice streams (e.g. Reference BennettBennett, 2003) and their role in the behaviour and stability of ice sheets (Reference HughesHughes, 1998). In particular, recent estimates of balance velocity fields over the Antarctic and Greenland ice sheets by means of synthetic aperture radar revealed a more complex picture of ice-sheet flow than previously envisaged (Reference Bamber, Vaughan and JoughinBamber and others, 2000; Reference Rémy, Legrésy and TestutRémy and others, 2001). These studies showed that flow within the grounded parts of these ice sheets is largely dominated by the interplay between narrow zones of enhanced flow, i.e. streaming flow, and wider zones of markedly slower ice, i.e. sheet flow, forming a remarkable large-scale dendritic pattern. In addition, ice-stream paths could be traced deep into the interior of ice sheets along continuous flowlines, with lateral transitions between sheet and streaming flow being generally abrupt near ice-sheet margins and progressively smoother towards the onsets, where the border between flow types becomes indistinct.
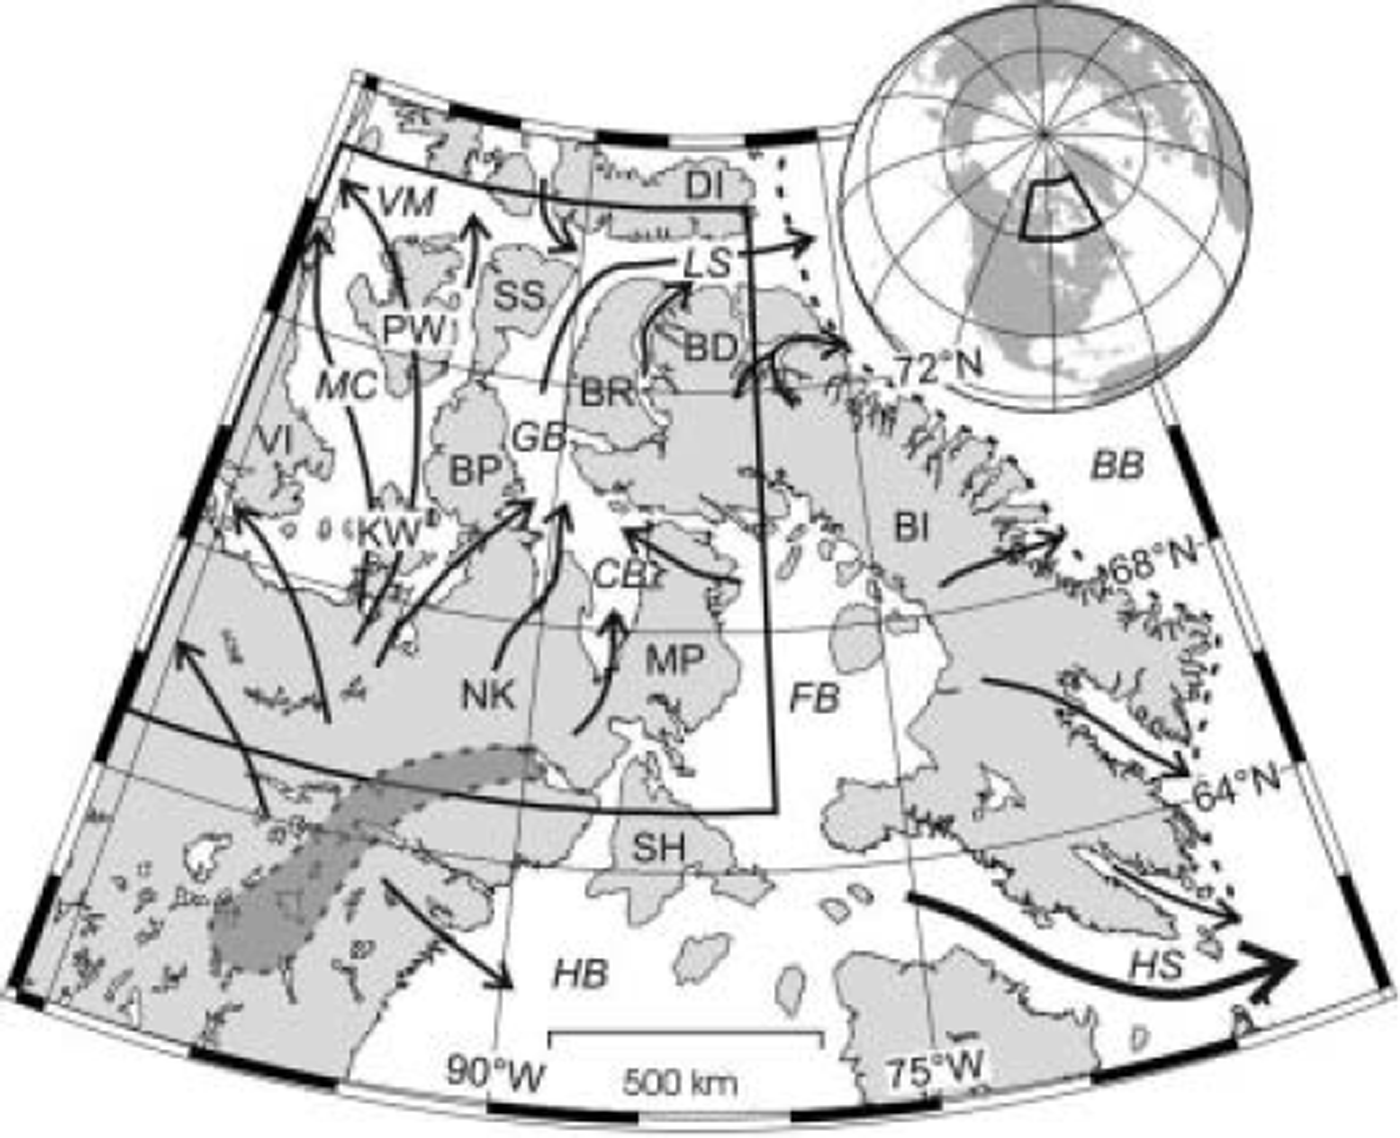
The wealth of new evidence on contemporary ice-stream patterns offers a solid background for the interpretation of inferred flow patterns of ancient ice sheets. In fact, recent reconstructions of the Fennoscandian ice sheet (FIS; Reference Boulton, Hagdorn and HultonBoulton and others, 2003) and parts of the Laurentide ice sheet (LIS; Reference Clark, Knight and GrayClark and others, 2000; Reference Kleman, Fastook and StroevenKleman and others, 2002) showed flow patterns that are comparable to those in modern glacier systems, including fast flow emanating from the deep ice-sheet interiors. Furthermore, considering the increasing ability of thermomechanical models to reproduce streaming flow (Reference Marshall, Clarke, Dyke and FisherMarshall and others, 1996; Reference Takeda, Cox and PayneTakeda and others, 2002), deciphering the location, extent and temporal relationships of ancient ice streams becomes a key issue for model validation and palaeo-ice-sheet research (Reference Stokes and ClarkStokes and Clark, 2001). This paper describes mapping of palaeo-ice streams by means of remote sensing on the northern Keewatin and Boothia Peninsula region, Nunavut, Canada (Fig. 1). The aim was to produce a comprehensive palaeo-ice-stream map of this area formerly covered by the northernmost Keewatin sector of the LIS, which has been previously poorly constrained in terms of palaeo-ice-stream dynamics.
Map of northeastern Canadian Arctic showing study area (black box). The arrows indicate the main ice export routes (from Reference Dyke and PrestDyke and Prest, 1987; Reference HughesHughes, 1998), the dotted line the Last Glacial Maximum ice margin (Reference Dyke, Moore and RobertsonDyke and others, 2003) and the grey area the Keewatin ice-divide zone (Reference Aylsworth and ShiltsAylsworth and Shilts, 1989). Abbrevations: BB: Baffin Bay; BD: Borden Peninsula; BI: Baffin Island; BP: Boothia Peninsula; BR: Brodeur Peninsula; CB: Committee Bay; DI: Devon Island; FB: Foxe basin; GB: Gulf of Boothia; HB: Hudson Bay; HS: Hudson Strait; KW: King William Island; LS: Lancaster Sound; MC: M’Clintock Channel; MP: Melville Peninsula; NK: northern Keewatin; PW: Prince of Wales Island; SH: Southampton Island; SS: Somerset Island; VI: Victoria Island; and VM: Viscount Melville Sound.
Study Area
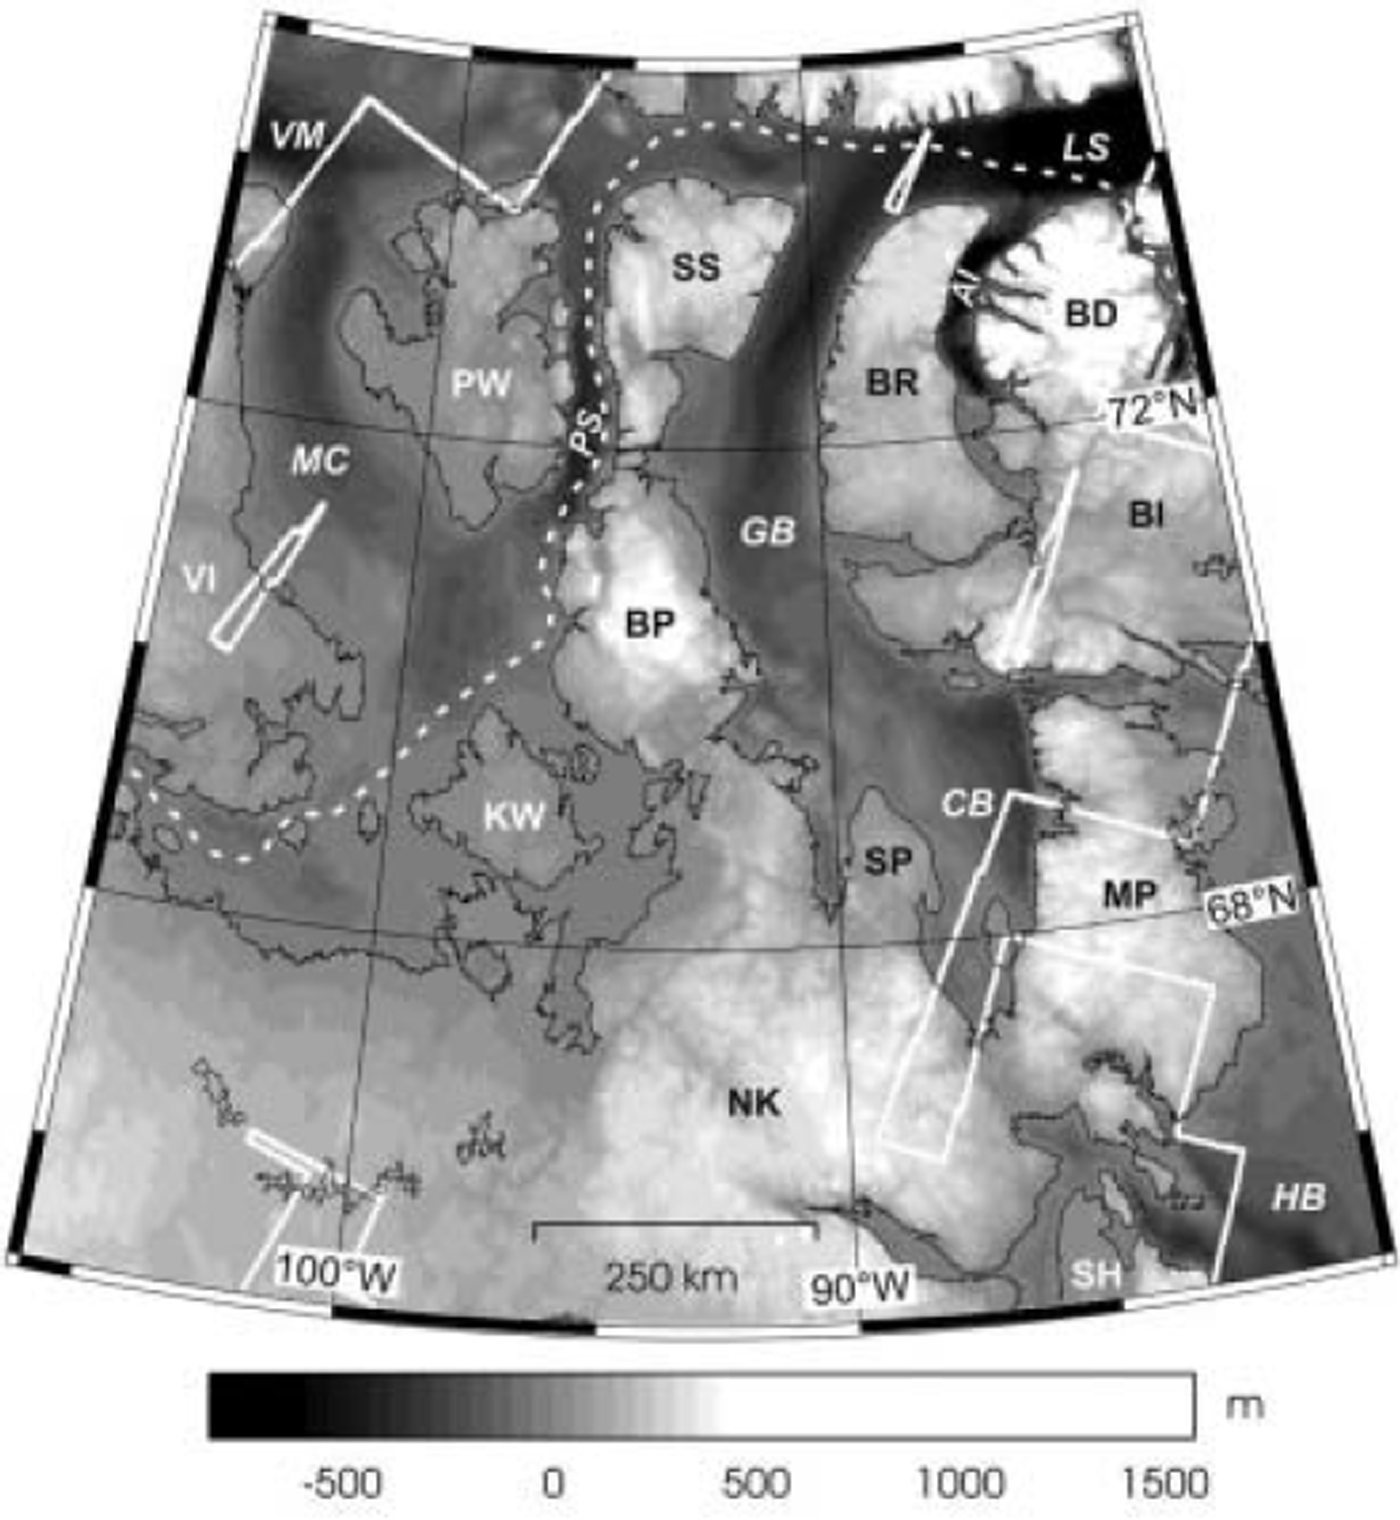
The region selected for this study is bounded by the parallels 65˚ N and 75˚ N and the meridians 106˚W and 80˚ W, having an area of 1.27 × 10⁶ km2 (Figs 1 and 2). In terms of topographic controls for ice streams, two physiographically distinct sectors can be recognized, with the division between the two approximating a line from northern Victoria Island to Southampton Island (Fig. 2). To the southwest of this line, relief is generally low, whereas to the northeast the terrain is divided into topographically distinct blocks on the 100-200 km scale. Prominent troughs like Peel Sound, the Gulf of Boothia, Admiralty Inlet and Lancaster Sound separate islands and peninsulas (Somerset Island and Borden, Brodeur, Melville and Boothia Peninsulas) (Fig. 2). Bedrock is composed of Precambrian crystalline rocks and early Palaeozoic carbonates (Reference DykeDyke, 1984). Regional geomorphology is dominated by landscapes of areal scouring, especially over northern Keewatin and southern Boothia Peninsula. Landscapes of little or no glacial erosion occur on Somerset Island, northern Baffin Island and northern Boothia and Melville Peninsulas. In these areas, highly developed pre-Quaternary fluvial landscapes were preserved under cold-based ice (Reference DykeDyke, 1983; Reference Kleman and HättestrandKleman and Hattestrand, 1999; Fig. 3b). In general, till cover in the region is discontinuous and thin (Reference DykeDyke, 1984), but bears a variety of directional landforms including highly attenuated drumlins, flutes and mega-scale glacial lineations (Reference ClarkClark, 1993). Eskers, sometimes >100km long, outwash terraces, ribbed moraine and crag-and-tails are also widespread (Reference Aylsworth and ShiltsAylsworth and Shilts, 1989). Except for Devon Ice Cap and several smaller glaciers on northern Baffin Island, the region is presently devoid of perennial ice cover. Vegetation is entirely lacking or extremely sparse. Postglacial modification by coastal and permafrost processes is locally severe, but landforms are generally well preserved, facilitating the reconstruction of former ice-flow patterns.
Digital elevation model of the study area indicating coverage by Landsat 7 ETM+ imagery (white polygons) and track of the Northwest Passage Transit 2003 multibeam sonar survey of the Ocean Mapping Group, University of New Brunswick, Canada (dashed line). Abbrevations as in Figure 1, with the additions of: SP: Simpson Peninsula; PS: Peel Sound; and AI: Admiralty Inlet.
According to several reconstructions of the LIS (Reference Dyke and PrestDyke and Prest, 1987; Reference HughesHughes, 1998; Reference Kleman, Fastook and StroevenKleman and others, 2002), regional ice flow proceeded roughly northward from the Keewatin ice dispersal centre and, north of Somerset Island, diverged to the Arctic Ocean via the Viscount Melville Sound and to Baffin Bay through the Lancaster Sound (Fig. 1). The eastern parts of the region were also affected by westward flow from a spreading centre over the Foxe basin, the Foxe sector, overriding the Melville Peninsula and pouring ice into the Gulf of Boothia-Lancaster Sound trough (Fig. 2). Palaeo-ice streams have been previously identified on the Boothia Peninsula (Reference DykeDyke, 1984), Prince of Wales Island (Reference Dyke and MorrisDyke and Morris, 1988), the Melville Peninsula (Reference DredgeDredge, 2000), M’Clintock Channel (Reference Clark and StokesClark and Stokes, 2001) and western Keewatin (Reference Stokes and ClarkStokes and Clark, 2003).
Materials and Methods
Geomorphological mapping was performed through the interpretation of Landsat 7 Enhanced Thematic Mapper Plus (ETM+) data. The panchromatic band (band 8; 0.52-0.90 μm) was selected due to its high resolution (15 m pixel size). We used a total of 51 scenes, covering an area of 1.06 × 10⁶ km2. These were downloaded from the GeoGratis website (http://geogratis.cgdi.gc.ca/clf/en) maintained by Natural Resources Canada. All images were georeferenced to the corresponding Universal Transverse Mercator zones, referred to the North American Datum 1983 (NAD83), by using the accompanying meta-information file and a nearest-neighbour resampling method.
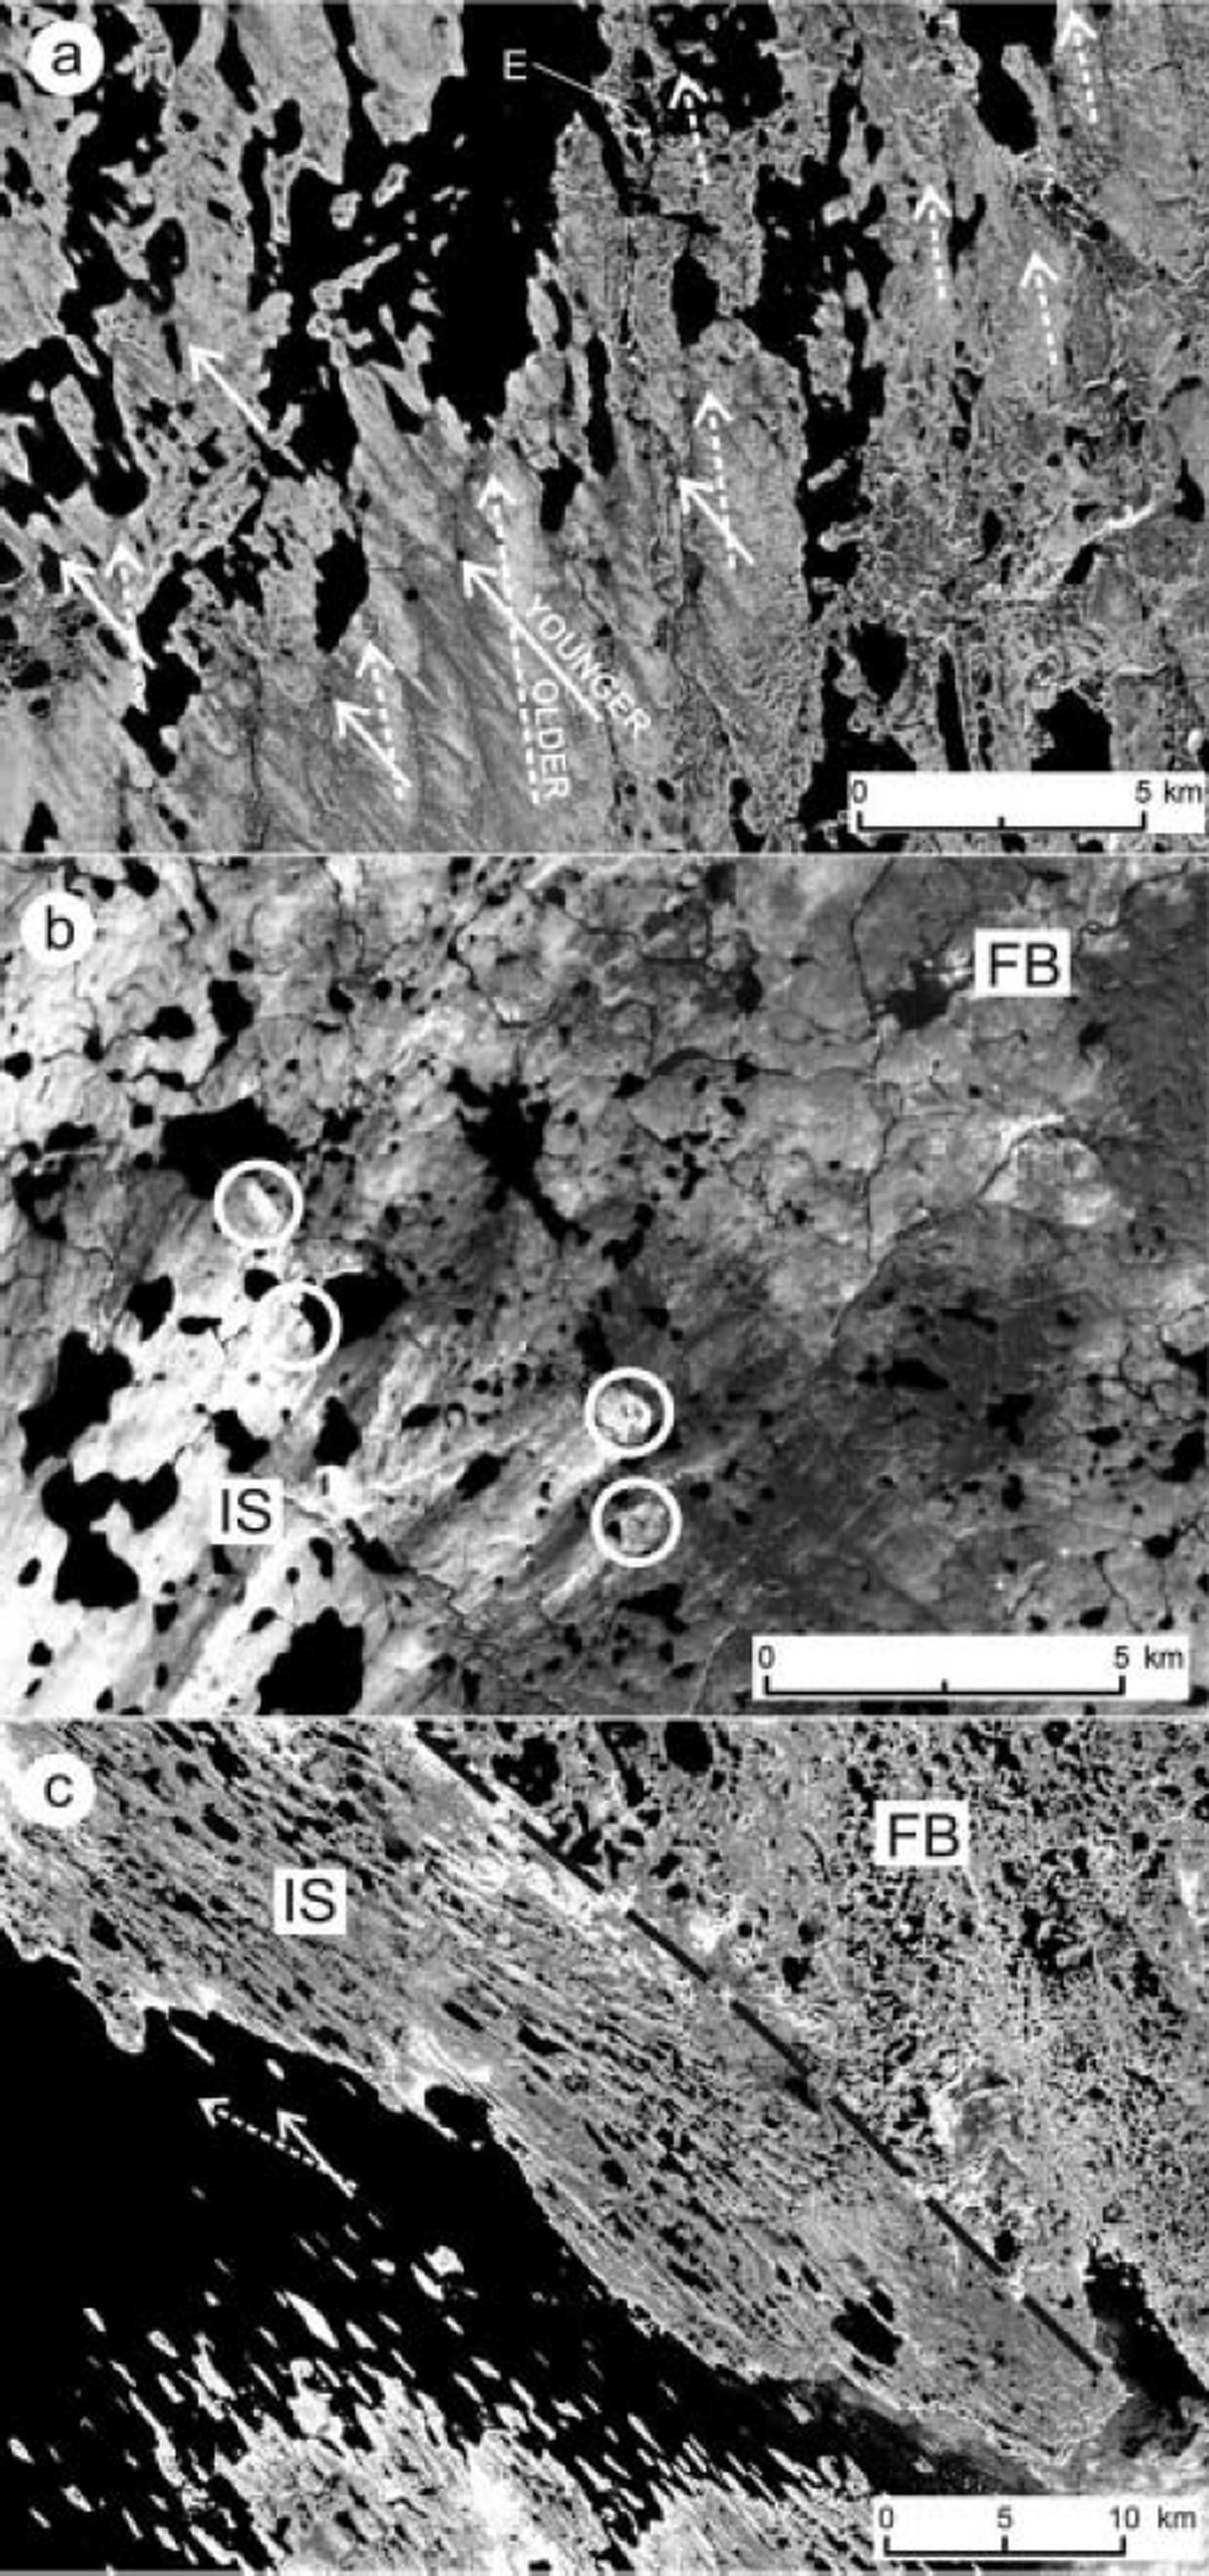
Mapping was performed on individual images by manual digitization of landforms into vector layers within a Geographic Information System. We mapped three groups of features: (i) landforms indicative of ice-flow direction (Fig. 3a): flutes, drumlins, mega-scale glacial lineations, streamlined bedrock and crag-and-tails; (ii) landforms indicative of ice-marginal position: moraines and outwash plains; and (iii) landforms indicative of wet-based deglaciation: eskers (Fig. 3a). We also mapped carbonate dispersal plumes because they are useful indicators of palaeo-ice flow direction (Fig. 3b). These plumes are formed by the downstream transport and deposition of light-coloured Palaeozoic carbonate debris that becomes highly visible due to its contrast against the darker granitic till (Reference DredgeDredge, 2000).
(a) Section of Landsat 7 ETM+ (path/row 037/014, 27 July 2001) panchromatic band showing cross-cutting relation between two lineation systems of different age in northern Keewatin and an esker (E). Younger drumlins (full arrows) superimpose and partially modify the older ones (dashed arrows). Image centre is approximately at 65˚13’ N, 98˚05’ W. (b) Section of Landsat 7 ETM+ (path/ row 036/009, 2 August 2000) panchromatic band showing carbonate erratic plumes (white circles) at the onset of an ice stream on the Brodeur Peninsula, Baffin Island. The ice stream (IS) flowed southwestwards draining a frozen-bed area (FB). Note the preglacial fluvial network on the palaeo-frozen bed zone. Image centre is approximately at 71˚36’ N, 87˚11’ W. (c) Section of Landsat 7 ETM+ (path/row 040/012, 29 July 2000) panchromatic band showing a palaeo-ice-stream margin on King William Island. The black dashed line indicates the position of the shear margin moraine that separates the former frozen-bed area (FB) from the ice stream (IS). Two ice palaeo-flow directions are recognized, with the dashed arrow indicating the older one. Image centre is approximately at 68˚39’ N, 97˚34’ W.
In practice, it is difficult to map all existent directional landforms because of the extreme expense of time required and because data reduction is necessary before interpretation. Therefore, we adopted the generic mapping principle of representativity: mapping was undertaken with the objective of achieving a good representation of the flow patterns, so any line on the map may represent a small group of nearby real landforms having similar direction. Mapping of directional landforms in the 0.21 × 10⁶km2 not covered by satellite imagery was completed using two different data sources. For terrestrial areas we extracted features from the Glacial Map of Canada (Reference Prest, Grant and RamptonPrest and others, 1968), whereas for some submerged areas we used the track of the Northwest Passage Transit 2003 multibeam sonar survey made by the Ocean Mapping Group, University of New Brunswick, Canada (http://chamcook.omg.unb.ca/∼arcticnet/) (Fig. 2).
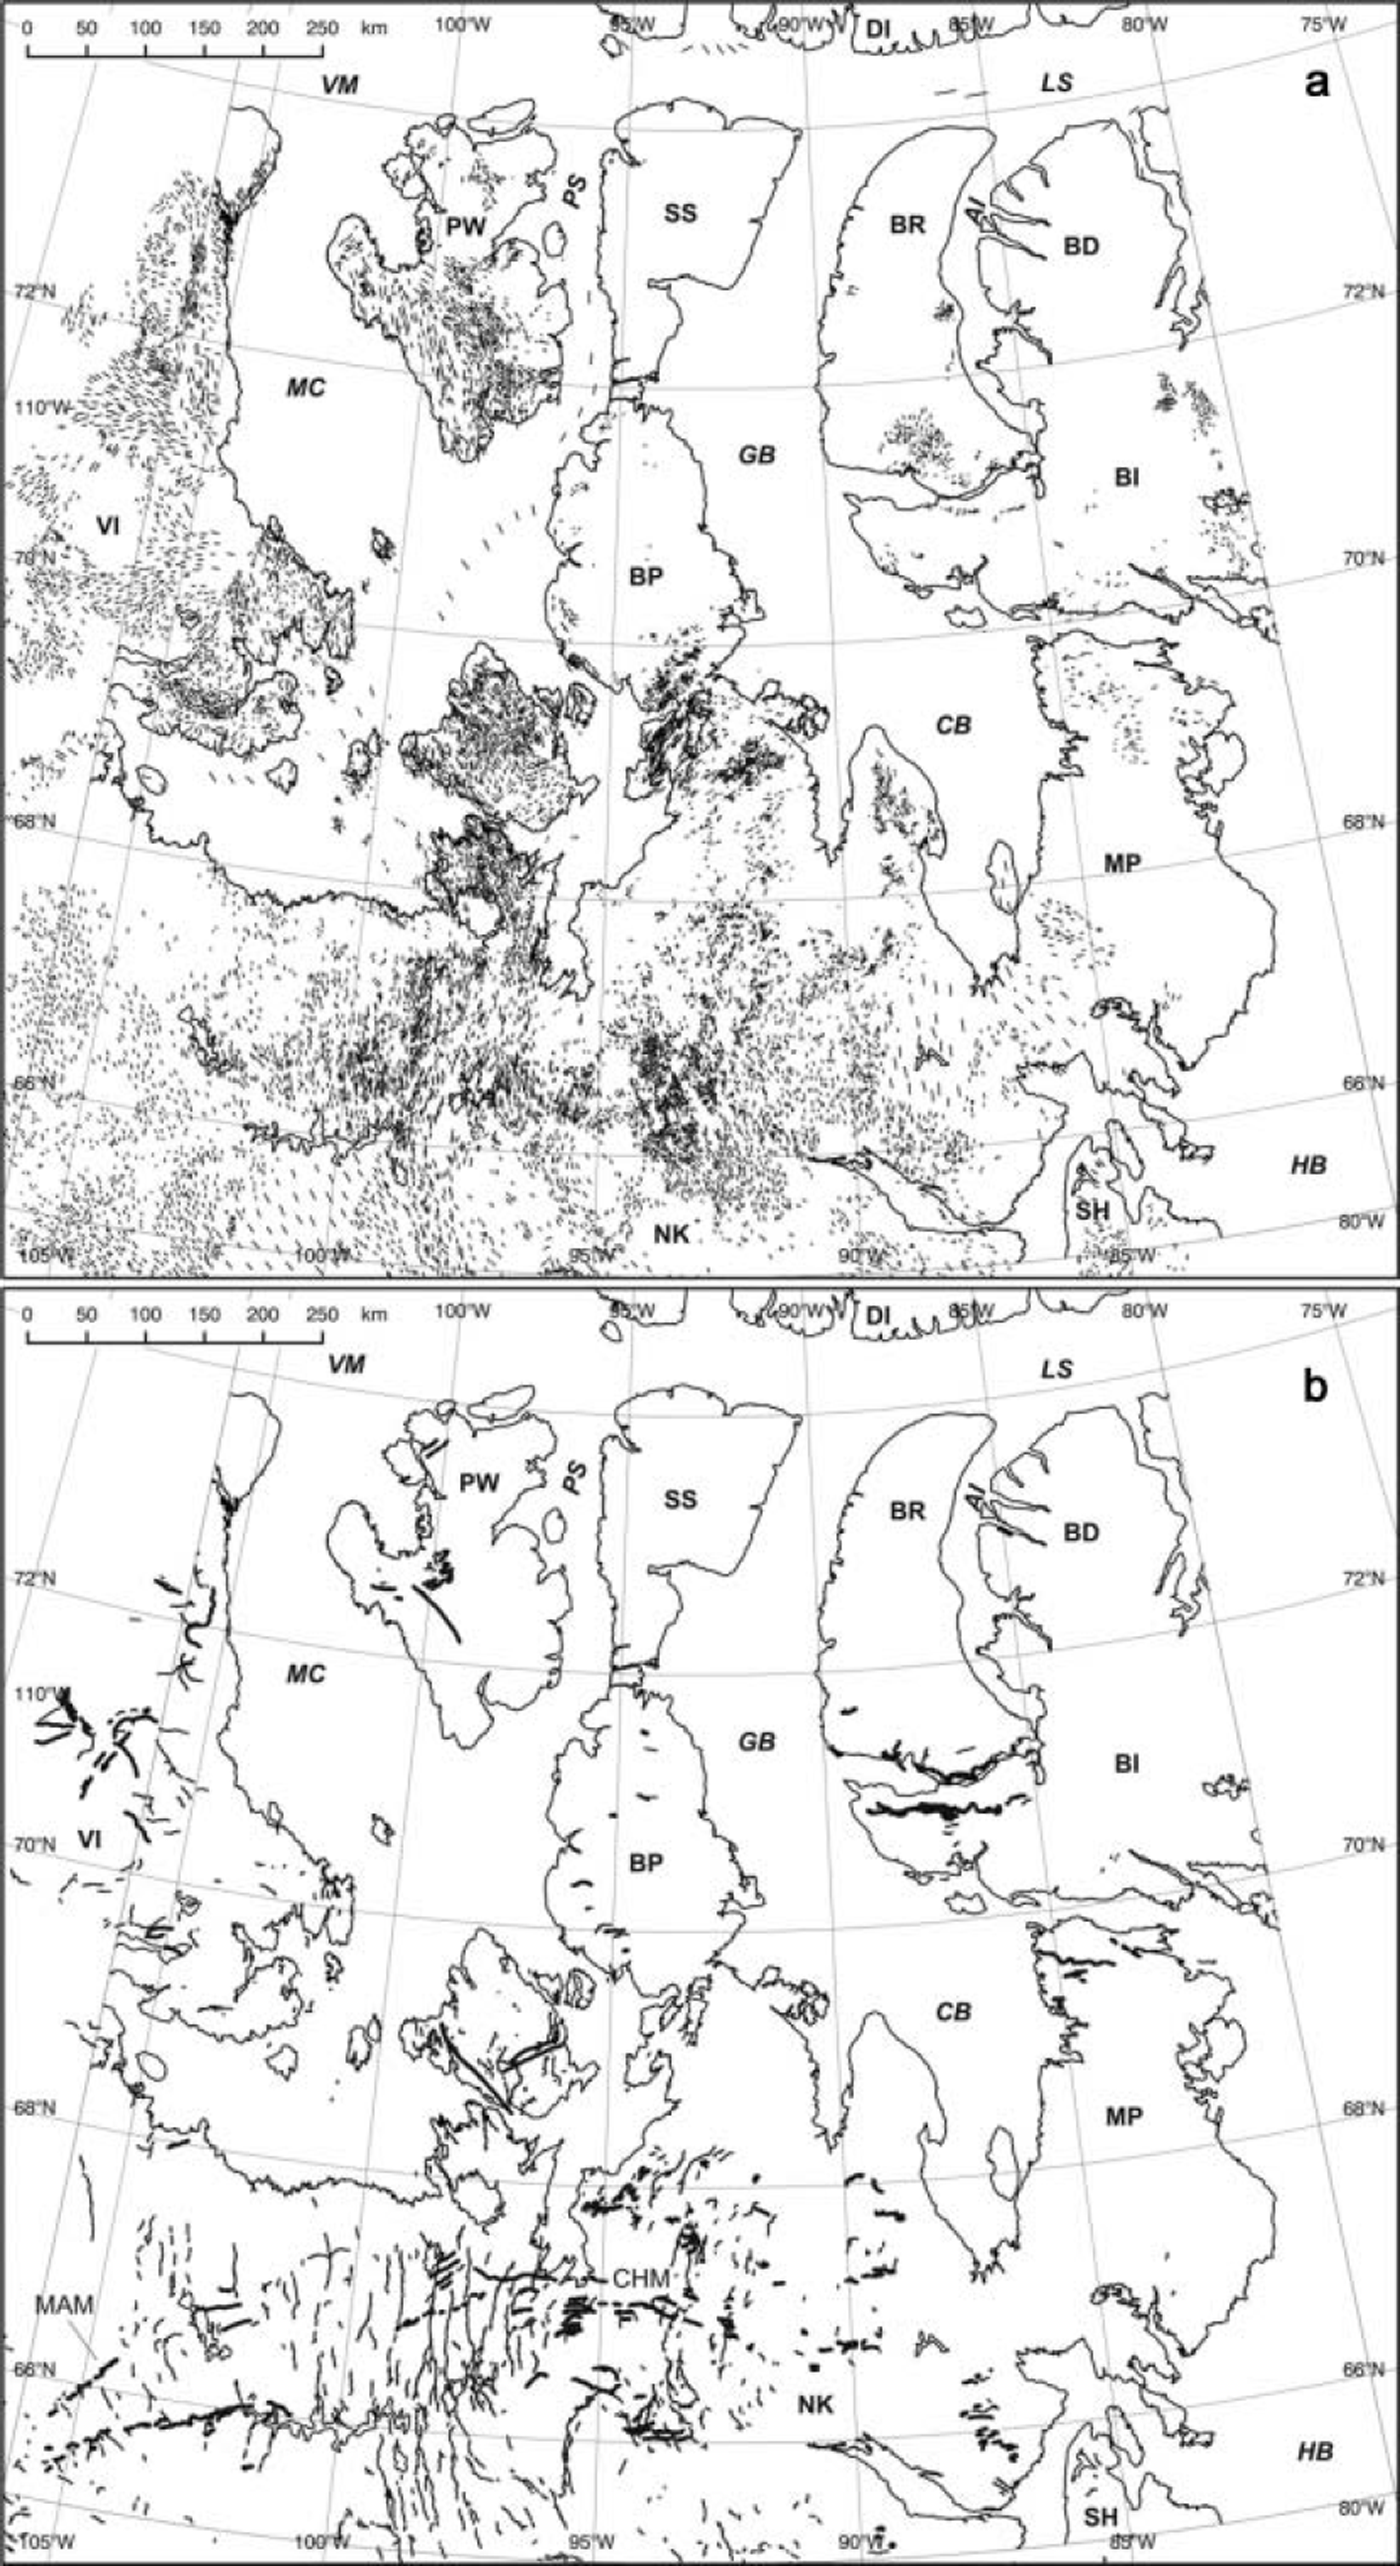
Once individual images were mapped, we reprojected the digitized features onto a map covering the whole region. To keep geometrical uniformity with Canadian cartography, a Lambert Conformal Conic projection referred to the NAD83 datum was selected. Standard parallels are located at 49˚ N and 77˚N and projection origin at 70˚ N, 93˚W. This dataset was completed by a digital elevation model (DEM) compiled with topographic information from the Global Land One-Km Base Elevation model (GLOBE; Reference HastingsHastings and others, 1999) and bathymetry from the International Bathymetric Chart of the Arctic Ocean (IBCAO; Reference Jakobsson, Cherkis, Woodward, MacNab and CoakleyJakobsson and others, 2001). Integration of these two datasets required resampling of the 1 arcmin IBCAO grid into a 30arcsec grid, in order to match GLOBE grid spacing and subsequent replacement of the IBCAO topographic information by that contained in GLOBE. These procedures were performed using Generic Mapping Tools software (Reference Wessel and SmithWessel and Smith, 1998). The complete database including DEM and mapped geomorphological features is shown in Figure 4a and b.
(a) Glacial lineations and (b) eskers (thin lines) and moraines (thick lines). Abbreviations as in Figure 1. MacAlpine (MAM) and Chantrey (CHM) moraine systems are also indicated.
Interpretation of the landform pattern was guided by a glaciological inversion model, i.e. a model that formalizes the procedure of using the landform record to reconstruct ice-sheet configurations (Reference Kleman and BorgströmKleman and Borgström, 1996). This model was originally developed for the reconstruction of the Weichselian FIS (Reference Kleman, Hättestrand, Borgström and StroevenKleman and others, 1997) and has been described in its revised form by Kleman and others (in press), so only a brief explanation is given here. The model uses glacial geological and geomorphological information, i.e. the spatial distribution of directional landforms (e.g. striae, flutes, drumlins and crag-and-tails), ice-marginal positions (e.g. moraines and outwash plains) and deglaciation evidence (e.g. lateral meltwater channels and eskers). The theoretical framework for this model is that landform creation, destruction and preservation are controlled by the location of the phase boundary of water/ice at or under the ice-sheet bed, i.e. the thermal state of the bed. It is assumed, therefore, that landform creation or reorganization requires a thawed bed, while a frozen bed inhibits the rearrangement of the landscape. The procedure involves the interpretation of landform assemblages that form a coherent glaciological pattern. Once recognized, landform assemblages are integrated into map entities denominated ‘geomorphic swarms’. Swarms are defined on the basis of spatial continuity and resemblance to a glaciologically plausible pattern following the least complex possible solution. They are drawn by following lines that are parallel to the visually coherent landform pattern, having transverse up- and downstream limits (Reference Kleman, Hättestrand, Borgström and StroevenKleman and others, 1997). Conceptually, these swarms represent the first level of abstraction in the regional interpretation scheme and they serve to reduce the map information into a manageable number of entities.
In this work we use three different types of swarms: (i) ice-stream, (ii) event and (iii) wet-based deglaciation. Ice-stream swarms are defined following the criteria proposed by Reference Stokes and ClarkStokes and Clark (1999) to identify palaeo-ice streams in the landform record. These include the recognition of convergent flow patterns, Boothia-type dispersal trains (Reference Dyke and MorrisDyke and Morris, 1988), attenuated landforms, abrupt lateral margins and the presence of lateral shear moraines (Reference Stokes and ClarkStokes and Clark, 2002) (Fig. 3c). Event swarms are defined as landform systems with abundant flow traces but lacking aligned eskers (Reference Kleman, Hättestrand, Borgström and StroevenKleman and others, 1997). In our case they are not treated as ice streams, because they do not fulfil morphological criteria for ice streams, or are of such small size that classification is difficult. Although they are treated here as wet-based sheet flow, we acknowledge the possibility that some of these swarms may represent fragments of ice streams. Wet-based deglaciation swarms are defined and interpreted as in Reference Kleman, Hättestrand, Borgström and StroevenKleman and others (1997). These are systems of directional landforms and aligned meltwater traces that are interpreted to be the result of the retreat of a wet-based ice sheet. Inferred palaeo-frozen bed areas were also mapped because of their important role in controlling the distribution of streaming patterns. The criteria used for their identification were defined by Reference Kleman and HättestrandKleman and Hättestrand (1999) and comprise the recognition of preserved landscapes (Fig. 3b), landforms indicative of thermal transition (e.g. ribbed moraines) and landforms of cold-based deglaciation, such as lateral meltwater channels. Relative chronology for geomorphic swarms and inferred palaeo-ice streams was established on the basis of existent cross-cutting relationships. These are formed after the partial modification of basal landforms due to changes in flow direction (Reference ClarkClark, 1993; see also Fig. 3a). The interpreted geomorphic swarms, frozen-bed areas and age relationships are shown in Figure 5. In this work we do not attempt to establish an absolute chronological framework for ice-stream evolution. Reported radiocarbon ages (in thousands of years before present (kyr BP)) were obtained from published studies and are given for reference purposes only.
Location and geometry of ice-stream swarms (white), event swarms (black), wet-based deglaciation swarms (dotted black) and cold-based patches (stippled areas). The white symbol denotes relative age determinations, with the internal line being parallel to the younger flow system. The numbers identify swarms mentioned in the text. Abbreviations as in Figure 1.
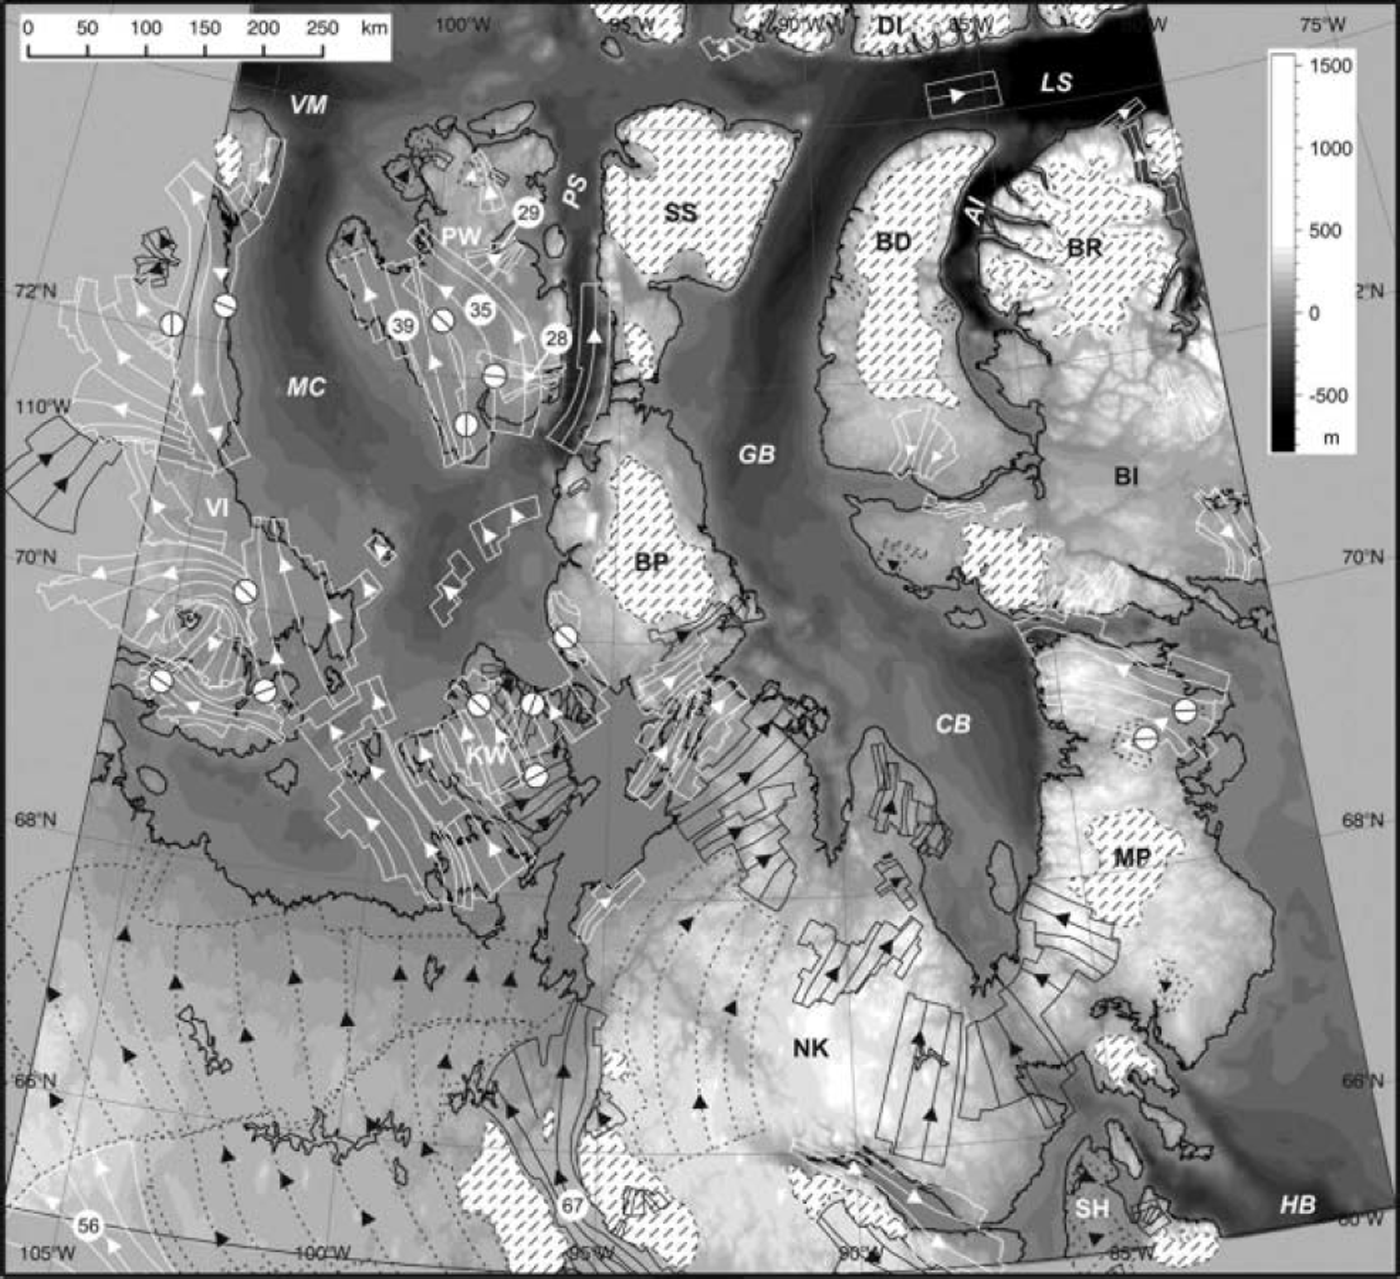
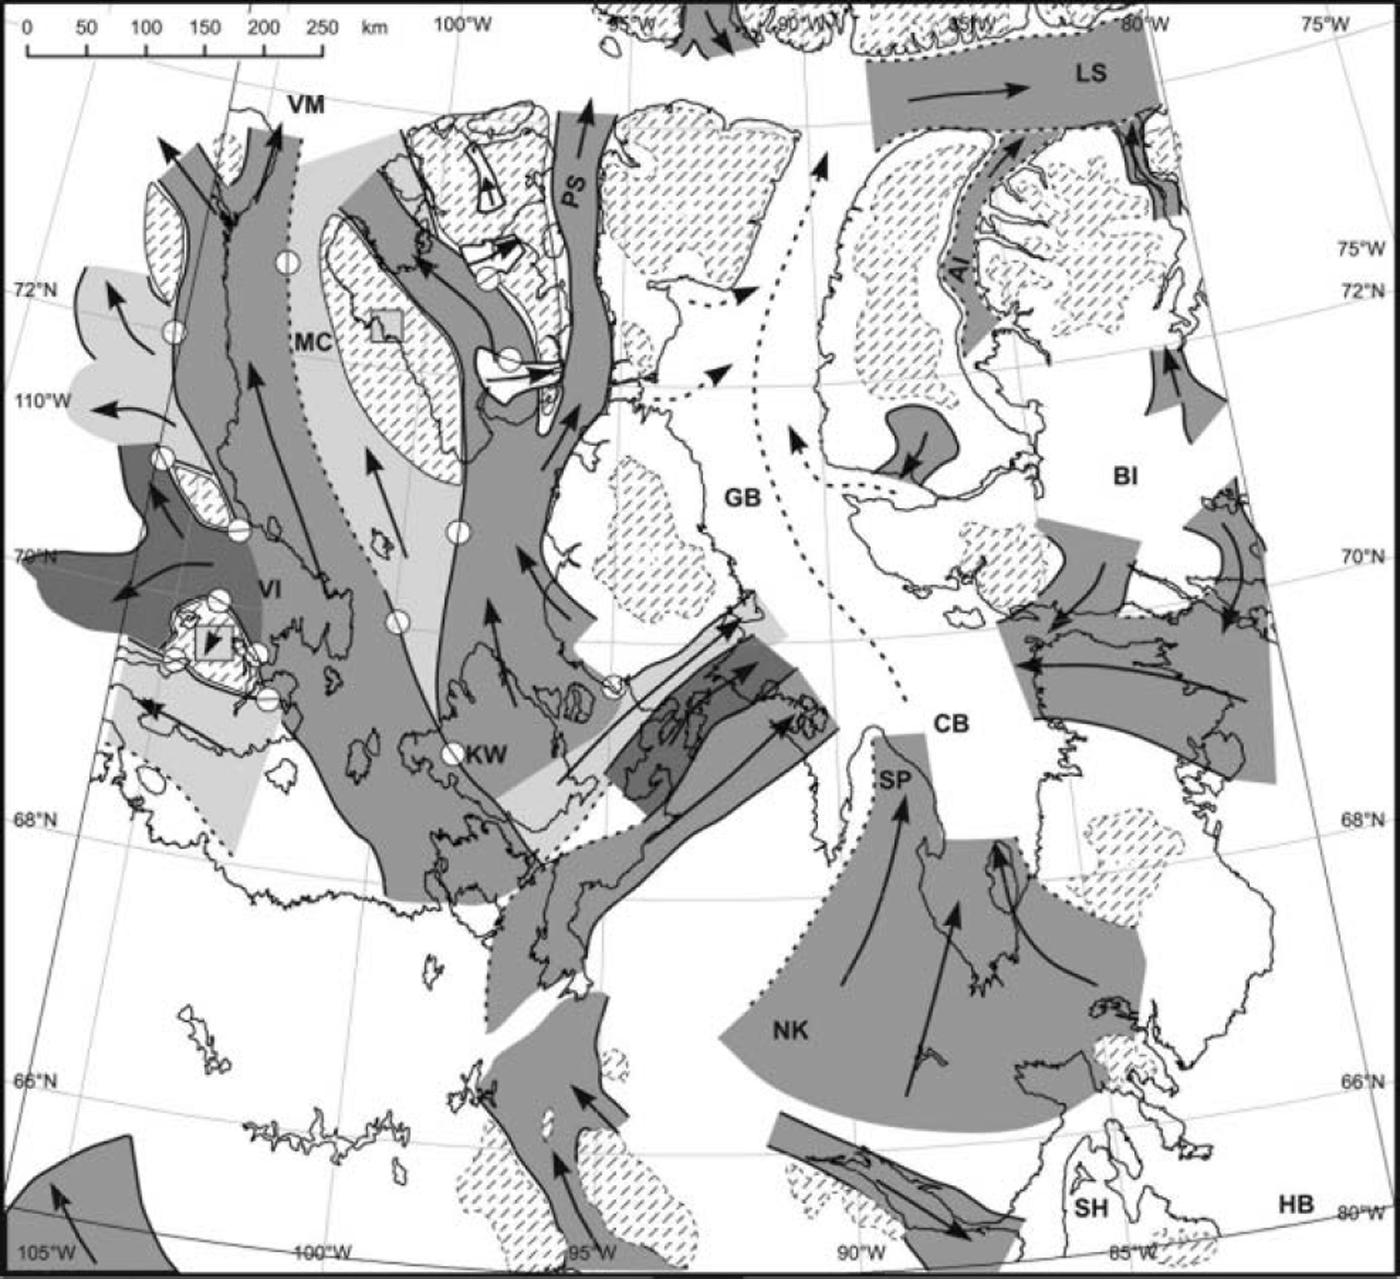
Finally, based on the information contained in Figure 5, we produced a palaeo-ice-stream map for the northern Keewatin sector of the LIS. This involved establishing links between geomorphic swarms forming coherent and glaciologically plausible scenarios (e.g. the ice-stream swarms on Prince of Wales and Victoria Islands that delineate the track of M’Clintock Channel Ice Stream (Reference Clark and StokesClark and Stokes, 2001)). Our interpretations were guided by the conceptual framework given above and the general principles of glacier and ice-sheet dynamics expressed in Reference PatersonPaterson (1994) and Reference HughesHughes (1998). The final result is shown in Figure 6, and the reasoning behind it is described in detail in the following section.
Location and relative age of inferred palaeo-ice streams. Abbreviations as in Figure 1. Except for the small deglacial ice streams (white), the remaining tones are only intended to distinguish different ice-stream tracks. Interpreted (full lines) and inferred (dashed lines) margins are shown. Stippled areas denote frozen-bed zones. The two square windows on frozen-bed zones on Prince of Wales and Victoria Islands show coverage of older ice-stream tracks. The white symbol denotes relative age determinations, with the internal line being parallel to the younger flow system.
Results and Discussion
An overview of Figure 4a and b shows that, on a regional scale, glacial landforms are concentrated on northern Keewatin, King William, Prince of Wales and Victoria Islands. Conversely, wide areas are largely devoid of glacial landforms, such as Brodeur and Borden Peninsulas, in Baffin Island, Somerset Island and northern Boothia and Melville Peninsulas. This distribution is remarkable since it follows the regional physiographic distinction made above in terms of topographic controls and indicates two styles of glaciation within the northern Keewatin sector of the LIS.
a. Subregion lacking major topographic controls
On Prince of Wales and easternmost Victoria Islands distinct bands of glacial lineations are clearly seen (Fig. 4a) and several ice-stream swarms were drawn (Fig. 5). Swarm definition and relative age assessment was facilitated by the abundance of cross-cuts, shear margin moraines and some sub-parallel esker assemblages (Fig. 4b). The main features in this area are the pattern of streaming flow parallel to M’Clintock Channel, noted by Reference Clark and StokesClark and Stokes (2001), and the small eastward- and northward-flowing palaeo-ice-stream tracks on Prince of Wales Island, reported by Reference Dyke, Morris, Green and EnglandDyke and others (1992). Another important observation is that streaming flow along the M’Clintock Channel is represented by several different ice-stream swarms, indicating that more than one ice-stream configuration seems to have existed in this area. Furthermore, as noted by Reference Dyke, Morris, Green and EnglandDyke and others (1992), the geometry of ice-stream swarm 35 requires frozen-bed areas located over the imprint of the older ice-stream swarm 39 and northern Prince of Wales Island (Fig. 5). However, the local relief lacks an obvious elevation which could have induced a frozen-bed area and, moreover, it is located over a local topographic low (Figs 4 and 5). Thus, we suggest that the most likely explanation for the location of this palaeofrozen bed area is a change of the basal thermal state of the ice cover, from warm- to cold-based, that might have occurred after the stagnation of the ice stream represented by swarm 39. Though it is difficult to explore the causes of such stagnation using the dataset presented here, we consider that a likely mechanism could be the stoppage of a wide ice plain due to basal freezing, as recently proposed by Reference Joughin, Tulaczyk, Bindschadler and PriceJoughin and others (2002) for Kamb Ice Stream (formerly known as Ice Stream C), West Antarctica. In addition, considering its location between two frozen-bed areas, we propose that ice-stream swarm 35 is a clear example of a pure palaeo-ice stream (e.g. Reference BennettBennett, 2003) (Fig. 6). Furthermore, as quoted by Reference Clark and StokesClark and Stokes (2001) and despite uncertainties regarding the exact location of the LIS margin (e.g. Reference Prest, Grant and RamptonPrest and others, 1968; Reference Dyke, Moore and RobertsonDyke and others, 2003), the northernmost reaches of the palaeo-ice streams along the M’Clintock Channel were likely situated within <50km of the ice margin at Viscount Melville Sound. According to published studies, streaming flow along the M’Clintock Channel is probably older than 10kyr BP (Reference Dyke, Morris, Green and EnglandDyke and others, 1992; Reference Clark and StokesClark and Stokes, 2001). Conversely, Reference Dyke, Morris, Green and EnglandDyke and others (1992) proposed that regional eastward flow, embracing the trace of the two small ice-stream swarms 28 and 29 (Fig. 5), took place between 9.6 and 9.3 kyr BP, just prior to deglaciation. However, we consider the latter hypothesis inadequate, since the size and proportions of these two small ice streams are not consistent with a regional eastward-flowing pattern. In our opinion, they more likely reflect a deglacial stage of a local remnant ice cap on Prince of Wales Island (Fig. 6).
The surface of King William Island embraces the imprint of several asynchronous ice streams that flowed in slightly different northwestward directions. Careful analysis allowed the identification of two eastward- and three northwestward-flowing swarms (Fig. 5). In the case of the northwestward-flowing swarms, relative ages could be assessed because landforms forming the older patterns are remarkably larger and look more degraded than the younger ones. The location and flow direction of these swarms are strong indicators of three different generations of M’Clintock Channel Ice Stream (Reference Clark and StokesClark and Stokes, 2001) (Fig. 6). Moreover, the landform record suggests that although the same main corridor was used by all three generations of M’Clintock Channel ice streams, the width and specific path were different at the different evolutionary stages of the LIS. Such behaviour is consistent with the evidence from Prince of Wales Island and supports the existence of pure ice-stream behaviour in this subregion. Absolute ages of these swarms are unknown.
Across south and central Boothia Peninsula, a wide band of glacial indicators, including a remarkable field of mega-scale glacial lineations, indicates palaeo-ice flow towards the Gulf of Boothia. Eskers are scarce and the till cover is patchy in this area. Closer analysis shows that this band is heterogeneous and we discriminated three different palaeo-ice streams, as recognized by Reference DykeDyke (1984). The age of the system is unknown but is certainly older than the last deglaciation at roughly 9.0 kyr BP (Reference DykeDyke, 1984). These palaeo-ice streams drained ice from a source area located on King William Island or possibly further south, pouring ice into the Gulf of Boothia trough (Fig. 6). This system represents a link between the two physiographic subregions, with flow being likely constricted by frozen-bed areas in the source areas and by topography in the distal parts.
The pattern of glacial lineations on northern Keewatin south of 688 N shows a wide north-northwestward flow. A minimum of three flow generations can be recognized, becoming younger from east to west, with an oldest northward and a youngest north-northwestward flow (Reference TaylorTaylor, 1956; Reference LeeLee, 1959). Except in two cases (see below), attempts to define swarms largely failed due to difficulties in separating coherent flow patterns. This is probably because the area was the main corridor of the northern Keewatin sector of the LIS during, at least, the last glacial cycle (Reference Kleman, Fastook and StroevenKleman and others, 2002). Perhaps the directional shift in this region occurred more or less continuously under wet-bed conditions, leading to a ‘smeared’ pattern in which it is difficult to reliably trace lateral boundaries. However, the pattern of the last deglaciation can be inferred from the deglacial esker network and from areas where eskers are genetically linked to marginal landforms such as moraines and outwash plains. This is particularly the case for the zone extending between 105˚W and 90˚W, where the esker pattern meets the Chantrey and McAlpine moraine systems (Reference DykeDyke, 1984; Fig. 4b). According to this evidence, we defined two wide wet-based deglaciation swarms embracing the area. The southernmost swarm represents the last deglaciation event and possibly reflects the geometry of the last remnants of the LIS between 8.0 and 8.5 kyr, according to the age of the moraines (Reference Dyke, Moore and RobertsonDyke and others, 2003). The second deglaciation swarm comprises the remaining area to the north; its age is uncertain, but likely falls between 10 and 8 kyr BP (Reference Dyke, Moore and RobertsonDyke and others, 2003).
The two exceptions mentioned above within northern Keewatin are ice-stream swarm 56, and event swarm 67 with its associated frozen-bed patches (Fig. 5). Ice-stream swarm 56 comprises the northernmost reaches of the Dubawnt Lake palaeo-ice stream (Reference Kleman and BorgströmKleman and Borgström, 1996; Reference Stokes and ClarkStokes and Clark, 2003) and is regarded as a possible surging episode during the final stages of the Keewatin sector of LIS at 8.2–9.0 kyr BP. The second exception comprises a distinct area centred at 66˚N, 96˚ W, where a band of parallel, northwesterly-oriented glacial lineations is observed. This band is bounded to the east by a zone bearing pockets of degraded lineations bearing a southwesterly flow and, to the west, by a zone without glacial landforms. The pockets of degraded landforms clearly represent fragmentary ice-flow records preserved under the frozen-bed zones (Reference Kleman and HättestrandKleman and Hättestrand, 1999). In addition, the esker pattern within the band is aligned in a subparallel fashion with the lineations and is concentrated at the border with this interpreted palaeo-frozen bed zone. Thus, we interpret this landform assemblage as the imprint of a fast-flow band, possibly an ice-stream tributary, bounded by two frozen-bed zones, in a configuration that is diagnostic for pure ice streams. The age of the complete system is uncertain, but, though the system is immersed in an area dominated by a wet-based deglaciation pattern, deglacial eskers are noticeably absent. This suggests that the flow system predates the deglaciation stage and must have been preserved by a frozen-bed zone during deglacial times. Furthermore, despite the lack of geomorphological continuity and based on the location and size of event swarm 67, we propose that this flow pattern may indicate an onset region for the ice streams that flowed along the M’Clintock Channel and across the Boothia Peninsula (Fig. 6). The location of this system indicates that fast flow was present within distances of <200km of the postulated ice-divide region (Reference Aylsworth and ShiltsAylsworth and Shilts, 1989; Fig. 1). This situation is comparable to modern West Antarctic ice streams such as Bindschadler Ice Stream (formerly known as Ice Stream D) and Pine Island Glacier, the roots of which can be traced up to 200 and 260 km from the ice divide respectively (e.g. Reference Bamber, Vaughan and JoughinBamber and others, 2000, fig. 2). However, this comparison should be made with caution because, lacking controls for the absolute ages of these swarms, we cannot rule out the possibility that the observed ice-divide region of northern Keewatin and event swarm 67 were metachronous.
b. Subregion with strong topographic controls
In this subregion, wide areas devoid of landforms are recognized on relatively high (>300 m a.s.l.) plateaus of northern Boothia and Melville Peninsulas, Somerset Island and Brodeur and Borden Peninsulas on Baffin Island (Figs 2 and 5). These zones frequently bear the imprint of older landscapes (Fig. 3b), indicating coverage by cold-based ice (Reference Kleman and HättestrandKleman and Hättestrand, 1999) (Fig. 5). There is relatively little lineation evidence for ice streams on land in this region. The most important ice-stream track is on northern Melville Peninsula (Reference DredgeDredge, 2000) and represents ice flowing from the Foxe sector into the Committee Bay–Gulf of Boothia trough. The remaining swarms are markedly smaller, except for the convergent flow pattern at the head of Committee Bay, southernmost Melville Peninsula. Nevertheless, the multibeam sonar survey records (Fig. 2) show that streamlined glacial landforms are widespread on the floors of Peel Sound, Admiralty Inlet and parts of Lancaster Sound (Fig. 4a). The size and morphology of these landforms (8–11 km long, 0.5–2km wide), in particular those on Peel Sound and Admiralty Inlet, are strong indicators of streaming flow, and consequently these landform assemblages were interpreted as ice streams (Fig. 5). Considering that flow of these ice streams was restricted by topography, they fit well into the definition of topographic ice streams (e.g. Reference BennettBennett, 2003).
The prominent landform swarm found on eastern Keewatin and southern Melville Peninsula forms an extensive palaeo-ice-flow pattern, extending around Committee Bay, from Simpson Peninsula to southern Melville Peninsula, with a maximum width of 350 km (Figs 4 and 5). It indicates massive convergent flow from both the Keewatin and Foxe sectors, towards the Gulf of Boothia–Lancaster Sound trough (Fig. 6). The size, location and geometry of this swarm supports the idea depicted in several reconstructions (Reference Dyke and PrestDyke and Prest, 1987; Reference HughesHughes, 1998) that this area functioned as the head of one of the main northern gateways of the LIS. This convergent pattern provides evidence for fast ice flow deep into the ice-sheet interior, at approximately 250 km from the ice divide. Furthermore, ice flow converging in this area was likely the main tributary of episodic ice streams and postulated ice shelves (Reference Dyke and PrestDyke and Prest, 1987) in the Gulf of Boothia–Lancaster Sound trough. This raises the possibility that disintegration of a hypothetical Gulf of Boothia ice shelf might have triggered the acceleration and rapid retreat of the northernmost Keewatin and Foxe sectors of the LIS, as recently reported for part of the Antarctic Peninsula (Reference De Angelis and SkvarcaDe Angelis and Skvarca, 2003). The possibility that such an event occurred during the final deglaciation is not unlikely, considering the sensitivity of ice shelves to atmospheric warming (Reference De Angelis and SkvarcaSkvarca and De Angelis, 2003), and might have been as relevant for LIS decay as the surges of Hudson Strait Ice Stream (Reference Andrews and MacLeanAndrews and MacLean, 2003; Fig. 1).
In this paper, we have particularly focused our discussion on the major topographical features as controls for ice streams, and based on this we distinguished pure and topographical ice-stream behaviour. However, a remark should be added about potential controls on ice-stream activation, such as the geology and thermal balance of the bed. Regarding geological controls, most evidence for ice streams is located on King William, Prince of Wales and Victoria Islands, where bedrock is mostly composed of Palaeozoic carbonates (Reference DykeDyke, 1984), i.e. a ‘soft’ substratum. Palaeozoic carbonates also appear on northeastern Melville Peninsula and southern Brodeur Peninsula, Baffin Island, where ice streams were also identified. Although these findings could be used to argue in favour of a dominant geological control in the region, we also found two cases of ‘hard-bedded’ ice streams: ice-stream swarm 56, which has been referred to as the Dubawnt Lake palaeo-ice stream by Reference Stokes and ClarkStokes and Clark (2003), and event swarm 67, interpreted as a palaeo-ice-stream tributary. The bedrock under these palaeo-ice streams is composed of Precambrian gneisses and granites (Reference DykeDyke, 1984). Other ice streams in the region flowed along the topographic troughs. Considering the shape of the landforms seen along the track of the multibeam sonar survey, some of them seem to be underlain by sediments, though the rheological properties of this substratum are unknown. Regarding the thermal balance of the bed, we propose that at least in the case of the stoppage of ice-stream swarm 39 (Fig. 5), a change from thawed to frozen bed can be invoked as a cause. Thermal activation of ice-stream swarm 35 is also a possibility, but in the light of our dataset such a conclusion remains speculative.
Finally, although our dataset does not allow us to explore the precise timing and longevity of the mapped ice streams, it supports the view of a highly dynamic ice sheet, subject to marked changes in the geometry of its streaming networks. This is mostly evident for the region lacking strong topographic controls where we found three generations of ice streams along the M’Clintock Channel. This indicates that individual ice streams were transient features and that their position, geometry and, possibly, velocity fields attained different configurations at different times. Ice streams in the region with strong topographic controls may also have been transient features. Here, although the position and width of ice streams were prescribed by topography, changes in ice flux arising from the transient state of the ice sheet could have been accommodated by changes in thickness and velocity. Regarding the exact timing and longevity of the ice streams, very little can be said due to the lack of age controls for most landform swarms. However, most ice streams are likely related to conditions during the Last Glacial Maximum (LGM) and deglacial stages, though there is no reason to think that a similar pattern could not have occurred during pre-LGM times.
Conclusions
Based on the geomorphological interpretation of Landsat 7 ETM+ imagery and using a glaciological inversion model, we produced a palaeo-ice-stream map of the northernmost Keewatin sector of the Laurentide ice sheet.
We recognized two physiographically distinct sectors, in terms of topographic control for ice-stream flow, with the division between the two approximating a line from northern Victoria Island to Southampton Island. To the southwest of this line, relief is generally low, while to the northeast the terrain is divided into topographically distinct blocks on the 100–200km scale. On the subregion lacking strong topographic controls, we found evidence for pure ice streams, especially on Prince of Wales and King William Islands, where three ice-stream configurations, representing three flow generations, are recognized. Analysis of the landform record indicates that the location of streaming flow within this subregion was controlled by the temporary location of frozen-bed areas. Lacking marked topographic controls, the pattern of ice-stream evolution reveals that ice flow was likely regulated by the switching on and off of these ice streams, probably as a consequence of changes in the thermal state of the bed or the rheological properties of the substratum. On the subregion with strong topographic controls, glaciation was dominated by a constellation of frozen-bed sectors drained by a number of warm-based ice streams concentrated in the topographic troughs. Due to the topographical guidance, this basal thermal configuration was likely to be geometrically stable, in contrast to conditions in the southwestern subregion. In addition, the imprint of a massive convergent palaeo-ice flow pattern is recognized south of Committee Bay, at the head of the Gulf of Boothia–Lancaster Sound trough. According to evidence presented here and elsewhere, it is very likely that this system was one of the main gateways of the LIS.
Finally, our results reveal widespread streaming flow on the northern Keewatin sector of the LIS, from close to the northern margin to within 200 km of the proposed ice-divide region. This confirms partial reconstructions of the southern Keewatin sector of the LIS and demonstrates that ice flow within the LIS developed patterns that are similar to those present on the Greenland and Antarctic ice sheets.
Acknowledgements
This work was made possible through grants from the Swedish Natural Science Research Council to J. Kleman and the Hans W:son Ahlmanns Fund for Geographic Research to H. De Angelis. We thank K. Jansson for useful comments and J. Shaw for calling attention to the Northwest Passage Transit 2003 multibeam sonar survey of the Ocean Mapping Group, University of New Brunswick, Canada. This paper was enriched by the constructive comments of I. Willis, C. Clark and C. Ó Cofaigh during the review process.



