Introduction
Weeds play an important role in enriching biodiversity and ecosystem services, such as by promoting biological evolution, improving the ecological environment, and maintaining climate stability. Evidence for this has been gathered over a long time and is being increasingly reported (Gage and Schwartz-Lazaro Reference Gage and Schwartz-Lazaro2019; Guo et al. Reference Guo, Qiu, Li, Lu, Olsen and Fan2018; Korres et al. Reference Korres, Norsworthy, Tehranchian, Gitsopoulos, Loka, Oosterhuis, Gealy, Moss, Burgos, Miller and Palhano2016). The benefits of weeds vary according to their species, growth status, and habitat type. These factors are also the fundamental criteria by which weeds reflect the biodiversity and quality of ecological services (Bretagnolle and Gaba Reference Bretagnolle and Gaba2015). Therefore, the ability to map weeds and analyze their physiological activity such as photosynthesis and respiration is very significant (Ferreira et al. Reference Ferreira, Zortea, Zanotta, Shimabukuro and De Souza Filho2016; Rozenberg et al. Reference Rozenberg, Kent and Blank2021). To monitor weeds’ physiological activity, data on their biophysical circumstances must be gathered and updated. However, detecting weed physiological activity and species types using traditional visual recognition technology can be challenging (Adegbenjo et al. Reference Adegbenjo, Liu and Ngadi2020; Prati et al. Reference Prati, Shan and Wang2019). At the same time, many of the costs associated with machine vision are too high, including the construction of complex systems and expensive field surveys (Tzamali et al. Reference Tzamali, Akoumianakis, Argyros and Stephanedes2006), and machine vision provides only limited spectral information as it only records information using three broad bands (625 to 740, 570 to 585, and 492 to 577 nm) (Zhang et al. Reference Zhang, Gao, Cen, Lu, Xu, He and Pieters2019b).
Remote sensing techniques can map the distribution of weeds and effectively monitor their changes in complex urban environments (Segarra et al. Reference Segarra, Buchaillot, Araus and Kefauver2020). Hyperspectral imaging techniques, in particular, are evolving from spectral response models to allow species identification and vegetation monitoring. Many studies have used hyperspectral data obtained by satellite (Khaliq et al. Reference Khaliq, Comba, Biglia, Aimonino, Chiaberge and Gay2019), airborne (Maes and Steppe Reference Maes and Steppe2019), and ground-based (Behmann et al. Reference Behmann, Acebron, Emin, Bennertz, Matsubara, Thomas, Bohnenkamp, Kuska, Jussila, Salo, Mahlein and Rascher2018) cameras for species identification, vegetation monitoring, and crop classification (Mariotto et al. Reference Mariotto, Thenkabail, Huete, Slonecker and Platonov2014). However, many factors affect satellite-based detection accuracy, including altitude, atmospheric conditions, and the systematic errors related to orbit angle and solar radiation pressure known to affect the Chinese BeiDou Navigation Satellite System, geostationary orbit satellites, and inclined geostationary orbit satellites (Guo et al. Reference Guo, Xu, Zhao and Liu2016). Although a variety of sensors can be used to improve accuracy, space missions have limited availability, making it difficult to obtain specific hyperspectral data (Zhong et al. Reference Zhong, Wang, Xu, Wang, Jia, Hu, Zhao, Wei and Zhang2019). Airborne acquisition techniques, such as unmanned aerial vehicles (UAVs), have the advantage of lower flight altitudes; however, they do not produce accurate correction signals (Rossini et al. Reference Rossini, Nedbal, Guanter, Ac, Alonso, Burkart, Cogliati, Colombo, Damm, Drusch, Hanus, Janoutova, Julitta, Kokkalis and Moreno2015). Therefore, a ground-based hyperspectral technique has been adopted by researchers to acquire high-spatial-resolution images with minimal atmospheric effects (Katkovsky et al. Reference Katkovsky, Martinov, Siliuk, Ivanov and Kokhanovsky2018).
Databases of plant-specific information have been established, providing important resources for various fields of research. The International Water Management Institute provides a wetland vegetation hyperspectral database that includes a broad-spectrum database for coastal wetland vegetation communities under different bioclimatic, soil, and disturbance conditions. This facilitates the monitoring of detailed changes in wetland vegetation structure and species composition (Zomer et al. Reference Zomer, Trabucco and Ustin2009). Manjunath et al. (Reference Manjunath, Kumar, Meenakshi, Renu, Uniyal, Singh, Ahuja, Ray and Panigrahy2014) established a spectral database of Himalayan vegetation species, including the spectra of leaves and branching canopies of various vegetation types, and calculated 22 vegetation indices such as the normalized difference vegetation index (NDVI), simple ratio, and soil-adjusted vegetation index (SAVI). At the same time, the biochemical parameters such as chlorophyll a, chlorophyll b, and protein were measured using standard methods, and the close correlation between them was studied. The information provided in spectral libraries can be used to explore the chemical composition, growth behavior, and ecological environment of Himalayan vegetation (Yang et al. Reference Yang, Tian, Feng, Gong and Liu2021). Khdery and Yones (Reference Khdery and Yones2021) established an innovative spectral library of common wild plants on the northwest coast of Egypt. It analyzed the characteristics of 27 wild vegetation species, such as saltbush (Atriplex halimus L.) and thyme [Thymus capitatus (L.) Hoffsgg. & Link], and strengthened the observation of wild vegetation through remote sensing used to identify common wild plant species. Although existing spectral libraries cover a wide range of spectral information, there is limited information on the spectral features of weed species in different cities. Many species native to the middle temperate zones, such as musk thistle (Carduus nutans L.) and sand cinquefoil (Potentilla supina L.), are unlikely to be found in these spectral libraries. Northeast China is renowned for its distinctive landscape features and has a mid-temperate continental monsoon climate with a great diversity of weed species. Most weeds grow in an intense urban environment (Brunzel et al. Reference Brunzel, Fischer, Schneider, Jetzkowitz and Brandl2009; Von der Lippe and Kowarik Reference Von der Lippe and Kowarik2007) with long winters and have short growth cycles. Therefore, this study analyses the abundant weed species of northeast China to contribute to the development of a hyperspectral imaging database. This enriches studies on weed species in urban areas of northeast China with hyperspectral data.
In light of this, the process of this study was: (1) a hyperspectral library of urban weeds in northeast China was established, including 435 hyperspectral images of 40 species and 23 families; (2) the spectral profiles and vegetation indices were used to indirectly characterize the growth and physiological activity of weed species; (3) five different pretreatments (first derivative spectrum [FDS], second derivative spectrum [SDS], standard normal variate [SNV], moving averages [MA], and Savitzky-Golay [SG] smoothing) were used to maximize the retention of spectral features, combined with a convolutional neural network (CNN) built to identify different weed species.
Materials and Methods
Study Area and Target Weed Selection
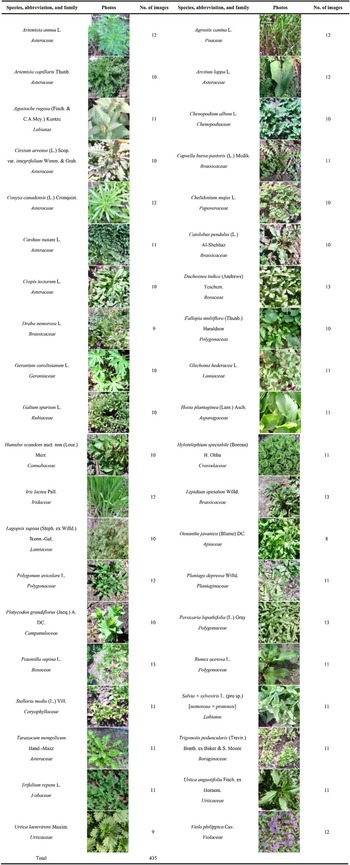
This study was conducted in Heilongjiang Province, northeast China. The selected weed species (Figure 1) were located at seven different sites: (1) Harbin City (44.067°N to 46.667°′N, 125.7°E to 130.167°E), (2) Qiqihar (45°N to 48°N, 122°E to 126°E), (3) Hegang City (47.067°N to 48.35°N, 129.65°E to 132.517°E), (4) Shuangyashan City (46.333°N to 47.9°N, 130.9°E to 131.783°E), (5) Daqing City (45.767°N to 46.917°N, 124.317°E to 125.2°E), (6) Jiamusi City (45.933°N to 48.467°N, 129.483°E to 135.083°E), and (7) Suihua City (45.05°N to 48.033°N, 124.217°E to 128.5°E). To construct representative data sets and establish robust models to characterize and identify common weeds in northeastern cities, weed selection criteria included but were not limited to weed species, size, similarity of appearance, proximity to roads, and traffic flow on nearby roads.
Descriptions and photos of selected weed species collected in in Heilongjiang Province, northeast China.

Image Acquisition Plan
To obtain high-spatial-resolution data with minimal atmospheric disturbance, a field acquisition method was adopted. A new, portable, handheld hyperspectral camera, SPECIM IQ (model SN: 190–1100381, SPECIM, Spectral Imaging, Oulu, Finland), was used to obtain hyperspectral images of weeds. This camera integrates hyperspectral data acquisition, analysis, processing, and visualization of the results. It weighs 1.3 kg and measures 207 × 91 × 74 mm (lens: 125.5 mm). The camera is supported by Specim IQ Studio software and can be remotely connected via universal serial bus or wireless fidelity for the remote control of all camera functions except focusing. SPECIM IQ takes full hyperspectral images without the need for external movement. In the optical and near-infrared wavelengths of the electromagnetic spectrum (approximately (397 to 1,003 nm), the camera obtains hyperspectral images containing a 204 spectral narrow band with a spectral resolution of about 7 nm. The camera provides 512 × 512 pixels of spatial sampling, covering a field of view of 31° × 31°. When the camera samples 1 m away from the target, it captures an area of 0.55 × 0.55 m, and the peak signal-to-noise ratio is >400:1.
To maintain the accuracy of weed data sampling under different time of day and weather conditions, a white reference board was used for calibration (Wang et al. Reference Wang, Fu, Weng, Yang and Wang2023). Irradiance fluctuations brought on by atmospheric factors and changes in solar illumination are the most important factor in field reflectance measurements. Most reflectance measurements are still single field-of-view measurements, so the time between the target and reference measurements should be as short as possible to avoid any potential atmospheric effects. This improvement is also necessary because all weed samples and white reference frame measurements must have the same lighting characteristics. Any change in distance between the camera and weed samples and in-field light intensity will affect the reflectance measurements. To ensure the accuracy of the reflectance measurements of all samples, quick atmospheric correction (QUAC) must be considered (Zhang et al. Reference Zhang, Zheng, Liu, Du, Du, Lei, Xu, Xu, Mu, Bi and Li2021). QUAC aims to eliminate atmospheric, light, radiation, and surface temperature effects on the spectral reflectance of samples to obtain more accurate reflectance data. In addition, it does not need to provide the specific location and time of sample measurement, and it automatically collects spectral information on the samples and other background materials in the image, so as to invert the true reflectance of the samples. At present, QUAC supports a hyperspectral range of 400 to 2,500 nm, which is suitable for hyperspectral imaging in various complex environments and bands.
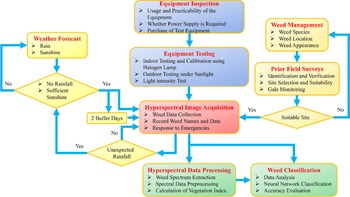
We collected 435 hyperspectral images of 40 weed species. The specific information on the collected weed samples and corresponding pictures are shown in Figure 1. A detailed flowchart of the hyperspectral image acquisition and data analysis processes is shown in Figure 2.
Flowchart of the hyperspectral detection process used in this study.

Methods
For spectral processing, ENVI v. 5.3 software (Exelis Visual Information Solutions, Boulder, CO, USA) was used to extract spectral data from the hyperspectral images obtained by SPECIM IQ. To improve the prediction accuracy and deal with the inevitable negative impacts of environmental and system noise, the 981 to 1,003 nm band was eliminated, as it was heavily affected by noise. Therefore, the band for our actual pretreatment and spectral analysis is 397 to 981 nm. In addition, before the neural network classification model was established, five methods (FDS, SDS, SNV, MA, and SG) were used to preprocess the hyperspectral data. The five pretreatment methods, kernel principal component analysis (KPCA), and classification models were run in MATLAB R2022a software (MathWorks, Natick, MA, USA); principal component analysis (PCA) was run in IBM SPSS Statistics 27 software (International Business Machines, Armonk, NY, USA).
Smoothing
The SG smoothing and MA (smoothing window of five points) techniques were adopted to reduce the influence of high-frequency noise and baseline translation noise while retaining the unique characteristics of the samples (Chen et al. Reference Chen, Zhang, Zhang and Liu2012; Zhang et al. Reference Zhang, Zhou, Zhao, Zhu, Liu and He2020). SG is the most commonly used smoothing algorithm. It obtains a best estimate of the spectral smoothing points by weighted filtering and polynomial fitting of the data within a window of a certain width. By changing the size of the window and the order of the polynomial function, one can change the degree of SG smoothness (Chen et al. Reference Chen, Pan, Chen and Lu2011). On the other hand, the MA approach smooths the window with an odd width and averages the data within the window to remove noise. MA smooths single-sample data rather than moving and scaling all sample data and can accurately identify the noise in each segment of the spectrum and the unique features of the spectral curve. In addition, to avoid the smoothed spectral data being lower than the original data, the spectral data were zeroed before data processing and then fit.
Differentiation
The core of this study is to distinguish the characteristics of various weeds and improve the accuracy of the neural network, which is often affected by baseline translation, smoothing background interference, and spectral mixing and overlap (Cheoi et al. Reference Cheoi, Choi and Ko2020; Hu et al. Reference Hu, Zhang, Ma, An, Ren and Li2019). The FDS and SDS of spectral reflectance data are commonly used to avoid the influences of these factors (Yeow and Leong Reference Yeow and Leong2005) and are widely used in vegetation detection. Previous studies have reported that differential spectroscopy can further improve the ability to identify vegetation using spectral data (Qian et al. Reference Qian, Yu, Jia, Yang and Palidan2013), reflect the waveform changes caused by light absorption by chlorophyll and other substances in plants, and reveal the characteristics of the peak in the spectrum (Becker et al. Reference Becker, Lusch and Qi2005). Therefore, to highlight the subtle absorption features in weed data, this study used FDS and SDS to preprocess the original spectral data, so as to improve the classification accuracy of the neural network.
Standard Normal Variate Transformation
In this study, weed hyperspectral data were collected in a field environment, which was easily affected by surface scattering and optical path changes. To eliminate the influence of these factors and reflect the spectral characteristics of weeds, SNV transformation was used to pretreat the spectral data of weeds before using the neural network classification model to identify them. The difference between this algorithm and others is that SNV processes one spectrum and can better extract the spectral characteristics of weeds (Kachrimanis et al. Reference Kachrimanis, Braun and Griesser2007). The formula for SNV is as follows:
 $${R_{i,SNV}} = {{{R_{i,k}} - \overline {{R_i}} } \over {\sqrt {{{\sum\limits_{k = 1}^m {{{({R_{i,k}} - \overline {{R_i}} )}^2}} } \over {m - 1}}} }}$$
where
 ${R_{i,SNV}}$
is the transformed spectrum,
 $$\overline {{R_i}} = {{\sum\limits_{k = 1}^m {{R_{i,k}}} } \over m}$$
;
 $i$
is the number of spectral samples;
 $k$
= 1, 2, 3, …,
 $m$
, where k is the number of wavelength points; and m = 1, 2, 3, …, n, where n is the sample size.
Exploratory Data Analysis
Hyperspectral images contain an abundance of high-dimensional data, so it is very difficult to conduct qualitative analysis of spectral data directly, and it is difficult to mine the fine features in spectral data. PCA is one of the most commonly used unsupervised chemometric tools to explore hidden information in large amounts of data (Zhang et al. Reference Zhang, Liu, He and Li2013). It enables an overview of complex multivariate data and has been widely adopted to process hyperspectral imaging data (Bro and Smilde Reference Bro and Smilde2014). PCA converts a group of possibly correlated variables into a group of linearly uncorrelated variables through orthogonal transformation, which are called principal components (PCs). After PCA, spectral data usually generate several PCs to reveal the internal structure of multiple variables, so as to retain and extract the original spectral curve features as much as possible. In PCA, for m hyperspectral weed samples
 $\left\{ {{x^1},{x^2}, \cdots ,{x^m}} \right\}$
, each sample i had n-dimensional characteristics
 ${X^i} = \left( {{x_1}^i,{x_2}^i, \cdots ,{x_n}^i} \right)$
. The covariance matrix corresponding to each dimension feature
 ${X_j} = \left( {{x_j}^1,{x_j}^2, \cdots ,{x_j}^m} \right)$
,
 $\left( {j = 1,2, \cdots ,m} \right)$
has m eigenvalues
 ${\lambda _j}$
and eigenvector
 ${u_j}$
, and
 $\left\{ {\left( {{\lambda _j}^1,{u_j}^1} \right),\left( {{\lambda _j}^2,{u_j}^2} \right), \cdots ,\left( {{\lambda _j}^k,{u_j}^k} \right)} \right\}$
can be obtained by selecting the first k largest eigenvalues. For each dimension feature, the new variable of m samples
 $\left\{ {{x_j}^1,{x_j}^2, \cdots ,{x_j}^m} \right\}$
after projection is
 $\left\{ {{y_j}^1,{y_j}^2, \cdots ,{y_j}^k} \right\}$
. The formula for calculating the new variable is as follows:
 $$\left( {\matrix{ {{y_j}^1} \cr {{y_j}^2} \cr \vdots \cr {{y_j}^k} \cr } } \right) = \left( {\matrix{ {\left( {{x_j}^1,{x_j}^2, \cdots ,{x_j}^m} \right) \bullet {u_j}^1} \cr {\left( {{x_j}^1,{x_j}^2, \cdots ,{x_j}^m} \right) \bullet {u_j}^2} \cr \vdots \cr {\left( {{x_j}^1,{x_j}^2, \cdots ,{x_j}^m} \right) \bullet {u_j}^k} \cr } } \right)$$
where
 $\left\{ {{x_1}^i,{x_2}^i, \cdots ,{x_n}^i} \right\}$
,
 $\left( {i = 1,2, \cdots ,k} \right)$
constitutes a PC, and the wavelength of maximum
 ${u^i}_{\max }$
and minimum
 ${u^i}_{\min }\left( {i = 1,2, \cdots ,k} \right)$
represents the characteristic wavelength. In this study, k = 3, that is, three principal components (PC1, PC2, and PC3) are extracted.
KPCA
In this study, KPCA was used to visualize weed spectral data. KPCA is similar in principle to PCA, but it aims to capture higher-order statistics and deal with complex nonlinear features that are widespread in hyperspectral images. It is a method of processing nonlinear data using kernel mapping; the original data are mapped to a high-dimensional space using a kernel function, and then the corresponding linear operation is carried out in the space. Here, the kernel is
 $k({x_i},{x_j})$
:
 $k({x_i},{x_j}) = \phi {({x_i})^T}\phi ({x_j})$
where
 ${x_i}$
,
 ${x_j}$
 $(i,j = 1,2,3, \ldots ,m)$
represents the original data set;
 $\phi ({x_i})$
,
 $\phi ({x_j})$
 $(i,j = 1,2,3, \ldots ,m)$
represents the high-dimensional data set after the mapping function
 $\phi (x)$
; and m represents the total amount of data.
After the original data are mapped to the high-dimensional space, a dimensionality reduction operation is carried out on the original data according to the eigenvalue
 $\lambda $
and eigenvector
 $v$
of the covariance matrix M of the high-dimensional data set to determine the PC. The formula is as follows:
 $$Mv = \lambda v,\,\,{\rm{subject}}\,{\rm{to}}\,\,\,\parallel v{\parallel ^2} = 1$$
where
 $$M = \left( {\matrix{ {C({x_1},{x_1})} & {C({x_1},{x_2})} & \cdots & {C({x_1},{x_m})} \cr {C({x_2},{x_1})} & {C({x_2},{x_2})} & \cdots & {C({x_2},{x_m})} \cr \vdots & \vdots & \ddots & \vdots \cr {C({x_m},{x_1})} & {C({x_m},{x_2})} & \cdots & {C({x_m},{x_m})} \cr } } \right),$$
, and
 $C({x_i},{x_j})$
,
 $(i,j = 1,2,3, \cdots ,m)$
represents the covariance of
 $\phi ({x_i})$
and
 $\phi ({x_j})$
.
Because the classes in hyperspectral image data are usually very close to gaussian distribution (Huber-Lerner et al. Reference Huber-Lerner, Hadar, Rotman and Huber-Shalem2016), this study adopts a gaussian kernel function for KPCA, and the formula is as follows:
 $$k({x_i},{x_j}) = {e^{ - {{\parallel {x_i} - {x_j}{\parallel ^2}} \over {2{\sigma ^2}}}}}$$
where
 $\sigma $
represents the standard deviation of
 ${x_i}$
and
 ${x_j}$
.
Vegetation Index
The vegetation index is an important index of vegetation growth. Over the past 40 years, many spectral vegetation indices have been developed, such as the simple vegetation index, differential environmental vegetation index, normalized differential vegetation index (NDVI), greenness vegetation index, and soil-adjusted vegetation index (SAVI) (Giovos et al. Reference Giovos, Tassopoulos, Kalivas, Lougkos and Priovolou2021). An ideal vegetation index should contain information that maximizes the specific physical characteristics of the plants (Ji et al. Reference Ji, Zhang, Rover, Wylie and Chen2014). NDVI is the most widely used vegetation index for estimating the physical and growth status of vegetation (Abbas et al. Reference Abbas, Peng, Wong, Li, Wang, Ng, Kwok and Hui2021). It adopts the mid- and near-infrared bands of the hyperspectral spectrum. The formula is as follows:
 $${\rm{NDVI}} = {{{\rho _{{\rm{NIR}}}} - {\rho _{{\rm{RED}}}}} \over {{\rho _{{\rm{NIR}}}} + {\rho _{{\rm{RED}}}}}}$$
where
 ${\rho _{{\rm{NIR}}}}$
represents the spectral value of the near-infrared band and
 ${\rho _{{\rm{RED}}}}$
stands for the infrared spectrum value.
The NDVI is highly correlated with vegetation productivity, plant cover, and amount of green vegetation (Pettorelli et al. Reference Pettorelli, Vik, Mysterud, Gaillard, Tucker and Stenseth2005), and it has a certain relationship with changes in vegetation quality (Hamel et al. Reference Hamel, Garel, Festa-Bianchet, Gaillard and Cote2009). In addition, the NDVI is an indicator of vegetation vigor. Its values range from −1 to +1, while general green vegetation values range from 0.2 to 0.8.
To minimize variations in camera angle and solar illumination (Mottus and Rautiainen Reference Mottus and Rautiainen2013), we also explored the suitability of using the photochemical vegetation index (PRI) to study the differences and associations between 20 weed species. The PRI is based on spectral radiance derived from the normalization of vegetation reflectance near wavelengths of 531 and 570 nm (Equation 3) and is closely related to the photosynthetic intensity of the canopy under nitrogen stress and the lutein cycle (Gamon et al. Reference Gamon, Peñuelas and Field1992).
 $${\rm{PRI}} = {{{\rho _{531}} - {\rho _{570}}} \over {{\rho _{531}} + {\rho _{570}}}}$$
where
 ${\rho _{531}}$
and
 ${\rho _{570}}$
represent the spectral values at 531 and 570 nm, respectively.
CNN Classification for Weed Species Recognition
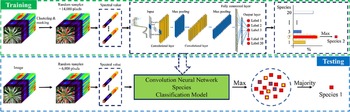
A CNN framework was established to train and validate hyperspectral weed data sets for weed classification. Neural networks are a group of mathematical algorithm models that roughly mimic the human brain. They are designed to process complex data and are being used for an increasing number of functions, with classification being the most important. A shallow CNN has especially good generalization ability and image edge feature recognition ability, and because of its simple structure, it does not require a great deal of computing power (Yang et al. Reference Yang, Liu, Liu and Zhang2020). In this study, a convolution neural network was established to identify hyperspectral images of 40 weed species from 23 families in northeast China. The network structure is shown in Figure 3. The input is the spectral value (spectral curve or spectral band), and the output is the species probability. The CNN consists of an input layer, an output layer, two convolution layers, two pooling layers, and a fully connected layer. The SoftMax function is applied to the output layer to produce probabilities.
Flowchart of the species classification framework modeled using a convolutional neural network.

Each hyperspectral image had a pixel size of 512 × 512 (262,144), and each pixel had a spectral reflectance feature of 204 bands. It was unreasonable to train the CNN using all the pixels of an entire image, as an image contains not only the target weed samples with different growth states but also the background regions and other weed spectral images. Therefore, before the ENVI software was used to extract the spectral curve from hyperspectral images, regions of interest (ROIs) (see Supplementary Figure S1) of target weeds were selected (Tang et al. Reference Tang, Wang, Zhang, He, Xin and Xu2017). An ROI mainly includes weed leaf regions to extract representative target weed spectral curves while excluding the influence of non-weed sample areas on spectral curves. To use the CNN to identify and classify weeds, 20 ROIs were selected for each image, each containing about 1,000 pixels. The neural network consists of two parts: training and testing. In training, a training data set was built with 7/10 sample data from all images. The training data set’s samples each had an input vector and an output vector. The input vector was the spectral curve, and the output vector was the “one-hot coding” vector of the species. First of all, the features of the spectral curve were extracted through the convolution layer. To eliminate the adverse impacts of bad data on the whole sample, batch normalization was adopted. A pooling layer was adopted to reduce redundant data and retain key features. Finally, the full-connection layer and SoftMax function were used to classify and output the features. In testing, the remaining 3/10 weed sample data points were used for separate verification, and the trained model of the CNN was verified. The CNN generated the probability that a weed sample corresponded to a particular weed species. For example, after neural network train and test, weed pixel sample A had a 70% probability of being weed species A, a 20% probability of being weed sample B, and a 5% probability of being weed sample C. So, each pixel was labeled with the name of the species with the highest probability. This allowed each sampled pixel in an image to be assigned to a certain species, with the image as a whole being assigned to a particular species based on the majority of sampled pixels.
Precision Evaluation
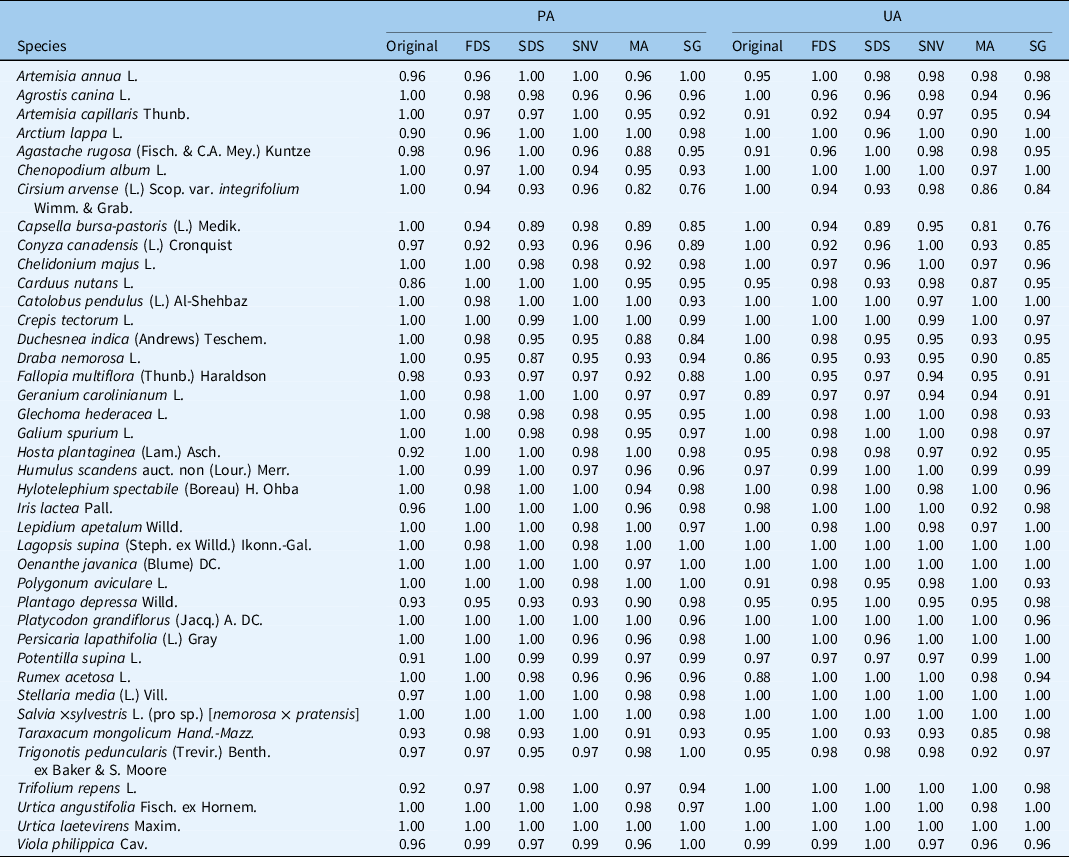
In this study, six performance evaluation indexes commonly used in deep learning were used to verify the performance of the model to judge the classification performance of various weeds, including: train accuracy (TA), test accuracy (TEA), average accuracy (AA), kappa coefficient (Kappa), producer’s accuracy (PA), and user’s accuracy (UA). TA and TEA represent the ratio between the correctly classified samples and the total number of samples in the train set and the test set, respectively. AA represents the average of the ratio of the number of samples correctly predicted for all weed species in the test set to the actual number of samples. Kappa is often used to measure the degree of match between the predicted sample and the actual sample (Zahisham et al. Reference Zahisham, Lim, Koo, Chan and Lee2023). PA represents the probability that a class is correctly identified, while UA represents the probability that the classifier correctly classifies the samples belonging to a particular category (Cao et al. Reference Cao, Liu, Liu, Zhu, Li and He2019). The formulas are as follows:
 $${\rm{TA}} = {{\sum\limits_{i = 1}^n {{x_{ii}}} } \over {\sum\limits_{i = 1}^n {\sum\limits_{j = 1}^n {{x_{ij}}} } }}$$
 $${\rm{TEA}} = {{\sum\limits_{i = 1}^n {{y_{ii}}} } \over {\sum\limits_{i = 1}^n {\sum\limits_{j = 1}^n {{y_{ij}}} } }}$$
 $${\rm{AA}} = {1 \over n}\sum\limits_{i = 1}^n {{{{y_{ii}}} \over {\sum\limits_{j = 1}^n {{y_{ij}}} }}} $$
 $${\rm{Kappa}} = {{\sum\limits_{i = 1}^n {\sum\limits_{j = 1}^n {{y_{ij}}} } \times \sum\limits_{i = 1}^n {{y_{ii}}} - \sum\limits_{\scriptstyle i = 1 \atop \scriptstyle i = j } ^n {(\sum\limits_{i = 1}^n {{y_{ij}}} \times \sum\limits_{j = 1}^n {{y_{ij}}} )} } \over {{{(\sum\limits_{i = 1}^n {\sum\limits_{j = 1}^n {{y_{ij}}} } )}^2} - \sum\limits_{\scriptstyle i = 1 \atop \scriptstyle i = j } ^n {(\sum\limits_{i = 1}^n {{y_{ij}}} \times \sum\limits_{j = 1}^n {{y_{ij}}} )} }}$$
 $${\rm{P}}{{\rm{A}}_i} = {{{y_{ii}}} \over {\sum\limits_{j = 1}^n {{y_{ij}}} }}$$
 $${\rm{U}}{{\rm{A}}_j} = {{{y_{jj}}} \over {\sum\limits_{i = 1}^n {{y_{ij}}} }}$$
where n represents the total number of categories;
 $i = 1,2,3, \cdots ,n$
, represents the number of categories of real samples;
 $j = 1,2,3, \cdots ,n$
, represents the number of categories of prediction samples;
 ${x_{ij}}$
represents the number of samples in the train set where the real class is class i, but the prediction class is class j;
 ${x_{ii}}$
represents the number of samples in the train set that are both true and predicted to be of class i;
 ${y_{ij}}$
represents the number of samples of the prediction set where real class is class i, but the prediction class is class j.
 ${y_{ii}}$
represents the number of samples in the prediction set that are both true and predicted to be of class i.
 ${\rm{P}}{{\rm{A}}_i}$
represents PA of class i weeds,
 ${\rm{U}}{{\rm{A}}_j}$
represents the UA of class j weeds.
Results and Discussion
Analysis of the Spectral Reflectance Curves of Different Weeds
After weed sample data were collected in the field, the species of weeds and the families to which they belong were determined. ENVI software was used to extract and plot spectral reflectance curves of the weeds, and PCA was performed in the wavelength range of 397 to 981 nm.
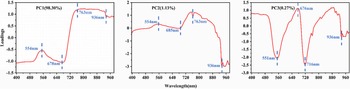
The loading plot in Figure 4 shows the spectral characteristics of various weeds. The first three PCs accounted for 99.7% of the total sample variance, indicating that they represent most of the information on weed types. According to the component score coefficient matrix in Supplementary Table S1, among the three PCs, PC1 was closely related to four weed species, namely, Indian strawberry [Duchesnea indica (Andrews) Teschem.], stony stonecrop [Hylotelephium spectabile (Boreau) H. Ohba], P. supina, and Chinese violet (Viola philippica (Cav.). PC2 was mainly affected by horseweed [Conyza canadensis (L.) Cronquist], H. spectabile, woodland sage [Salvia ×sylvestris L. (pro sp.) [nemorosa × pratensis]; syn.: Salvia nemorosa L.], and white clover (Trifolium repens L.), while PC3 mainly reflected the spectral characteristics and related characteristic peaks of huo xiang [Agastache rugosa (Fisch. & C.A. Mey.) Kuntze], H. spectabile, bai hua ma lin (Iris lactea Pall.), and garden sorrel (Rumex acetosa L.). The peaks and troughs in the figure provide the main characteristic wavelengths of the weed spectrum. The loading diagram for PC1 shows that the loading gradually increases from blue-violet light to infrared light and peaks at 936 nm, indicating that weeds mainly absorb blue-violet light and absorb little of longer wavelengths, especially in the near-infrared region. The PC1, PC2, and PC3 loading diagrams show obvious peaks and troughs at 554 nm, 678 nm, 763 nm, and 936 nm, as well as in nearby wavelength regions, and they show different forms in different loading diagrams. In particular, the PC3 loading pattern is more prominent, which shows that the characteristics of A. rugosa, H. spectabile, I. lactea, and R. acetosa are more special than other weeds at 554 nm, 678 nm, 763 nm, and 936 nm.
The results of the principal component analysis in the wavelength range of 397–981 nm.

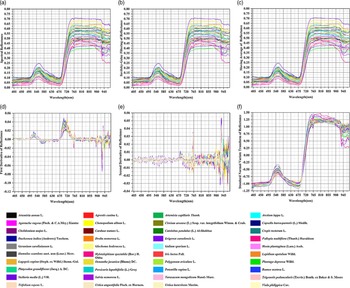
Figure 5 shows the mean spectra of various weeds after QUAC and the spectral curves after various pretreatment methods, including the true characteristics of weed samples after removing radiation errors caused by atmospheric effects such as atmospheric absorption and scattering. It can be seen that the spectral shapes of the different weed samples are almost the same, indicating that different weed species absorb similar light in different bands. This may be due to the green color of weed leaves. As shown in Figure 5, the characteristic wavelengths of various weeds appear at 551 nm, 678 nm, 760 nm, 935 nm, and nearby wavelength regions, which is consistent with the PCA results and is mainly related to the structure of the weeds’ leaf tissues (Oerke et al. Reference Oerke, Herzog and Toepfer2016). In most normal green plants, the pigments in the leaves are mainly chlorophyll and carotenoid, with few to no other flavonoid pigments. Chlorophyll mainly absorbs blue-violet and red light and partially absorbs green light, so the overall color of the leaves appears green. In addition, in the original spectral curve, there are two absorption valleys in the bands of 397 to 504 nm and 678 nm, while there is a small reflection peak near 551 nm. The 678-nm band and its vicinity is one of the most commonly used bands for discriminating crop classes and has proven to be important in the study of crops (Cho et al. Reference Cho, Debba, Mathieu, Naidoo, Van Aardt and Asner2010; Eddy et al. Reference Eddy, Smith, Hill, Peddle, Coburn and Blackshaw2014; Fassnacht et al. Reference Fassnacht, Neumann, Forster, Buddenbaum, Ghosh, Clasen, Joshi and Koch2014; Mariotto et al. Reference Mariotto, Thenkabail, Huete, Slonecker and Platonov2014). The FDS of the 721-nm band and nearby areas is particularly significant, as it is located in the red margin area of 680 to 780 nm and is closely related to chlorophyll content and contains rich physiological information (such as water content) (Farquhar et al. Reference Farquhar, Von Caemmerer and Berry1980). In addition, in the reflectance curve, the infrared light band has high reflectance, which is related to the fact that infrared light does not readily produce photosynthesis. In the near-infrared region, the spectral reflectance of most weed species shows a trend of gradual increase and dynamic stability. The gradual declines in Carolina geranium (Geranium carolinianum L.), H. spectabile, balloon-flower [Platycodon grandiflorus (Jacq.) A. DC.], and other species are speculated to be due to changes in leaf structure or the collapse of mesophyll structure caused by abiotic stress (such as water-deficit stress) (Li et al. Reference Li, Gao and Li2022; Lou et al. Reference Lou, Quan, Sun, Li and Xia2022). This leads to increased infrared light absorption by plants. Furthermore, reduced fluorescence energy near the 760-nm wavelength may also be a sign of a decline in the photosynthetic process. When solar energy is absorbed by chlorophyll, it is used to fix carbon and dissipate heat before emitting at a longer wavelength as chlorophyll fluorescence (Krause and Weis Reference Krause and Weis1991). On the other hand, there is an absorption valley in the original spectral curve at 935 nm. This sharp decline in spectral reflectance indicates that the reflectance of the band with wavelengths >935 nm is not affected by the structure of the leaf itself. The higher the proportion of water in plants, the lower the spectral reflectance in the near-infrared ray (NIR) band (780 to 1,300 nm) (Zhang et al. Reference Zhang, Wu and Wang2022). It is inferred that the decrease in spectral reflectance at 935 nm may be caused by cell fluid, the cell membrane, absorbed water, and carbon dioxide emissions from the leaves (Qu et al. Reference Qu, Sun, Cheng and Pu2018).
Spectral curves for all weed species collected in in Heilongjiang Province, northeast China: (A) original and with pretreatment, (B) Savitzky-Golay smoothing, (C) moving averages, (D) first derivative spectrum, (E) second derivative spectrum, and (F) standard normal variate.

Within a certain range, the higher the chlorophyll content, the greater the efficiency of light energy conversion. At the same time, chlorophyll mainly absorbs blue-violet and red light and absorbs almost no green light. The green region reflectance, which indicates the chlorophyll content, is the basis for inferring the strength of photosynthesis. Of all the weed species, common chickweed [Stellaria media (L.) Vill.] has the highest reflectivity in the green area, with stickywilly (Galium spurium L.) second and H. spectabile having the least. However, this does not directly reflect the strength of photosynthesis, which is not only affected by chlorophyll but also by other factors such as enzyme activity, water, and leaf structure (Zhang et al. Reference Zhang, Cao, Sack, Li, Wei and Goldstein2015; Zhang et al. Reference Zhang, Pu, Tang, Zhang and Lv2019a). The spectral curves of the weeds show that almost all the green and infrared areas show high reflectance, while the blue-violet and red-orange areas show low reflectance, which makes it difficult to distinguish between species. Hence, further clustering and visualization of the different weed species using PCA are needed.
KPCA
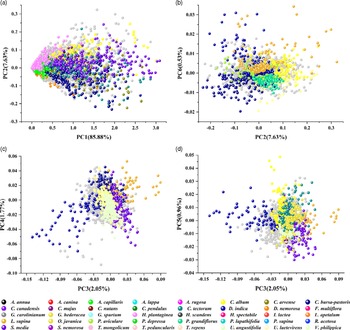
In this study, KPCA was used to extract six PCs from the high-dimensional hyperspectral data to evaluate the relationship between the original hyperspectral data samples. The results show that the six PCs accounted for 98.83% of the total sample variance, indicating that they represent most of the characteristic information of the weed samples. Figure 6 shows the KPCA score plots of the hyperspectral images of various weeds clustered under different PC combinations. The PC1–PC2 score plot (Figure 6A) shows that various types of weeds clustered in a certain range, but all weed clusters show differences. Meanwhile, PC2 and PC3 are linearly correlated for most weeds. In the PC2–PC6 score plot (Figure 6B), the clusters of lambsquarters (Chenopodium album L.), shepherd’s purse [Capsella bursa-pastoris (L.) Medik.], D. indica, ground ivy (Glechoma hederacea L.), lagopsis supina [Lagopsis supina (Steph.) Ikonn.-Gal.], prostrate knotweed (Polygonum aviculare L.), and P. grandiflorus are not well separated. The clusters of D. indica and L. supina are mainly concentrated in the first and second quadrants, while those of C. bursa-pastoris, G. hederacea, and P. grandiflorus are clustered in the negative area of PC6. The PC3–PC4 score plot (Figure 6C) shows the clustering separation among the categories of C. bursa-pastoris, D. indica, G. hederacea, L. supina, S. media, and V. philippica. The clusters of C. bursa-pastoris and L. supina are mainly clustered in the first and second quadrants, which are effectively distinguished from those of D. indica. In the PC3–PC5 score plot (Figure 6D), clusters are identified for the categories of C. album, narrowleaf hawksbeard (Crepis tectorum L.), D. indica, L. supina, Java waterdropwort [Oenanthe javanica (Blume) DC.], S. media, and V. philippica. In this case, their clusters are very close and are not clearly separated. Based on the this information and KPCA score maps, we can determine that all species of weeds show differences. But the clusters of various weeds are concentrated in the same areas, so it is not possible to distinguish all categories clearly. It is possible to reduce the dimensions and visualize the existing data. However, it is not possible to mine further information from the KPCA about the growth status and health status of the weeds, so it is necessary to analyze the existing spectral characteristics from many aspects, such as the vegetation index.
Hyperspectral images highlighting the classes clustered in the corresponding kernel principal component analysis (KPCA) score plots: (A) PC1–PC2, (B) PC2–PC6, (C) PC3–PC4, and (D) PC3–PC5. See Figure 1 for full species names.

Vegetation Index Analysis
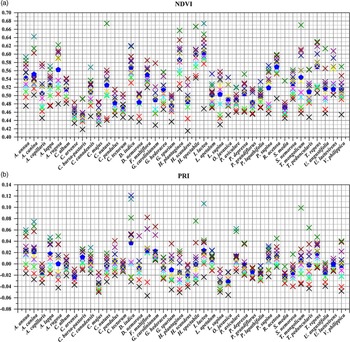
Vegetation indices were used to study the differences in the growth status and physiological activity of various weeds. Figure 7 shows the changes in NDVI and PRI among different weed species. In Figure 7A, the NDVI values reflect plant growth and physiological conditions (Bai et al. Reference Bai, Gao and Zhang2019), indicating that the various weeds have different growth levels. The NDVI of I. lactea is the highest, followed by those of H. spectabile and fragrant plantain lily [Hosta plantaginea (Lam.) Asch.], while those of C. bursa-pastoris and celandine (Chelidonium majus L.) are the lowest, indicating that the physiological status of I. lactea was the highest. Capsella bursa-pastoris and C. majus were the weakest, which may be related to the appearance and growth environment of these weeds. The NDVIs of C. album, G. hederacea, urtica angustifolia (Urtica angustifolia Fisch. ex Hornem.), urtica laetevirens (Urtica laetevirens Maxim.), and V. philippica are similar, indicating that the growth of these weeds was similar. In Figure 7B, the PRI indicates the lutein content (Frechette et al. Reference Frechette, Chang and Ensminger2016). Compared with the NDVI in Figure 7A, the PRI values are more stable, indicating that the lutein content in the various weeds was extremely low. This may be because the chlorophyll content of weeds increases sharply with vigorous growth, while the rate of light utilization increases gradually, thus inhibiting the secretion of lutein. It is worth noting that in the PRI diagram of all weed species, the lutein of D. indica is the highest, which is speculated to be related to the regulation of pigment regeneration and the size of the circulating pigment pool (Xiao et al. Reference Xiao, He, Ma, Lu, Bai, Bai and Wu2018). However, due to the influences of environmental and other factors in the process of data collection, enzyme activities cannot be completely distinguished according to the vegetation index, so it was necessary to use the CNN to classify the different kinds of weeds.
Vegetation indices for all weeds collected in in Heilongjiang Province, northeast China: (A) normalized difference vegetation index (NDVI) and (B) photochemical reaction index (PRI). For each species, the mean vegetation index (represented by blue pentagons) is derived from all samples of a species (each image is represented by a different color). The x-axis label shows the species names (see Figure 1 for the full names), and the y-axes represent NDVI or PRI.

CNN Classification of Weed Species
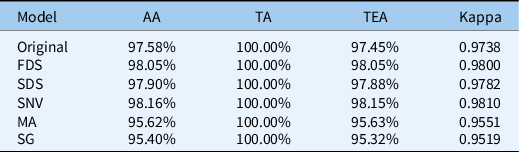
Tables 1 and 2 show the model TA, TEA, AA, Kappa, PA, and UA of classification inference under the different pretreatment methods. All models show very high accuracy in train and test. The individual model has a TA of 100% and the TEA values range from 95.32% to 98.15%. The TEA values for all pretreatment methods and original data were >95%, among which the TEA values for SNV were the highest. Specifically, among all the pretreatment methods, the accuracy using the FDS, SDS, and SNV methods was higher than accuracy achieved using the original data, while the accuracy using the two smoothing algorithms (MA and SG) was lower, and the AA and kappa coefficients showed similar trends. It should be noted that the overall classification accuracy generated by SG was the lowest among the five pretreatment methods, being 2.13% lower than the original data, while the TEA of MA was 1.82% lower than the original data. The results show that the smoothing algorithms can easily cause distortion in the process of processing spectral data, especially SG. At the same time, it can be seen that the precision of the differential spectrum is higher than that of the original spectral data, indicating that the differential spectrum can extract the features of weed spectral data very well.
Overall accuracy of all species identification models. a

a Abbreviations: AA, average accuracy; FDS, first derivative spectrum; Kappa, kappa coefficient; MA, moving averages; SDS, second derivative spectrum; SG, Savitzky-Golay smoothing; SNV, standard normal variate; TEA, test accuracy; TA, train accuracy.
Producer’s accuracy (omission error) and user’s accuracy (delegation error) using convolutional neural network classification to identify species collected in Heilongjiang Province, northeast China. a

a Abbreviations: FDS, first derivative spectrum; MA, moving averages; PA, producer’s accuracy; SDS, second derivative spectrum; SG, Savitzky-Golay smoothing; SNV, standard normal variate; UA, user’s accuracy.
Table 2 shows the PA (omission error) and UA (delegation error) for species classification using CNNs. Most species have high PA and UA (100%). However, the lower accuracy of some species is consistent with a smaller sample size used for species identification (Figure 1). This means that larger samples or more samples per species could be considered in future studies. Another option would be to use high-resolution hyperspectral images obtained from UAVs. It is crucial to note that extracting 20,000 pixels from each sample of 435 images can cause autocorrelation problems. However, the CNN method adopted in this study has the ability to self-learn to discriminate between samples for classification. Meanwhile, increasing the sample size and amount of input data can lead to higher accuracy. However, care should be taken when identifying species using conventional classification methods.
In this study, we combined data on the physiological activity of weeds with hyperspectral characteristics of weeds and obtained spectral data with low noise and effective information using different pretreatment methods. This allowed 40 species of weeds in an urban ecosystem to be distinguished. The results of the CNN for species identification demonstrated that the spectral library based on weed reflectance showed a good ability to identify weed species. The TEA of the original spectral data of weeds was 97.45%, in which SNV was used to obtain the largest TEA and Kappa coefficients of 98.15% and 0.9810, respectively. The classification results highlight the potential use of ground-based hyperspectral camera data for vegetation research, particularly for weed identification and the establishment of specific spectral libraries for various vegetation and crop species. In recent years, researchers have developed advanced techniques to improve the accuracy of weed identification. Farooq et al. (Reference Farooq, Jia, Hu and Zhou2019) proposed a feature extraction method, FCNN-SPLBP, using a multilayer fused convolution neural network (FCNN) and a superpixel-based local binary pattern (SPLBP). FCNN was used to extract textural features from superpixels as input of a support vector machine for weed classification. The recognition accuracy was 89.7%, and the performance was better than that of CNN, LBP, FCNN, and SPLBP. Tang et al. (Reference Tang, Wang, Zhang, He, Xin and Xu2017) constructed a weed recognition model based on K-means feature learning combined with CNNs. The accuracy is 92.89%, 1.82% higher than that of the randomly initialized CNN and 6.01% higher than that of the two-layer network without fine tuning. Wei et al. (Reference Wei, Bai, Zhang and Wu2014) used canonical discriminant analysis and a partial least squares-discriminant analysis (PLS-DA) model to identify broadleaf grass species with an accuracy of 90.91%. It should be noted that broadleaf species are easier to identify than narrow-leaved ones, because of more uniform spectral data collection (Li et al. Reference Li, Al-Sarayreh, Irie, Hackell, Bourdot, Reis and Ghamkhar2021). This study not only distinguishes broadleaf grass species, but also identifies narrow-leaved ones. The accuracy of weed identification using hyperspectral imaging technology and a CNN was 98.15%, which is 8.45% higher than identification using FCNN-SPLBP, and 5.26% higher than identification using a weed recognition model based on K-means feature learning combined with a CNN. It is 7.24% higher than identification using canonical discriminant analysis and a PLS-DA model. The results show that the convolutional network classification model established in this study is superior to other techniques for vegetation identification. It is worth noting that shallow CNN has better classification performance than deep neural networks, and it is easier to apply in practical situations due to its simple structure and fast running speed (Han et al. Reference Han, Zhu, Liu, Zhang and Xie2020).
The PA, UA, and overall accuracy of each classification model shows that the preprocessing method has a great influence on species identification based on hyperspectral images. In this paper, the three preprocessing methods based on the original data—FDS, SDS, and SNV—obtained the highest predictive accuracy, while the two smoothing algorithms were less accurate. The results show that, compared with FDS, SDS, and SNV, the smoothing algorithms were prone to distortion and not suitable for distinguishing weed species or challenging classification scenarios, and the difference in spectral characteristics was not significant. Other pretreatment methods can be used to improve the predictive accuracy. On the other hand, the PA and UA were low for many weeds, especially D. nemorosa, probably because it was the least-sampled of all weeds. This indicates that increasing the number of samples may improve the PA and UA for other species. Of all species, C. canadensis was the easiest to identify, probably because of its leaf structure (Li et al. Reference Li, Al-Sarayreh, Irie, Hackell, Bourdot, Reis and Ghamkhar2021). It is important to note that this species had the most samples collected overall. According to the data obtained using the original spectrum, PCA, and the differential spectrum, 554 nm, 678 nm, 763 nm and 936 nm and their adjacent spectral bands are considered to be the most prominent bands reflecting the characteristics of weeds. They can indirectly reflect the physiological activity of weeds and could play a key role in weed recognition.
In addition to the weeds’ species and physiological activity, their spectral characteristics may also vary according to environmental conditions. In urban ecosystems, different soil and climate conditions can lead to different growth conditions and the presence of different weed species (Carlesi et al. Reference Carlesi, Bocci, Moonen, Frumento and Barberi2013; Steponaviciene et al. Reference Steponaviciene, Marcinkeviciene, Butkeviciene, Skinuliene and Boguzas2021). For example, hyperspectral analysis of 48 experimental plots of temperate species showed a significant relationship between growth characteristics and spectral characteristics at different soil nitrogen concentrations, with broadleaf grasses being particularly responsive to nitrogen (Jabran and Doğan Reference Jabran and Doğan2020; Waheed et al. Reference Waheed, Bonnell, Prasher and Paulet2006). Another study showed that there were significant differences in the canopy reflectance characteristics of weeds in environments with different temperatures. Higher temperatures increased the amplitude and variability of leaf reflectance in the 480- to 670-nm region, while the opposite effect occurred in the 720- to 810-nm region (Zhang and Slaughter Reference Zhang and Slaughter2011). As reported in a recent study, higher temperatures cause plants to distribute more biomass to their stems, causing their leaves to expand and promoting light capture and assimilation (Zhang et al. Reference Zhang, Zhang, Peng and Zobel2014). In addition, the vegetation index may change with the change of weed growth stage. A vegetation index shows statistical differences in different weed phenological stages and provides a valuable reference for the differentiation of weeds in different growth periods (Pena-Barragan et al. Reference Pena-Barragan, Lopez-Granados, Jurado-Expoosito and Garcia-Torres2006). Due to the limitations of the conditions, the current study did not consider the physiological activity of various weeds in different growing environments and growth periods. Future studies can close this gap by targeting different growth stages of a few more common weed species that grow in different environments.
This study investigated the application of hyperspectral images to accurately classify urban weeds. The model generated can be altered and updated to effectively change species composition, community structure, and functional characteristics of weeds through continuous detection and control to adapt to the process of urbanization. It can be applied to identify relationships between urbanization and ecological/environmental impacts and can be used to support intensive urbanization while protecting the ecological environment. It also can be used to identify invasive plants and prevent them from adversely affecting native flora and fauna, public health, and ecosystem services. In addition, the results acquired from hyperspectral imagery give superior accuracy (97.29%) when compared with results from studies that used multispectral data in urban contexts (Hahn et al. Reference Hahn, Roosjen, Morales, Nijp, Beck, Cruz and Leinauer2021). Many studies have shown that hyperspectroscopy improves the accuracy of weed mapping by providing finer spectral resolution (Che’Ya et al. Reference Che’Ya, Dunwoody and Gupta2021; Lauwers et al. Reference Lauwers, De Cauwer, Nuyttens, Cool and Pieters2020). In addition, Ferreira et al. (Reference Ferreira, Zortea, Zanotta, Shimabukuro and De Souza Filho2016) showed that when short-wave infrared (SWIR) bands are combined with visible/near-infrared (VNIR) bands to map vegetation, the accuracy is improved by 14% to 17%, while the accuracy of hyperspectral data is 15% higher than that possible with multispectral VNIR and SWIR images. Cho and Lee (Reference Cho and Lee2014) also noted that SWIR offers an additional benefit for classifying vegetation. Therefore, through the addition of hyperspectral SWIR imaging, future investigations of urban weed species identification could profit from this versatility.
In this study, hyperspectral images of 40 species of weeds from 23 families were obtained using terrestrial hyperspectral remote sensing technology. A total of 435 hyperspectral images were obtained. Various preprocessing methods (FDS, SDS, SNV, MA, and SG) were used to maximize the retention of spectral characteristics while removing the influence of noise. The spectral profile, PCA, and spectral reflectance curves of all weed species in different bands were analyzed, and the characteristic wavelengths of weeds were obtained, including 554 nm, 678 nm, 763 nm, and 936 nm. These bands reflect the different physiological activities of different weed species, such as A. rugosa, C. nutans, T. repens, and other species. The differences in NDVI and PRI of different species of weeds were analyzed. The results showed that the two vegetation indexes had the same trend, but the wide-band vegetation index was more beneficial for the detection and evaluation of vegetation status than the narrow-band vegetation index. However, using a vegetation index for high-precision vegetation monitoring is a challenging task. Additionally, a framework for a CNN was established to identify species from hyperspectral data. The results show that the CNN method has high accuracy, and the classification results of different pretreatment methods range from 95.32% to 98.15%, in which SNV+CNN achieves the best effect. The results of this study can be the basis for a recommendation to develop a spectral library for monitoring physiological activity and species identification of various weeds in northeast China. It is also a representative study of mesotemperate weed species with high diversity in an intense urban environment with a plains topography.
Supplementary material
The supplementary material for this article can be found at https://doi.org/10.1017/wsc.2023.36
Data availability
Data will be made available on request.
Acknowledgments
This work was supported by China’s National Key R & D Plan (2021YFD200060502; 2018YFD0300105; 2016YFD0300909). The authors declare that they have no known competing financial interests or personal relationships that could have appeared to influence the work reported in this paper.