1 Introduction
Statistical performance and interpretability are desirable attributes for any modeling approach, particularly in social science research. As ongoing political commentary reminds us, both academic and broader communities care about whether predictions are accurate, robust, and interpretable. In some applications, prediction may be a goal in and of itself, whether or not the model in question illuminates underlying causal mechanisms. However, even in these settings, interpretability is a helpful trait, allowing researchers to check assumptions and guard against overfitting.
Unfortunately—but unsurprisingly—modeling strategies that excel at these criteria often exhibit severe scalability constraints. For a concrete example, consider the Hainmueller and Hazlett (Reference Hainmueller and Hazlett2013) Kernel-Regularized Least Squares (KRLS) approach. KRLS offers a desirable balance of interpretability, flexibility, and theoretical guarantees, primarily through the pointwise marginal effects estimates and their corresponding averages. However, pointwise marginal effects are costly to estimate in both time and memory, whether via KRLS or through related techniques such as Bayesian additive regression trees (Chipman et al. Reference Chipman, George and McCulloch2010) or LASSOplus (Ratkovic and Tingley Reference Ratkovic and Tingley2017). As a result, optimization (both in memory and speed) is important to make KRLS a practical choice in many applied settings.
In this paper, we present a series of improvements designed to improve KRLS’s statistical performance, speed, and memory usage, which we implement in the bigKRLS package. Compared with the original KRLS library,Footnote
1
our algorithm decreases runtime by approximately 75%Footnote
2
and reduces peak memory usage by approximately an order of magnitude. These improvements allow users to straightforwardly fit models via KRLS to larger datasets (N
 ${>}$
3,500) on personal machines, which was not possible using existing implementations. We also develop an updated significance test for the average marginal effect (AME) estimates—which we justify both theoretically and in simulation—and a new inferential statistic designed to help identify the presence of heterogeneous effects.
After describing our methodological contributions, we illustrate the practical utility of bigKRLS through an extended examination of the so-called “communities in crisis” explanation for the 2016 presidential election. Our estimates—which are robust both to our significance correction and to a series of cross-validations—straightforwardly address hypotheses advanced by postelection commentary. Due to sample size constraints, the model we estimate would have been impractical to fit on a personal computer using the original KRLS algorithm, but runs smoothly with bigKRLS, highlighting the importance of optimization work for applied political science tasks.
2 Data Science as Interpretability versus Complexity
2.1 Desirable estimator properties
When selecting an estimator, there are an array of properties that we might value. For example, we might want our estimator to be unbiased or efficient, or we might want it to minimize some particular loss function (e.g., mean squared error). In theoretical settings, we generally assume that our model of interest captures the “true” data-generating process; however, in applied settings, we are usually—and, often, rightly—skeptical of such assumptions. As a result, we also want estimators to be robust against violations of potentially problematic modeling assumptions (e.g., incorrect functional form or omitted variables). For this reason, we sometimes place a premium on predictive accuracy against held-out test data.
Besides these traits, however, we also favor models whose results are easily interpreted. Compared with the traits described above, “interpretability” does not possess a particularly precise definition. However, we can colloquially view a model as more “interpretable” to the extent that its estimates allow researchers to answer useful questions with minimal additional effort. A model like linear regression, for example, directly estimates coefficients that offer information about the marginal effect of some covariates
 $\mathbf{X}$
on a dependent variable
 $\mathbf{y}$
. By contrast, prediction-oriented models like random forests (Breiman Reference Breiman2001) offer more limited options. If a researcher wishes to learn about the data-generating process using a random forest, her choices are either to inspect relatively uninformative summary statistics such as variable importance or to generate first difference estimates for particular values of interest through perturbations of the input data.
Many attributes of a model can influence its interpretability. For example, models that offer simple, familiar estimates such as average treatment effect estimates alongside more nuanced counterparts can make their contents more accessible, serving readers with different backgrounds and levels of experience. Similarly, modeling strategies that reduce the number of nonzero effect estimates or the complexity of their functional form tend to ease interpretation. Regularization constraints—that are explicitly designed allow researchers to ignore some parameters by shrinking their values to or near zero (Hastie, Tibshirani, and Wainwright Reference Hastie, Tibshirani and Wainwright2015)—offer a direct example of this kind of strategy.Footnote 3
Importantly, we do not mean to suggest that these are the only traits that contribute to model interpretability, or that interpretability (however defined) is the only standard by which a model ought to be judged. Depending on the application, researchers might be willing to employ a less interpretable model in exchange for improved predictive performance or model fit. In general, however, we argue that all of these traits represent important modeling goals, which need to be balanced in context.
2.2 The complexity frontier
Unfortunately, estimators that excel at both interpretability and prediction in the face of challenging data-generating processes are often highly complex. Here, we use “complexity” in the algorithmic sense, referring to the CPU and memory resources needed to estimate a model given the size of the inputs (Papadimitriou Reference Papadimitriou2003). Algorithmic complexity is usually represented using order notation: so, an
 $O(N)$
algorithm is one whose complexity grows linearly with
 $N$
, and an
 $O(\log (N))$
algorithm is one whose complexity grows logarithmically with
 $N$
.Footnote
4
For example, linear regression with
 $N$
observations and
 $P$
covariates has complexity approximately
 $O(P^{2}N)$
(since calculating
 $\mathbf{X}^{\prime }\mathbf{X}$
dominates other calculations involved in generating
 $\hat{\unicode[STIX]{x1D6FD}}_{OLS}$
).Footnote
5
Since
 $N$
is usually much larger than
 $P$
, estimating a linear model via Ordinary Least Squares (OLS) has complexity which is approximately linear with respect to
 $N$
.
Compared with other approaches, under appropriate assumptions linear regression directly calculates causally interpretable effects, but is sensitive to model specification choices and possesses poor predictive performance. On the other end of the spectrum, decision trees do not calculate causally interpretable effect estimates, but are highly flexible, make few assumptions about the data-generating process, and often possess excellent out-of-sample performance. In exchange for these desirable properties, however, decision trees are substantially more complex than ordinary linear regression. In rough terms, a single decision tree has complexity
 $O(N\log (N)^{2})+O(PN\log (N))$
.Footnote
6
Generally, decision trees perform better when used in an ensemble approach such as a random forest (Breiman Reference Breiman2001), leading users to generate hundreds or thousands of such trees for any given application.
Models that attempt to optimize all of these traits simultaneously quickly encounter what we might call the computational complexity frontier. Flexibility with respect to functional form, sparsity constraints, and related modeling strategies all impose a substantial computational burden, rendering them impractical for particularly large datasets. Importantly, in many applications, interpretability also factors into this tradeoff. Again, regularization strategies (e.g., LASSO) and cross-validated parameter selection approaches offer canonical examples of this relationship.Footnote 7
3 Complexity and Interpretability with KRLS
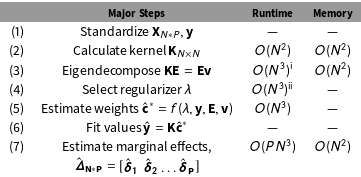
Kernel regularization techniques have a long history in the computer science and statistics literatures (Rifkin, Yeo, and Poggio Reference Rifkin, Yeo and Poggio2003; Yu, Xu, and Gong Reference Yu, Xu, Gong, Koller, Schuurmans, Bengio and Bottou2009).Footnote 8 Hainmueller and Hazlett (Reference Hainmueller and Hazlett2013) demonstrate that this approach is useful for inference as well as prediction, primarily through the derivative estimators they derive. However, the approach they present also offers a stark example of the tradeoffs between statistical performance, interpretability, and complexity we describe in the previous sentence (see Table 1). To build intuition, we briefly discuss key features of the KRLS approach in this section.Footnote 9
3.1 An overview of KRLS
Begin by considering the following model:
 $$\begin{eqnarray}\mathbf{y}_{i}=c_{1}k(\mathbf{X}_{i},\mathbf{X}_{1})+c_{2}k(\mathbf{X}_{i},\mathbf{X}_{2})+\cdots +c_{N}k(\mathbf{X}_{i},\mathbf{X}_{N})+\unicode[STIX]{x1D750}_{i},\end{eqnarray}$$
where
 $\mathbf{c}$
represents a vector of coefficients and
 $k$
represents a kernel function that quantifies the pairwise similarity between two vectors of data. Defining
 $\mathbf{K}$
as a matrix of such similarity values, we can express the model for the full sample as:
 $$\begin{eqnarray}\mathbf{y}=\mathbf{Kc}+\unicode[STIX]{x1D750}.\end{eqnarray}$$
Viewed from this perspective, this model treats the dependent variable as a linear and additive combination of the pairwise similarity between a given observation and each other observation in the dataset, as calculated using the predictor matrix
 $\mathbf{X}$
. These similarity values are then weighted by a set of so-called “choice coefficients”
 $\mathbf{c}$
, which serve to weight observations based on their influence on the conditional expectation function.
In principle, any similarity kernel function
 $k$
can be used to estimate the model, but we focus here on the Gaussian kernel:Footnote
10
 $$\begin{eqnarray}k(\mathbf{X}_{i},\mathbf{X}_{j})=e^{-||\mathbf{X}_{i}-\mathbf{X}_{j}||^{2}/\unicode[STIX]{x1D70E}^{2}},\end{eqnarray}$$
where
 $||\mathbf{X}_{i}-\mathbf{X}_{j}||$
denotes Euclidean distance and
 $\unicode[STIX]{x1D70E}^{2}$
denotes a researcher-specified bandwidth parameter. In practice, Hainmueller and Hazlett (Reference Hainmueller and Hazlett2013) recommend setting
 $\unicode[STIX]{x1D70E}^{2}=P$
(the number of predictor variables), which we adopt throughout this paper.
Overview of the KRLS estimation procedure.

Letting
 $i,j$
index observations such that
 $i,j=1,2\ldots N$
ultimately captures all pairs and letting
 $p=1,2,\ldots P$
index the explanatory
 $x$
variables. Note steps 4–6 are followed by uncertainty estimates, for which closed-form estimates also exist along with proofs of a number of desirable properties such as consistency (Hainmueller and Hazlett Reference Hainmueller and Hazlett2013).
 $^{\text{i}}$
Using worst-case results for a divide-and-conquer algorithm, which we employ here (Demmel Reference Demmel1997, p. 220–221). For runtime improvements via eigentruncation, see Section 4.2.1.
 $^{\text{ii}}$
Using Golden Section Search given
 $\mathbf{y}$
,
 $\mathbf{E}$
, and
 $\mathbf{v}$
. Note that this value also depends on a tolerance parameter, which is set by the user.
Since this model involves estimating one parameter for each observation, to rule out degenerate solutions we replace
 $\mathbf{c}$
with
 $\mathbf{c}^{\ast }$
, where
 $\mathbf{c}^{\ast }$
is defined using a Tikhonov regularization strategy:
 $$\begin{eqnarray}\mathbf{c}^{\ast }=\underset{c\in \mathbb{R}^{P}}{\text{argmin}}[(\mathbf{y}-\mathbf{Kc})^{\prime }(\mathbf{y}-\mathbf{Kc})+\unicode[STIX]{x1D706}\mathbf{c}^{\prime }\mathbf{Kc}].\end{eqnarray}$$
Here
 $\unicode[STIX]{x1D706}$
is a regularization parameter, selected to minimize leave-one-out loss. As we document in Section 4.3,
 $\unicode[STIX]{x1D706}$
is computationally demanding to select; however, once
 $\unicode[STIX]{x1D706}$
is selected this approach yields a closed-form expression
 $\hat{\mathbf{c}}_{KRLS}^{\ast }=(\mathbf{K}+\unicode[STIX]{x1D706}I)^{-1}\mathbf{y}$
, which can be calculated straightforwardly. Under appropriate functional form and error structure assumptions, both
 $\hat{\mathbf{c}}_{KRLS}^{\ast }$
and
 $\hat{\mathbf{y}}_{KRLS}^{\ast }$
are unbiased and consistent estimators of their population equivalents
 $\mathbf{c}^{\ast }$
and
 $\mathbf{y}^{\ast }$
, with closed-form expressions for both the estimators and their variances (Hainmueller and Hazlett Reference Hainmueller and Hazlett2013).Footnote
11
In simulations, both we and Hainmueller and Hazlett (Reference Hainmueller and Hazlett2013) show that KRLS is competitive with respect to out-of-sample predictive performance compared with related approaches (see Supplementary Appendix D.2 for details).
3.2 Opening the black box
In contrast with other flexible modeling approaches, the kernel and regularized coefficients offer a natural way to express the effects of variables contained in the model (see Figure 1). In particular, since
 $\hat{\mathbf{y}}^{\ast }$
has a closed-form expression, for continuous predictors we can estimate the marginal effect of a given predictor at any observed point
 $\mathbf{X}_{j,p}$
by taking the derivativeFootnote
12
of the predicted values with respect to the point of interest:
 $$\begin{eqnarray}\widehat{\frac{\unicode[STIX]{x1D6FF}\mathbf{y}^{\ast }}{\unicode[STIX]{x1D6FF}\mathbf{X}_{j,p}}}=\frac{-2}{\unicode[STIX]{x1D70E}^{2}}\mathop{\sum }_{i}^{N}{\hat{c}}_{i}^{\ast }\mathbf{K}_{i,j}(\mathbf{X}_{i,p}-\mathbf{X}_{j,p}).\end{eqnarray}$$
Since the regularization constraints imposed on the estimated coefficient vector
 $\hat{\mathbf{c}}^{\ast }$
serve to shrink its values, many of the pairwise comparisons embedded in this expression have little or no effect on the final estimated derivative value. These shrinkage constraints therefore simplify and smooth the estimated derivatives, consistent with the logic of regularization. Because the distribution of the regularized coefficients is in general unknown, constructing reliable measures of uncertainty around each pointwise marginal effect is challenging. As a result, these estimates are best used for exploration rather than inference. However, for researchers who are mindful of these limitations, these estimates offer a useful summary of the observed effect structure.
Because these pointwise marginal effects can be expressed in closed form, we can straightforwardly produce summaries of their content. Defining
 $\hat{\unicode[STIX]{x1D6E5}}$
as an
 $N\times P$
matrix of partial derivatives, we can define the AME of each variable as
 $\hat{\unicode[STIX]{x1D6E5}}_{AME}=[\frac{1}{N}\sum _{j}\widehat{\frac{\unicode[STIX]{x1D6FF}\mathbf{y}^{\ast }}{\unicode[STIX]{x1D6FF}\mathbf{X}_{p,j}}}\forall p\in \{1,2,\ldots P\}]$
, or the column means of
 $\hat{\unicode[STIX]{x1D6E5}}$
. Hypotheses about
 $\hat{\unicode[STIX]{x1D6E5}}_{AME}$
can be evaluated with standard hypothesis testing tools, and offer a highly interpretable summary of the overall effect of each variable.
“Actual” marginal effects.

Unfortunately, the flexibility, statistical performance, and interpretability of this approach come at a cost. This pairwise model is difficult to estimate with KRLS, even without estimating the marginals. In bigKRLS—our implementation of KRLS for this model—the algorithm’s peak memory requirements are
 $O(N^{2})$
. Assuming derivatives are estimated, the original KRLS implementation has peak memory requirements of
 $O(PN^{2})$
; as a result, this figure offers a substantial improvement over the original estimation routine, but remains difficult to scale.Footnote
13
From a runtime standpoint, KRLS’s requirements are similarly onerous, with total runtime complexity
 $O(N^{3})$
. For comparison, decision trees have runtime complexity
 $O(N\log (N)^{2})+O(PN\log (N))$
.
4 Algorithmic and Statistical Optimization Using bigKRLS
4.1 Overview
The improvements we present in this paper can be divided into two rough categories. First, from an algorithmic standpoint we reimplement all major functions using the bigmemory, Rcpp, and parallel packages in R, allowing researchers to easily parallelize model estimation. We also develop new algorithms for kernel regularization and first differences. Second, to improve inference, we propose a degrees-of-freedom correction for the model’s AME estimates and a new measure of effect heterogeneity contained in the model. We justify our degrees-of-freedom correction both theoretically and in simulation, and find that it performs well in the settings we examine. The correction improves coverage most notably for complex data-generating processes and smaller samples.
Put together, our algorithmic changes reduce peak memory consumption from
 $O((P+21)N^{2})$
to
 $O(5N^{2})$
in our implementation. Crucially, unlike KRLS, the memory footprint of bigKRLS does not depend on
 $P$
, the number of explanatory variables.Footnote
14
Runtime using bigKRLS and the original KRLS implementation is roughly comparable when
 $N$
and
 $P$
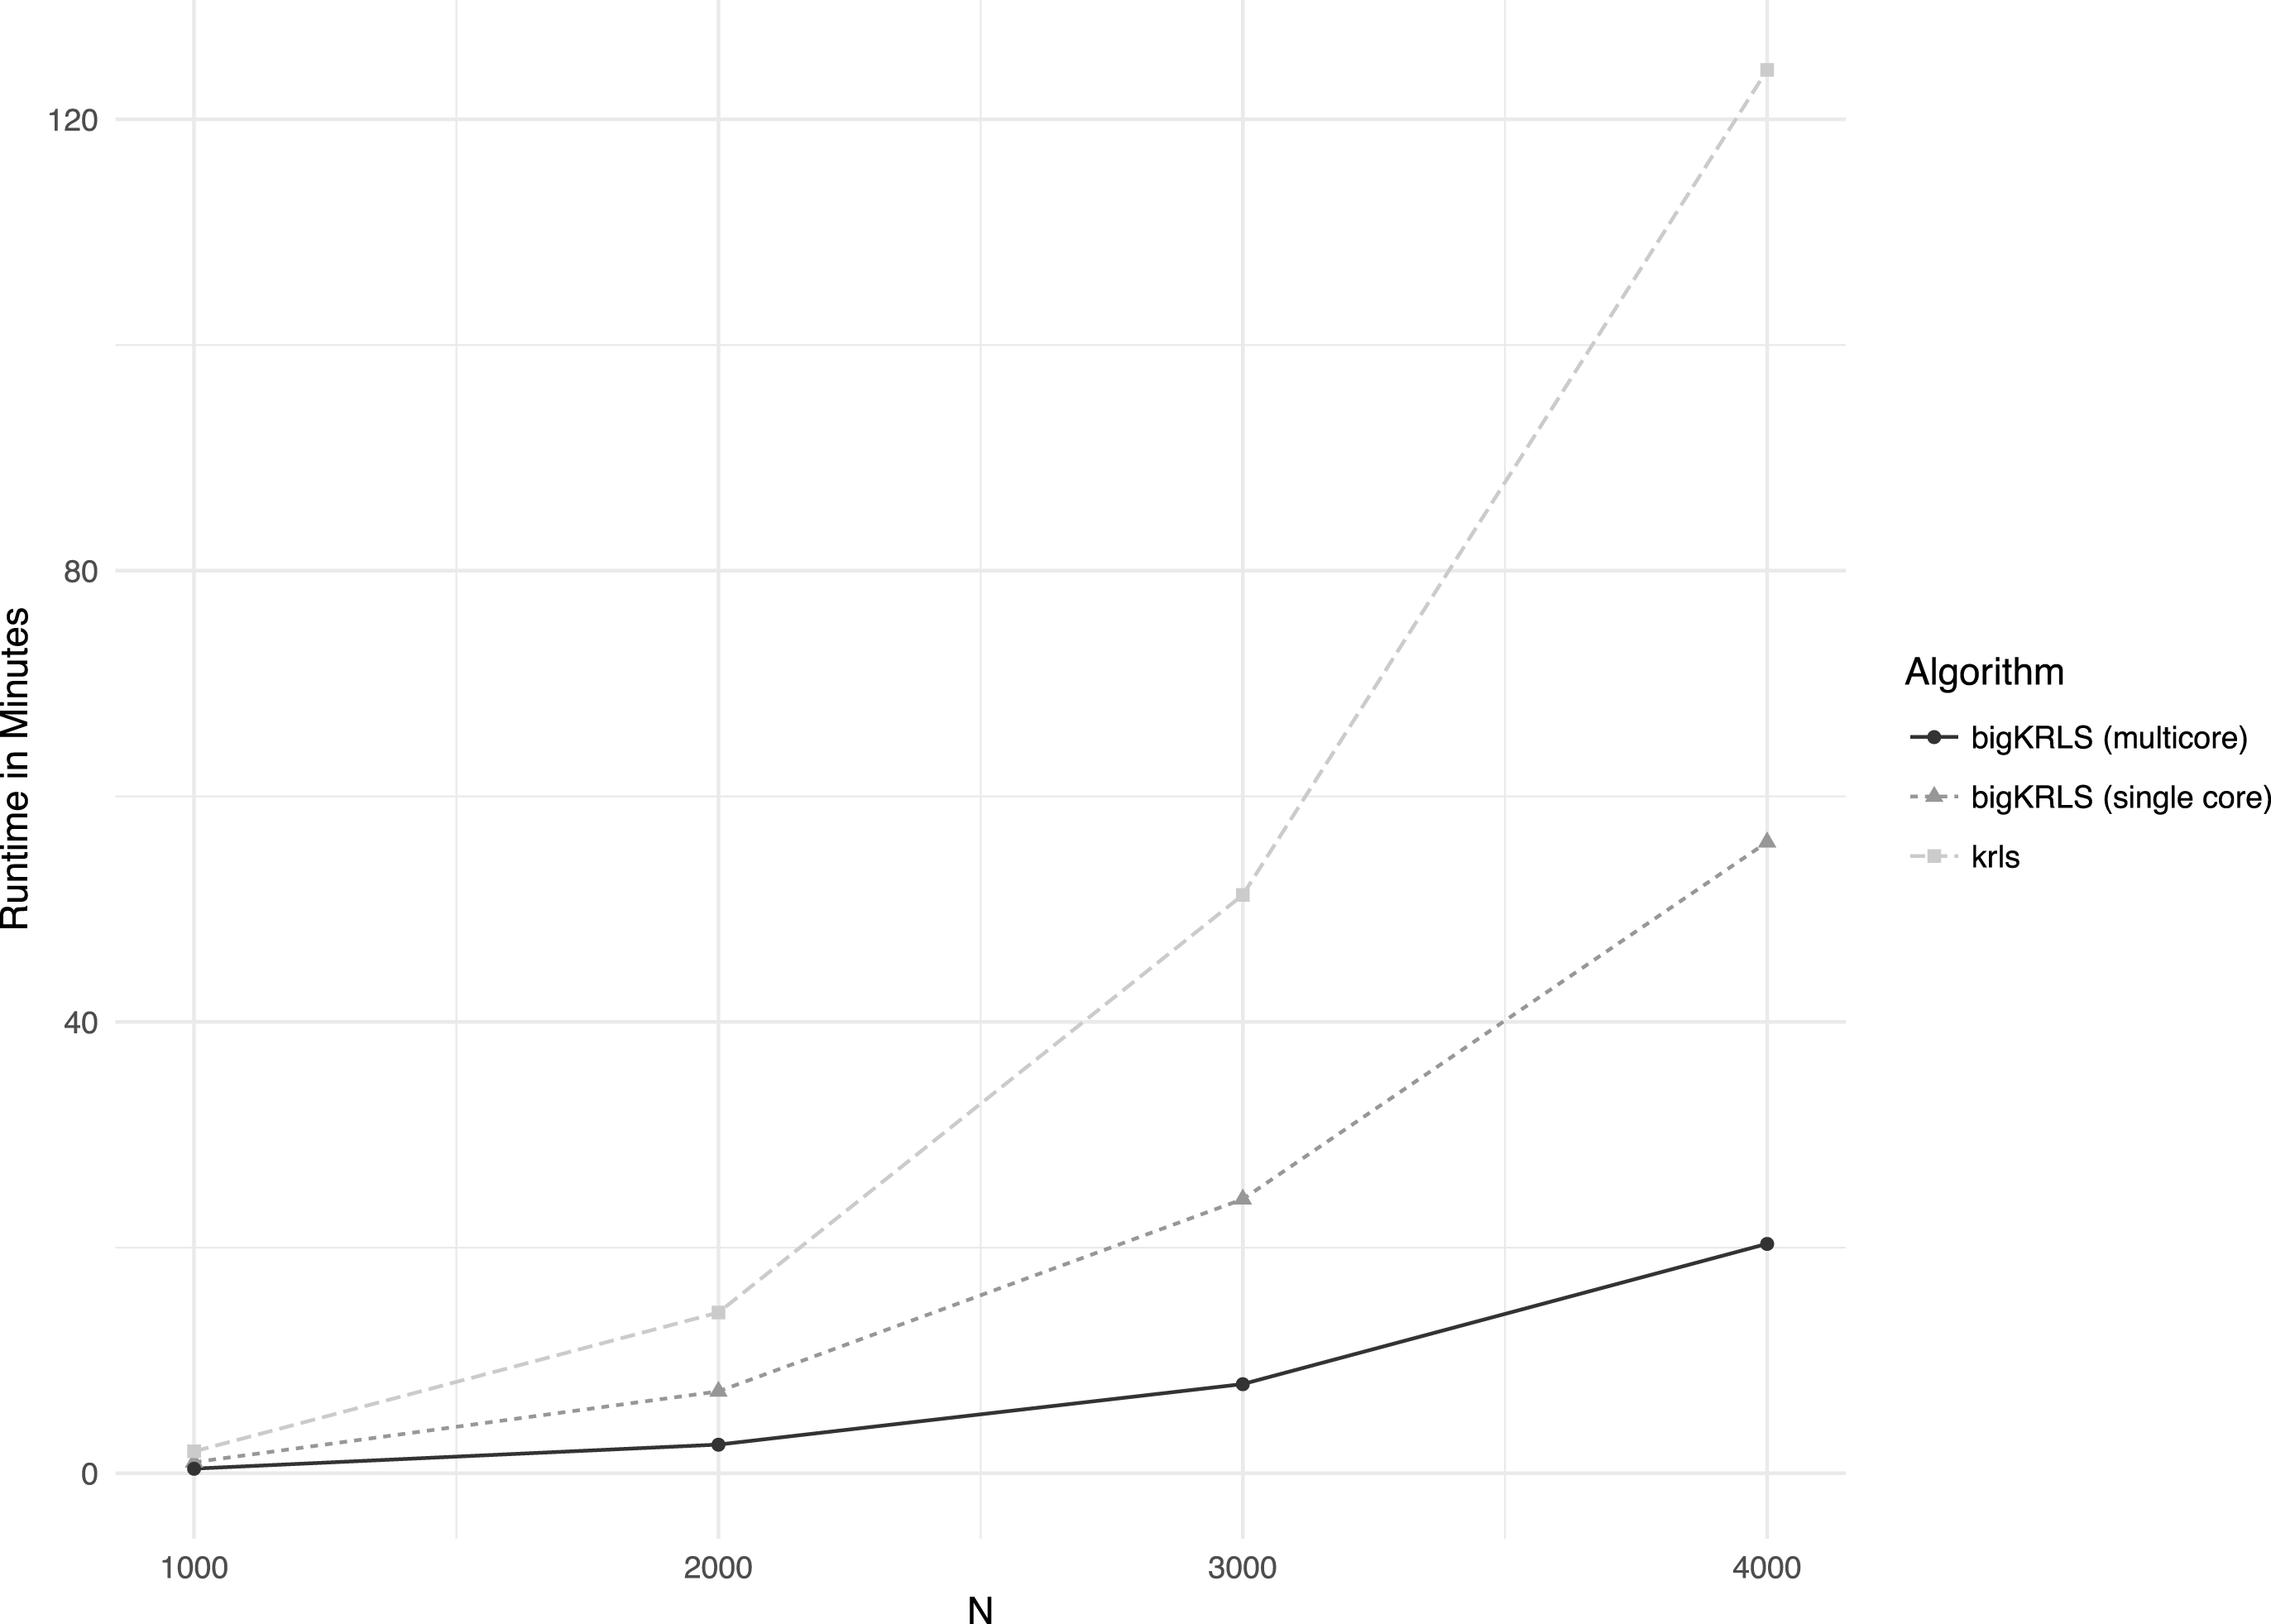
are small and all predictors are continuous. However, in most applied settings, bigKRLS is substantially faster. In simulation results for a dataset consisting of 10 binary and 10 continuous predictors, for example, we report approximately 50% decreased wall-clock time when running on a single core. When bigKRLS is set to use multiple processors (not an option with KRLS), a task that takes KRLS just over two hours can be done by bigKRLS in twenty minutes (Figure 3).
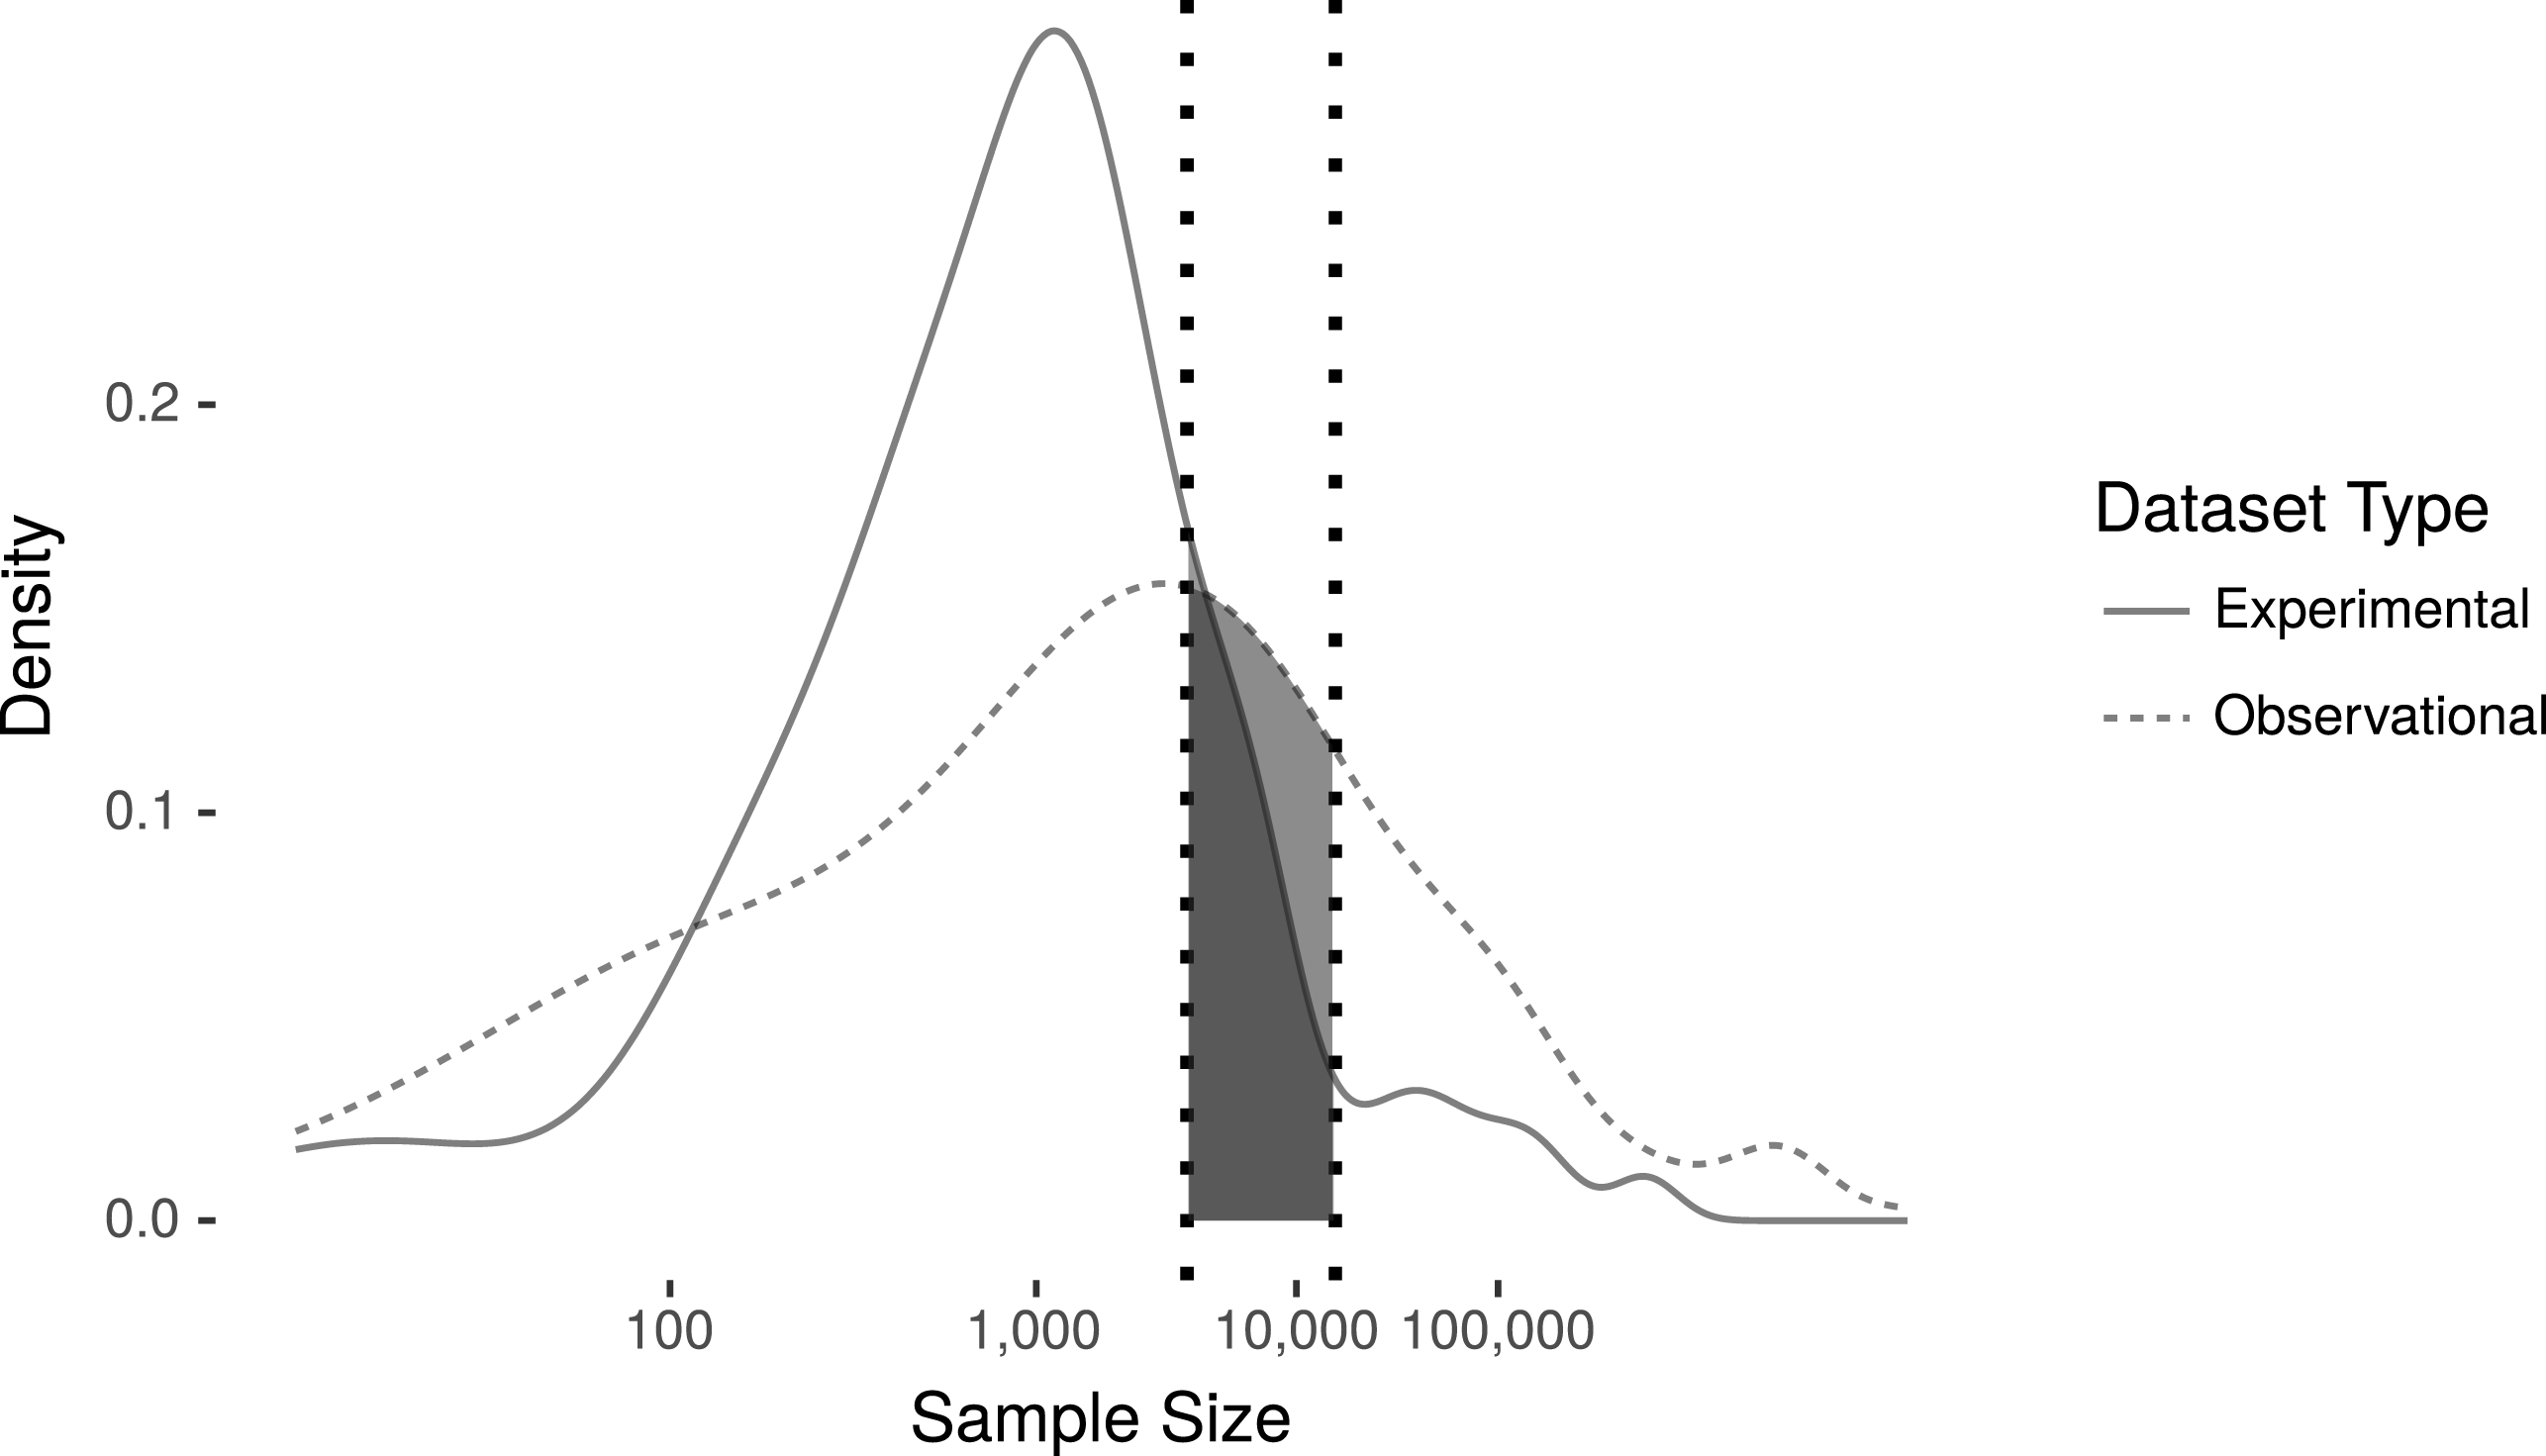
Published sample sizes. Source: American Journal of Political Science and American Political Science Review, January 2015 through January 2017 (own calculation).

Runtime comparisons (worst case).

How important are these improvements? For illustration purposes, we surveyed all empirical articles published in the American Journal of Political Science (AJPS) and the American Political Science Review (APSR) from January 2015 to January 2017, and recorded sample sizes for each dataset used in those articles (
 $N=279$
).Footnote
15
In the time frame we surveyed, approximately 43% of datasets were too large for the original KRLS implementation. By contrast, with similar dimensions bigKRLS can handle datasets up to approximately
 $N=14,000$
on a personal machine before reaching the 8 GB cutoff, opening an additional 20% of published datasets for estimation.Footnote
16
These improvements, we argue, are substantial. Statistical models are only useful to the extent that they can be employed in practice. While high-complexity methods like KRLS are unlikely to be usable in truly “big” data settings, our improvements allow a noticeably greater proportion of applied researchers to use the modeling approach we present.
4.2 Algorithmic improvements
4.2.1 A leaner first differences estimator
For binary explanatory variables, KRLS estimates first differences.Footnote
17
The original algorithm for this procedure functions as follows. Suppose
 $\mathbf{X}_{b}$
is a column that contains a binary variable. Construct two copies of
 $\mathbf{X}$
, denoted as
 $\mathbf{X}_{\{\mathbf{0}\}}$
and
 $\mathbf{X}_{\{\mathbf{1}\}}$
, which are modified such that all observations in the
 $b$
th column of the copies are equal to 0 and 1, respectively. Combine the original matrix and the two modified copies into a new matrix
 $\mathbf{X}_{\text{new}}^{\prime }=[\mathbf{X}\mid \mathbf{X}_{\{\mathbf{0}\}}\mid \mathbf{X}_{\{\mathbf{1}\}}]^{\prime }$
, and construct a new similarity kernel. This step is temporary, but has a memory footprint of
 $9N^{2}$
(!). Finally, save the two submatrices of the kernel corresponding to the respective counterfactual comparisons between
 $\mathbf{X}_{\{\mathbf{0}\}}$
,
 $\mathbf{X}_{\{\mathbf{1}\}}$
, and the observed data
 $\mathbf{X}$
.
Our leaner implementation can also be expressed in terms of potential outcomes (Keele Reference Keele2015). The goal is to minimize the computational burden of obtaining the vector of differences for the scenario in which everyone was counterfactually assigned to one group versus the other. Let
 $\mathbf{K}_{\{1\}}$
and
 $\mathbf{K}_{\{0\}}$
be the counterfactual kernels.Footnote
18
The first differences are:
 $$\begin{eqnarray}\unicode[STIX]{x1D6FF}_{b}=\mathbf{y}_{\{1\}}-\mathbf{y}_{\{0\}}=\mathbf{K}_{\{1\}}\mathbf{c}^{\ast }-\mathbf{K}_{\{0\}}\mathbf{c}^{\ast }=(\mathbf{K}_{\{1\}}-\mathbf{K}_{\{0\}})\mathbf{c}^{\ast }.\end{eqnarray}$$
As with the AMEs of continuous variables, the mean
 $\bar{\hat{\unicode[STIX]{x1D6FF}}}_{\mathbf{b}}$
is used as the point estimate that appears in the regression table. The variance of that mean first difference is:
 $$\begin{eqnarray}\hat{\unicode[STIX]{x1D70E}}_{\unicode[STIX]{x1D6FF}_{\mathbf{b}}}^{\boldsymbol{ 2}}=\mathbf{h}^{\prime }(\mathbf{K}_{\text{new}}\hat{\unicode[STIX]{x1D72E}}_{\boldsymbol{ c}})\mathbf{K}_{\text{new}}^{\prime }\mathbf{h},\end{eqnarray}$$
where
 $\mathbf{h}$
is a vector of constants,Footnote
19
 $\mathbf{K}_{\text{new}}$
is a partitioned matrix with the counterfactual kernels, and
 $\hat{\unicode[STIX]{x1D72E}}_{\mathbf{c}}$
is the variance–covariance matrix of the coefficients (Hainmueller and Hazlett Reference Hainmueller and Hazlett2013). Though highly interpretable, first difference calculations are computationally daunting because the peak memory footprint is
 $O(6N^{2})$
:
 $O(2N^{2})$
for
 $\mathbf{K}_{\text{new}}$
and another
 $O(4N^{2})$
for
 $\hat{\unicode[STIX]{x1D748}}_{\unicode[STIX]{x1D739}_{\mathbf{b}}}^{\mathbf{2}}$
. The following insight allowed us to derive a more computationally friendly algorithm.
Consider the similarity score
 $\mathbf{K}_{i,j}$
. We can manipulate this quantity as follows:
 $$\begin{eqnarray}\displaystyle \mathbf{K}_{i,j} & = & \displaystyle e^{-||\mathbf{x}_{i}-\mathbf{x}_{j}||^{2}/\unicode[STIX]{x1D70E}^{2}}\nonumber\\ \displaystyle & = & \displaystyle e^{-[(\mathbf{x}_{i,1}-\mathbf{x}_{j,1})^{2}+(\mathbf{x}_{i,2}-\mathbf{x}_{j,2})^{2}+\cdots +(\mathbf{x}_{i,b}-\mathbf{x}_{j,b})^{2}+\ldots ]}\nonumber\\ \displaystyle & = & \displaystyle e^{-(\mathbf{x}_{i,b}-\mathbf{x}_{j,b})^{2}/\unicode[STIX]{x1D70E}^{2}}e^{-[(\mathbf{x}_{i,1}-\mathbf{x}_{j,1})^{2}+(\mathbf{x}_{i,2}-\mathbf{x}_{j,2})^{2}+\ldots ]}\nonumber\\ \displaystyle & = & \displaystyle e^{-(\mathbf{x}_{i,b}-\mathbf{x}_{j,b})^{2}/\unicode[STIX]{x1D70E}^{2}}\mathbf{K}_{i,j}^{\ast }.\nonumber\end{eqnarray}$$
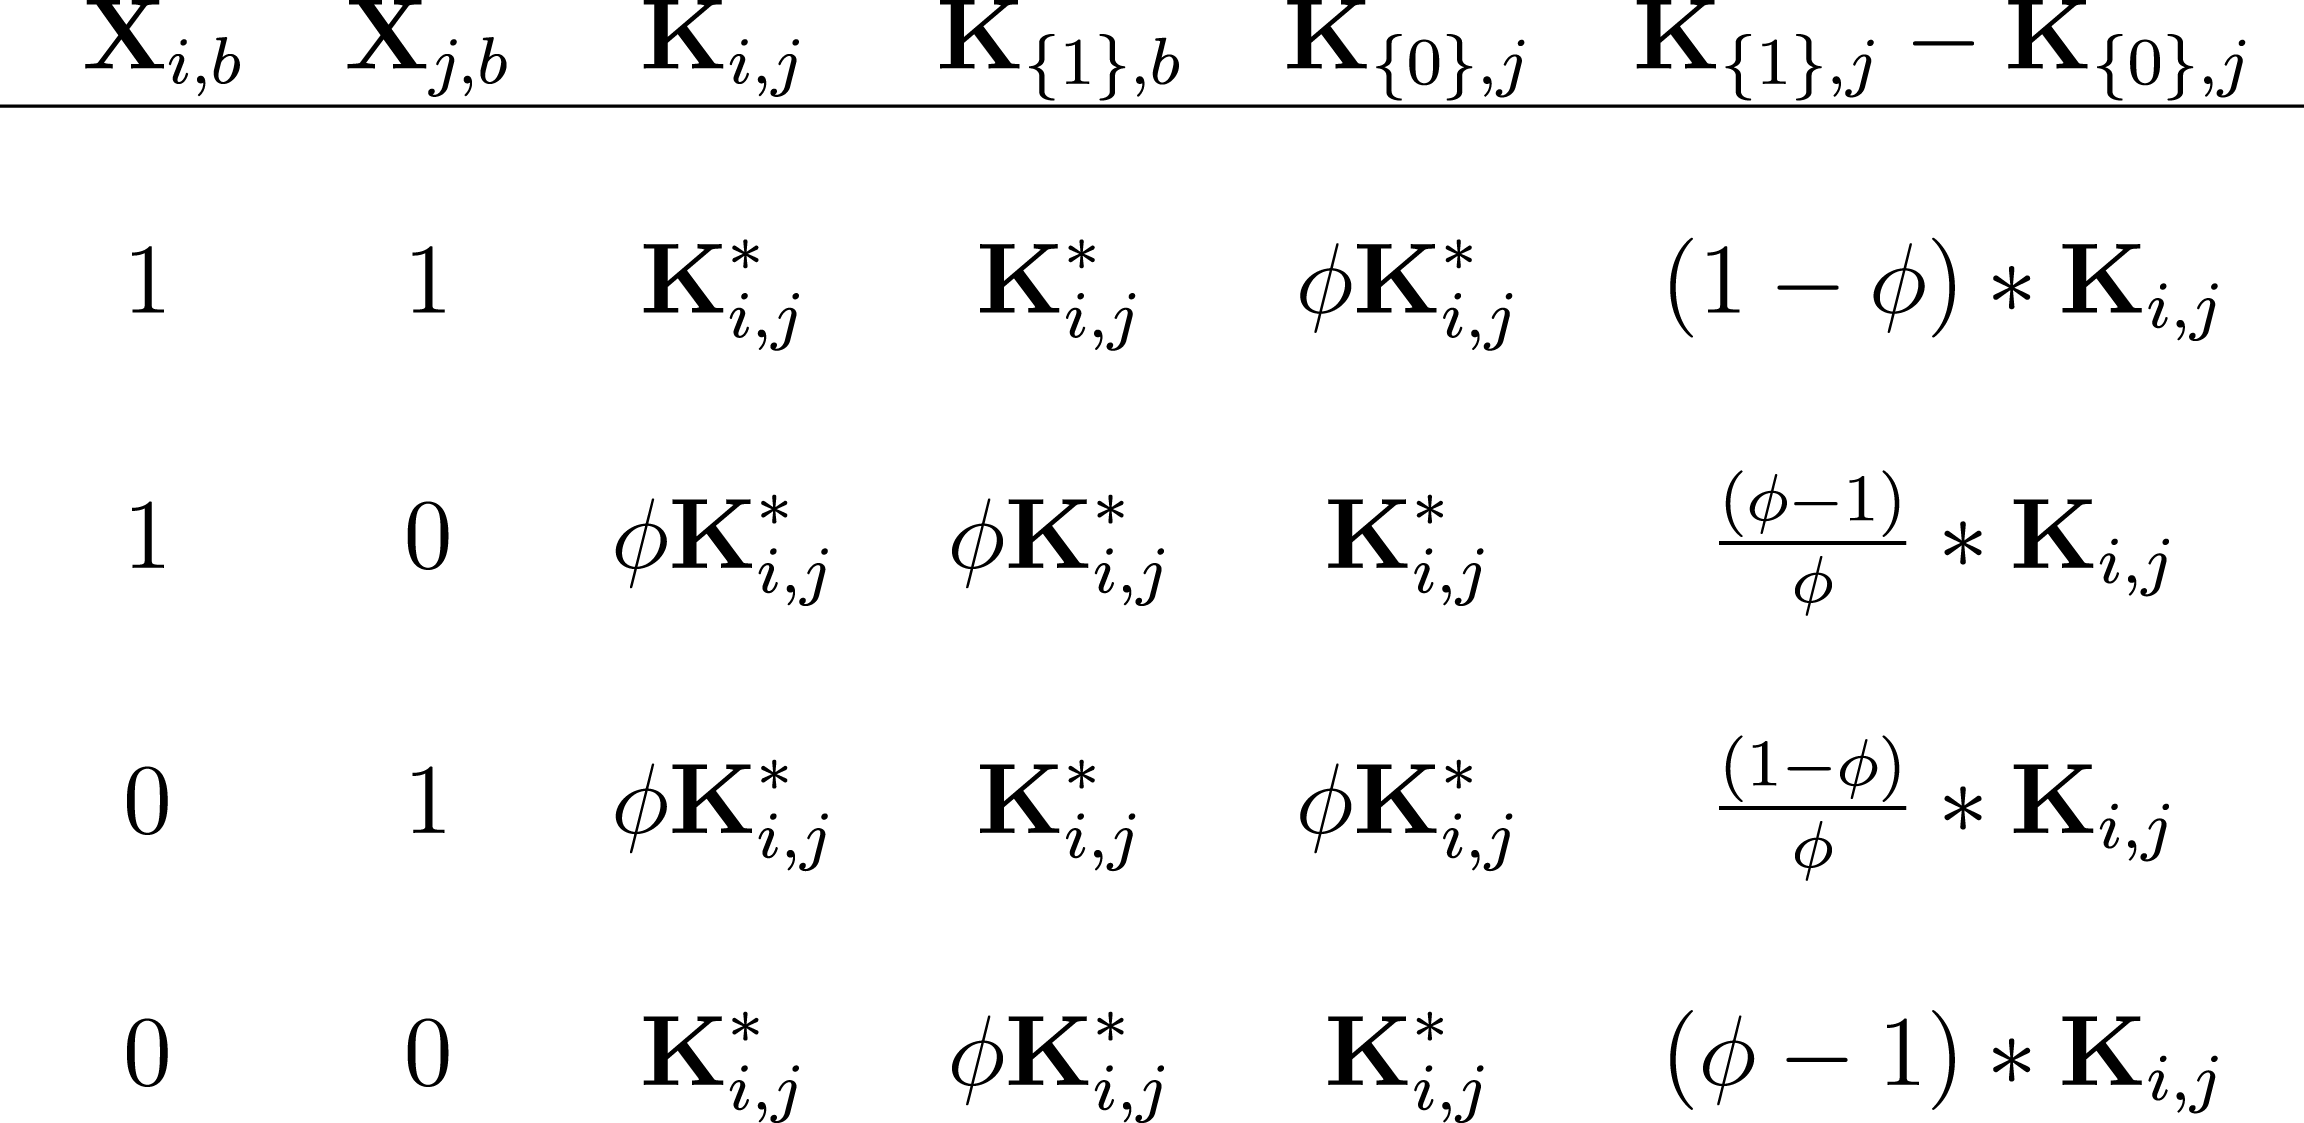
These manipulations allow us to reexpress the quantity of interest in terms of
 $\mathbf{K}_{i,j}^{\ast }$
, the observed similarity on dimensions other than
 $b$
, and
 $\unicode[STIX]{x1D719}=\exp (-\frac{1}{\unicode[STIX]{x1D70E}_{\mathbf{X}_{b}}^{2}\unicode[STIX]{x1D70E}^{2}})$
, the (only nonzero) pairwise distance on the binary dimension, where
 $\unicode[STIX]{x1D70E}_{\mathbf{X}_{b}}^{2}$
is the variance of the binary variable. This process facilitates reexpression wholly in terms of the observed kernel and the constant
 $\unicode[STIX]{x1D719}$
, as shown in Figure 4. As a result, our algorithm avoids constructing the costly temporary matrix required in the original implementation.
Reexpressed kernel for first differences estimation.

Building on this observation, we took the following steps to make the variance–covariance calculation more tractable.
(1) Though
 $(\mathbf{K}_{\text{new}}\hat{\unicode[STIX]{x1D72E}}_{\mathbf{c}})\mathbf{K}_{\text{new}}^{\prime }$
is
$2N\times 2N$
it is possible to focus the calculations on four
$N\times N$
submatrices: Each (sub)matrix in the final term functions as a weight on the observed variances and covariances in the various counterfactual scenarios. Partitioning the matrix in this manner allows us to avoid constructing the full$$\begin{eqnarray}\displaystyle (\mathbf{K}_{\text{new}}\hat{\unicode[STIX]{x1D72E}}_{\mathbf{c}})\mathbf{K}_{\text{new}}^{\prime }=\left[\begin{array}{@{}c@{}}\mathbf{K}_{\{1\}}\mathbf{K}_{\{0\}}\end{array}\right]\hat{\unicode[STIX]{x1D72E}}_{\mathbf{c}}\left[\begin{array}{@{}c@{}}\mathbf{K}_{\{1\}}^{\prime }\\ \boldsymbol{ K}_{\{0\}}^{\prime }\end{array}\right]=\left[\begin{array}{@{}cc@{}}\mathbf{K}_{\{1\}}\hat{\unicode[STIX]{x1D72E}}_{\mathbf{c}}\mathbf{K}_{\{1\}}^{\prime } & \mathbf{K}_{\{1\}}\hat{\unicode[STIX]{x1D72E}}_{\mathbf{c}}\mathbf{K}_{\{1\}}^{\prime }\\ \boldsymbol{ K}_{\{1\}}\hat{\unicode[STIX]{x1D72E}}_{\mathbf{c}}\mathbf{K}_{\{0\}}^{\prime } & \mathbf{K}_{\{0\}}\hat{\unicode[STIX]{x1D72E}}_{\mathbf{c}}\mathbf{K}_{\{0\}}^{\prime }\end{array}\right]. & & \displaystyle \nonumber\end{eqnarray}$$
$2N\times 2N$
matrix directly.
(2) Though
$\mathbf{h}$
is simply an auxiliary vector that facilitates averaging,
$\mathbf{h}^{\prime }(\mathbf{K}_{\text{new}}\hat{\unicode[STIX]{x1D72E}}_{\mathbf{c}})\mathbf{K}_{\text{new}}^{\prime }\mathbf{h}$
presents different opportunities for factoring than
$(\mathbf{K}_{\text{new}}\hat{\unicode[STIX]{x1D72E}}_{\mathbf{c}})\mathbf{K}_{\text{new}}^{\prime }$
. Our algorithm factors out individual elements of
$\hat{\unicode[STIX]{x1D72E}}_{\mathbf{c}}$
as far as possible. Along with an expanded version of Figure 4 that expresses all possible products of two counterfactual similarity scores, we reduce the computational complexity by an order of magnitude by avoiding an intractable inner loop.


Other factorizations may exist that further optimize either speed or memory—but not both. Our first differences algorithm, for example, can be reexpressed as a triple loop with no additional memory overhead; however, that formulation sacrifices vectorization speedups which our current setup exploits. In the implementation we present, we create two
 $N\times N$
temporary matrices, which is both an improvement over six and no worse than any other part of the algorithm. Consistent with our experience with
 $bigKRLS$
, speed tests show that our algorithm is no slower than a purely linear algebra approach.
To illustrate why this advance is important, consider dyadic data. Because of the pairwise structure of the kernel, KRLS is tailor-made for international relations, where often data in country dyads are encountered. However, such analyses often require at least 150 binary variables for nation states. In Section 5, we use 50 binary variables for US states, which is similarly prohibitive on many machines with KRLS. With bigKRLS, this is no longer an issue.
4.2.2 Lowering the cost of kernel regularization
For KRLS, the regularization parameter
 $\unicode[STIX]{x1D706}$
represents the degree of skepticism toward idiosyncratic features of the data-generating process. In bigKRLS we introduce a leaner version of the Golden Search algorithm as described by Rifkin and Lippert (Reference Rifkin and Lippert2007) and adopted by Hainmueller and Hazlett (Reference Hainmueller and Hazlett2013).
 $bigKRLS$
’s approach to selecting 𝜆 offers a lower memory footprint and speed gains at the sample sizes where
 $bigKRLS$
has the most to offer to political science researchers.
The Golden Search strategy is as follows. Though
 $\unicode[STIX]{x1D706}$
cannot be obtained analytically, it can be selected (to arbitrary precision) through an iterative procedure that depends primarily on the eigendecomposition of the kernel.Footnote
20
 $\unicode[STIX]{x1D706}$
is selected to minimize the sum of squared leave-one-out errors,
 $LOOE=\sum (\frac{\hat{\mathbf{c}}^{\ast }}{\mathbf{G}_{i,i}^{-1}})^{2}$
.
 $\mathbf{G}=\mathbf{K}+\unicode[STIX]{x1D706}\mathbf{I}$
is the “ridge” version of the kernel. The key computational challenge is
 $\mathbf{G}^{-1}$
, which is used to calculate candidate coefficient values and
 $LOOE$
at each step.
For computational ease,
 $\mathbf{G}^{-1}$
(or even
 $\mathbf{G}$
) is not obtained directly. Instead, the equivalent expression
 $\mathbf{Q}\unicode[STIX]{x1D726}\mathbf{Q}^{\prime }$
is substituted, where
 $\mathbf{Q}$
is a matrix containing the eigenvectors of
 $\mathbf{K}$
and
 $\unicode[STIX]{x1D726}$
is a diagonal matrix of eigenvalues. Expanding this expression yields
 $$\begin{eqnarray}\mathbf{G}_{i,j}^{-1}=\mathop{\sum }_{k=1}^{N_{Q}}\frac{\mathbf{Q}_{i,k}\ast \mathbf{Q}_{j,k}}{\unicode[STIX]{x1D706}+\unicode[STIX]{x1D726}_{\text{k,k}}},\end{eqnarray}$$
where
 $N_{Q}$
is the number of eigenvalues actually used in this computation.
Existing implementations of this approach usually begin by calculating the cross product
 $\mathbf{Q}(\unicode[STIX]{x1D726}+\unicode[STIX]{x1D706}\mathbf{I})\mathbf{Q}^{\prime }$
, and using its values to calculate candidate coefficient values. In our implementation, we instead build this matrix in a column-by-column manner. This strategy has two advantages. First, since the only purpose of constructing
 $\mathbf{G}^{-1}$
is to calculate
 $\hat{\mathbf{c}}^{\ast }$
, we can avoid placing the full
 $\mathbf{G}^{-1}$
matrix in memory by simply accumulating each column of
 $\mathbf{G}^{-1}$
into the coefficient vector. Second, since
 $\mathbf{G}^{-1}$
is symmetric we can simply skip calculating the elements of each column that correspond to the upper triangle of the matrix. As shown in Table 2, this implementation offers a noticeable performance boost over existing implementations.Footnote
21
Alternatives for the spectral decomposition’s cumulative effect on runtime.

As an empirical benchmark, we isolate the portions of the algorithm that depend on the eigenvectors and eigenvalues (i.e., the eigendecomposition,
 $\unicode[STIX]{x1D706}$
search, and estimating the coefficients and their variance–covariance matrix but not the kernel or marginal effects). We report the runtime of this portion on the 2016 election data presented in Section 5 (
 $N=3106,P=68$
) in seconds on a 2017 MacBook Pro (2.3 GHz Intel Core i5 with 16 GB of RAM). For the eigentruncation case,
 $\unicode[STIX]{x1D716}=0.01$
and, in the final column,
 $N_{Q}=50$
.
As implied by the preceding discussion, not all eigenvalues and vectors are necessary for selecting
 $\unicode[STIX]{x1D706}$
. In most applied settings, the vast majority of the eigenvalues are very small, and can be safely ignored during the calculations described above. bigKRLS facilitates two types of eigentruncation: specifying that (1) only
 $N_{Q}$
eigenvectors and eigenvalues be calculatedFootnote
22
and/or (2) defining an
 $\unicode[STIX]{x1D716}$
such that only those eigenvectors and eigenvalues will be used where the eigenvalue is at least
 $100\unicode[STIX]{x1D716}\%$
as large as the largest eigenvalue. Optimizing either of these strategies ex ante is difficult; however, since runtime for this section of the algorithm depends on
 $N_{Q}$
rather than the proportion of variance explained by the retained eigenvalues/vectors, even a conservative decision rule will often produce substantial speed gains. As a default in bigKRLS we set
 $\unicode[STIX]{x1D716}=0.001$
, which produces virtually identical results to those generated using the full decomposition in both simulated examples and our application in Section 5.
4.3 Inferential tools
4.3.1 Degrees of freedom for AMEs
One of KRLS’s key strengths is its ability to offer both nuanced effect estimates as well as high-level summaries of each effect. The key high-level quantities produced by the model are the AME estimates, for which Hainmueller and Hazlett (Reference Hainmueller and Hazlett2013) derive closed-form expressions for both the values of the AMEs and their variances. They then use these quantities to derive a Student’s
 $t$
-test with
 $N-P$
degrees of freedom to assess statistical significance of each individual AME estimate. This approach works well for simple data-generating processes but not for more complex problems, as we show in simulation (introduced below and detailed in Supplementary Appendix C). For many realistic cases this test yields overly narrow confidence intervals coupled with misleadingly low
 $p$
values.
To address this issue, we propose an uncertainty correction using the effective degrees of freedom from the Tikhonov penalty used by KRLS. Since KRLS estimates
 $N$
choice coefficients,
 ${\hat{c}}^{\ast }$
, each of which is a parameter with an
 $L_{2}$
penalty, the effective degree of freedom for the model is
 $$\begin{eqnarray}N_{\mathit{effective}}=N-\mathop{\sum }_{k=1}^{N_{Q}}\frac{\unicode[STIX]{x1D726}_{k,k}}{\unicode[STIX]{x1D726}_{k,k}+\unicode[STIX]{x1D706}},\end{eqnarray}$$
where
 $N$
is the original sample size,
 $\unicode[STIX]{x1D6EC}_{k,k}$
is the
 $k$
th eigenvalue of
 $K$
, and
 $\unicode[STIX]{x1D706}$
is the model’s regularization parameter (Hastie, Tibshirani, and Wainwright Reference Hastie, Tibshirani and Wainwright2015, 61–68).Footnote
23
Provided
 $N_{Q}$
(the number of eigenvalues and eigenvectors actually used) is large enough to select
 $\unicode[STIX]{x1D706}$
reliably,
 $N_{Effective}$
should yield essentially the same estimate as if
 $N_{Q}=N$
due to the eigenvalues’ skew and constraints.Footnote
24
To test the performance of this approach, we conducted a series of simulation studies (see Supplementary Appendix C for details). Our experiments suggest that this correction is most impactful when the true data-generating process is highly nonlinear and the sample size is smaller, offering approximately a 10-point increase in empirical coverage in this scenario. When the true data-generating process is simpler, the difference in coverage rates between corrected and uncorrected approaches vanishes. However, since KRLS is most appealing for applied work when researchers suspect that the true effect structure is more complex, we argue that this result offers substantial justification for our correction.
4.3.2 Detecting effect heterogeneity
While useful, inspecting AME estimates alone can conceal substantial effect heterogeneity. To help bridge the gap between high-level AMEs and the more nuanced pointwise derivative estimates, we introduce two statistics, which we term
 $R_{K}^{2}$
and
 $R_{AME}^{2}$
:
 $$\begin{eqnarray}\displaystyle R_{AME}^{2} & = & \displaystyle cor(y,{\hat{y}}_{AME})^{2},\nonumber\\ \displaystyle R_{K}^{2} & = & \displaystyle cor(y,{\hat{y}})^{2},\nonumber\end{eqnarray}$$
with
 ${\hat{y}}=K{\hat{c}}$
and
 ${\hat{y}}_{AME}=\mathbf{X}\hat{\unicode[STIX]{x1D6E5}}_{AME}^{\prime }$
, where
 $\hat{\unicode[STIX]{x1D6E5}}_{AME}$
denotes the vector of AMEs. Phrased differently,
 $R_{K}^{2}$
denotes the pseudo-
 $R^{2}$
calculated with the kernel and all
 $N$
coefficient estimates, while
 $R_{AME}^{2}$
denotes the pseudo-
 $R^{2}$
calculated using predictions from
 $\mathbf{X}$
and its estimated partial derivatives alone. Intuitively, these quantities will be similar when
 $\mathbf{y}$
can be well approximated by a linear combination of the columns of
 $\mathbf{X}$
. When
 $\mathbf{y}$
is a more idiosyncratic function better modeled by the pairwise similarity of the observations,
 $R_{K}^{2}$
will outperform the AMEs, often dramatically. Note that, since
 $R_{AME}^{2}$
is not based on values selected to optimize any particular loss function, its performance can be unstable. Unlike
 $R_{K}^{2}$
, which tends to be relatively consistent in and out of sample,
 $R_{AME}^{2}$
is often “pessimistic” in the sense that it can be noticeably smaller on training than test data.
5 Application: The Trump Effect in “Communities in Crisis”
As an example application of bigKRLS, we analyze county-level results from the 2016 presidential election, with a focus on the so-called “communities in crisis” hypothesis (described in detail in the following section). This application highlights two key strengths of bigKRLS: scalability, and ability to gracefully handle binary predictors. Because we include state as a predictor, our resulting model contains more than 50 binary variables. Peak memory requirements in the original KRLS implementation scale with the number of predictors while with bigKRLS they do not, resulting in more than an order of magnitude decrease in memory consumption with the move to our implementation.
5.1 Overview
In both popular and academic discussions (e.g. Guo Reference Guo2016; Monnat Reference Monnat2016; Siegel Reference Siegel2016), a number of commentators argued that Donald Trump’s success in the 2016 election was partly attributable to his appeal in “communities in crisis.” As shown by Case and Deaton (Reference Case and Deaton2015), suicides, drug overdoses, and other so-called “deaths of despair” rose sharply among non-Hispanic Whites over the decades preceding the election, leading to a decrease in overall life expectancy within this population. Combined with declining economic opportunities, commentators argued, declining public health outcomes fostered a sense of dissatisfaction with traditional elites in afflicted areas. As a result, members of these communities may have been unusually inclined to vote for Trump relative to “establishment” Republican candidates.
To investigate this hypothesis, we use bigKRLS to model county-level voting patterns in the 2016 presidential election. Our dependent variable in this model is
 $\unicode[STIX]{x1D6E5}GOP$
, defined as the difference between two-party vote shares for Donald Trump in 2016 and Mitt Romney in 2012 (%Trump
 $-$
%Romney). We focus on county-level data for data availability reasons. Because of privacy considerations, county-level data is the most granular unit publicly available in relevant official US data sources like the Census Bureau and the Centers for Disease Control and Prevention.
Our key independent variables are county-level age-adjusted all-purpose mortality rate (per 1,000 individuals) and difference in three-year mortality rates for the periods preceding the 2016 and 2012 elections. These variables are intended to capture the “communities in crisis” hypothesis, with a particular focus on highlighting communities in which public health crises emerged between election cycles. We also include standard racial, macroeconomic, and education variables, along with geolocation information for each county and state-level dummy variables (described in Supplementary Appendix B). As we note at the outset of this section, including state-level dummies would have been impractical without the improvements we introduce in this paper, highlighting the utility of our approach.Footnote 25
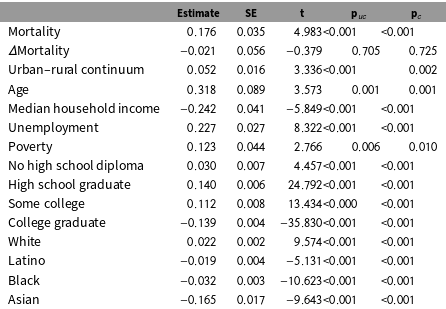
Average marginal effect estimates.

Estimates for latitude, longitude, and state omitted for brevity. The dependent variable is the change in GOP vote share in the presidential election, 2012–2016, measured in percentage points.
 $p_{uc}$
denotes uncorrected
 $p$
values generated using a
 $t$
-test with
 $N-P$
degrees of freedom;
 $p_{c}$
denotes corrected
 $p$
values with
 $N_{\mathit{effective}}=2,892$
.
 $N=3,106$
,
 $R_{K}^{2}=0.83$
, and
 $R_{\mathit{AME}}^{2}=0.31$
. For definitions, see Section 4.3.
5.2 Average effect estimates
Average marginal effect estimates for this model are given in Table 3. Unsurprisingly, the model fits the data. For our application,
 $R_{K}^{2}=0.83$
, suggesting a reasonable level of in-sample fit.Footnote
26
Nearly all predictors easily reach conventional levels of statistical significance, with intuitive signs. On average, Trump performed better in Whiter, older, poorer, and lower-education localities. As hypothesized, Trump also received a larger two-party vote share than Romney in higher-mortality counties, though the effect size is not particularly large. Averaged across the country, a one-standard-deviation (
 ${\approx}1.47$
) increase in age-adjusted mortality is estimated to produce approximately a 0.25% increase in
 $\unicode[STIX]{x1D6E5}GOP$
. These findings match the basic contours of the “communities in crisis” hypothesis: relative to previous Republican candidates, Trump performed particularly well in localities facing substantial hardships.
 $\unicode[STIX]{x1D6E5}$
Mortality is the main exception to this finding pattern, and does not reach conventional levels of statistical significance. Likely, this result is due to a lack of variability; since our study only covers a six-year period, large changes in mortality rates are rare.
As described in Section 4.3, uncorrected
 $p$
values for KRLS AMEs are suspect for more complex data-generating processes. In Table 3, we give both the corrected and the uncorrected
 $p$
values for this model, calculated using the effective degrees-of-freedom correction given previously (
 $N_{\mathit{effective}}=2,825$
). Since the sample size and effects detected by this analysis are both reasonably large, implementing the degrees-of-freedom correction we propose does not change any conclusions regarding statistical significance. At least in this case, our sample size appears to be sufficiently large relative to the complexity of the data-generating process to limit the impact of our correction.
5.3 Spatial first differences
While useful, inspecting the AME estimates can conceal substantial effect heterogeneity. In this case, the
 $R_{AME}^{2}$
is only 0.31 but
 $R_{K}^{2}=0.83$
on the full sample. As we discuss in Supplementary Appendix D.1, the out-of-sample difference between these values is likely smaller than their in-sample difference. However, as a binary indicator of effect heterogeneity, the gap between these quantities is suggestive.
Since KRLS offers closed-form estimates for the variance of the predicted values produced by the model, a simple way to explore effect heterogeneity is to estimate perturbation-based first differences, in which we “perturb” the variable of interest and examine the perturbation’s predicted impact (and the variance of that impact) on the dependent variable. In this section, we take precisely this approach. For each county, we calculate
 $\hat{\mathbf{y}}_{test}-\hat{\mathbf{y}}$
, where
 $\hat{\mathbf{y}}_{test}$
represents the predicted value for the counterfactual scenario in which we perturb the mortality variable—our key variable of interest—by some fixed constant
 $\unicode[STIX]{x1D70F}$
. We operationalize
 $\unicode[STIX]{x1D70F}$
as the difference between the
 $95$
th and
 $5$
th percentiles of the mortality variable (
 ${\approx}3.2$
standard deviations).
Besides its interpretive benefits, this approach also offers an important theoretical payoff. Both
 $\hat{\mathbf{y}}_{test}$
and
 $\hat{\mathbf{y}}$
are distributed multivariate normal with known variance–covariance matrices (Hainmueller and Hazlett Reference Hainmueller and Hazlett2013). As a result, the marginal distribution of each predicted difference is distributed univariate Gaussian, with variance equal to the sum of the corresponding diagonal elements of the variance–covariance matrices for each set of predicted values. In Supplementary Appendix E.1, we use these facts to derive a pointwise hypothesis test, which distinguishes whether these first differences differ significantly from zero.
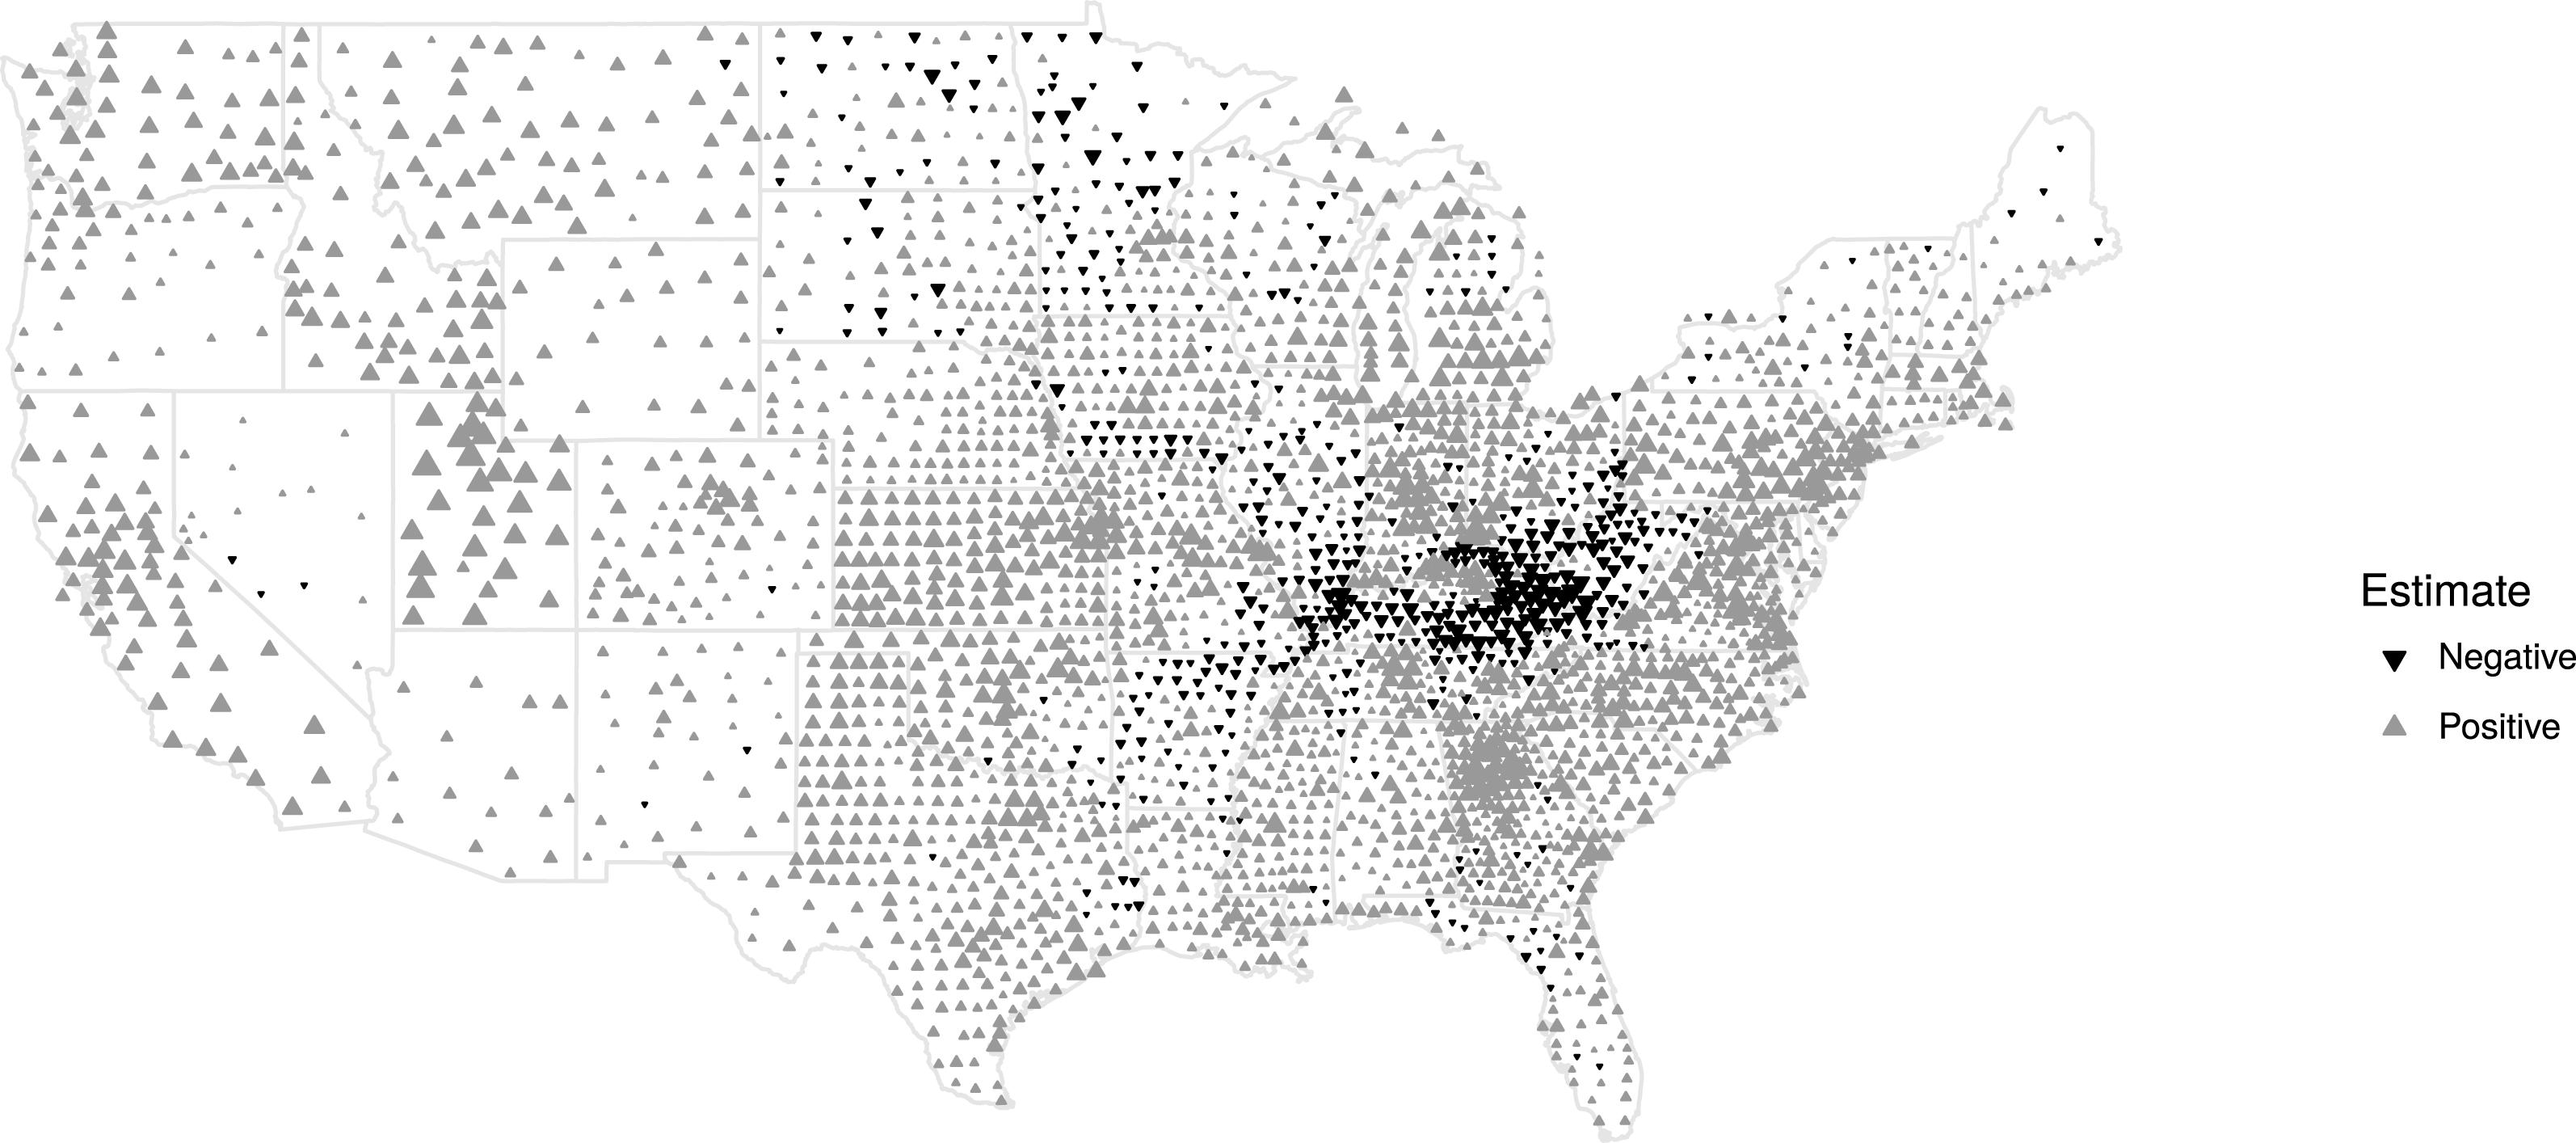
Figure 5 plots the estimates generated using this procedure. Nationwide, after applying a Benjamini–Hochberg correction approximately 12% of estimates are distinguishable from zero, with most significant county-level estimates clustered in the West, Mountain West, and Midwest.Footnote
27
Notably, though the counterfactual scenario we simulated involves a large change in mortality rate, most individual estimates are still insignificant, echoing the small AME size we note in the previous section. However, even with this small average effect size, the magnitude of our county-level estimates remains highly variable. Our estimates are largest in the West and Mountain West, but we also estimate noticeable (and significant) effects in key swing states like Pennsylvania, Ohio, and Michigan. In these latter states, the mortality increase we model produces a predicted change of
 ${\sim}1{-}2$
percentage points in
 $\unicode[STIX]{x1D6E5}GOP$
, which is substantial given the small margins by which the presidential election was decided in these states.Footnote
28
These results are consistent with Monnat (Reference Monnat2016)’s findings, which suggest Trump’s overperformance in high-mortality counties was regionally contingent.
Mortality first differences.

Strikingly, in some regions of the country, the predicted relationship between mortality and
 $\unicode[STIX]{x1D6E5}GOP$
presidential vote share was actually negative. This effect is particularly pronounced (and statistically significant) in parts of Kentucky and West Virginia, but is also noticeable in some neighboring Ohio and Illinois counties. One policy-driven explanation for this finding relates to state-level Medicaid expansion decisions following the passage of the Affordable Care Act. Under the “communities in crisis” hypothesis, the primary causal mechanism is a local dissatisfaction with political elites, and particularly with elite responses to poverty and poverty-related public health crises. In states like Kentucky and West Virginia that chose to expand Medicaid following the passage of the Affordable Care Act, high-mortality counties likely received a substantial portion of new Medicaid spending, which may have buttressed their faith in “establishment” politicians.
Though not conclusive evidence, we argue that these results are at least suggestive. While the model we estimate clearly cannot distinguish the Medicaid expansion’s effect on voter preference from unmeasured local predispositions, our results suggest that policy context matters. Far-reaching policy programs like the Affordable Care Act’s Medicaid expansion provisions might plausibly condition voter receptiveness to the anti-elite message offered by the Trump campaign. Thus, KRLS’s flexibility points to mechanisms worthy of future inquiry.
5.4 Interpreting pointwise marginal effects
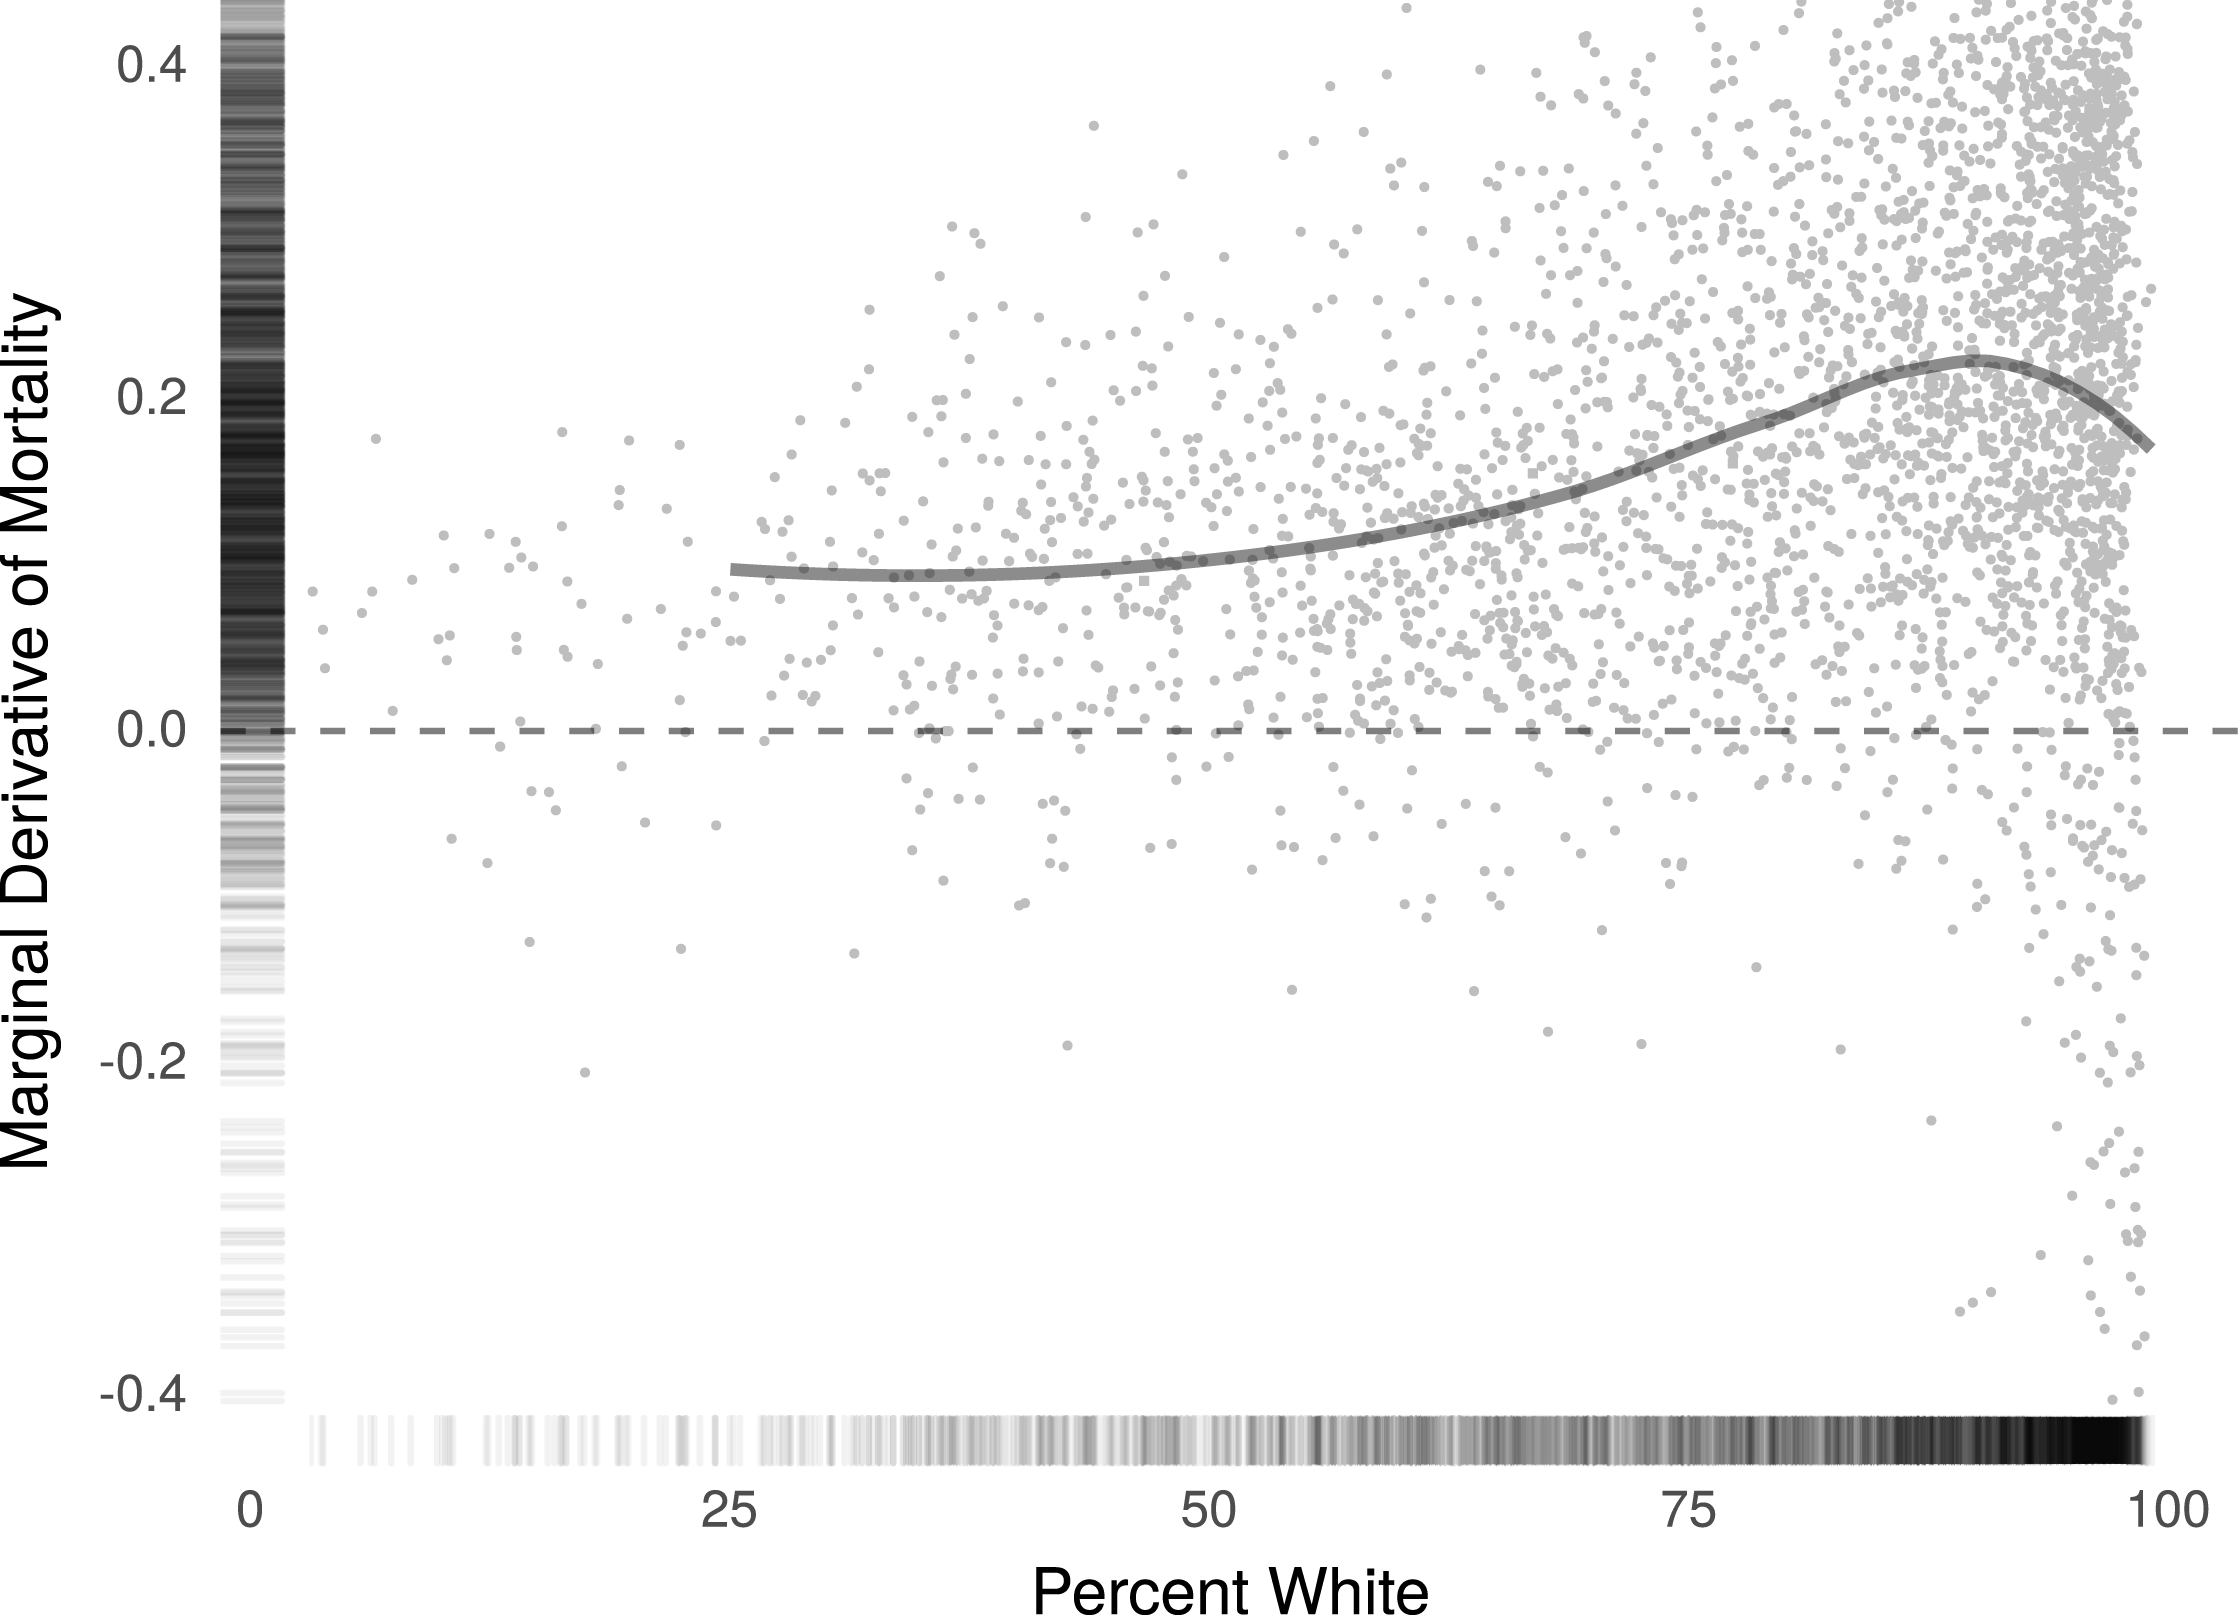
In addition to geographic heterogeneity, the “communities in crisis” hypothesis implies that mortality’s effect should be conditioned by two other factors. First, in line with most postelection commentary, Trump’s appeal should be strongest in White “communities in crisis.” In other words, we should expect the effect of increasing mortality rates to be strongest in communities with larger White populations. Figure 6 weakly supports this hypothesis; however, plotting pointwise marginal effects in this manner suggests that the size of this relationship is small at best, with both majority–minority and majority-White counties displaying roughly similar effect sizes.
Marginal effect of age-adjusted mortality on
 $\unicode[STIX]{x1D6E5}GOP$
presidential vote share, 2012–16, by proportion of White population in each county.

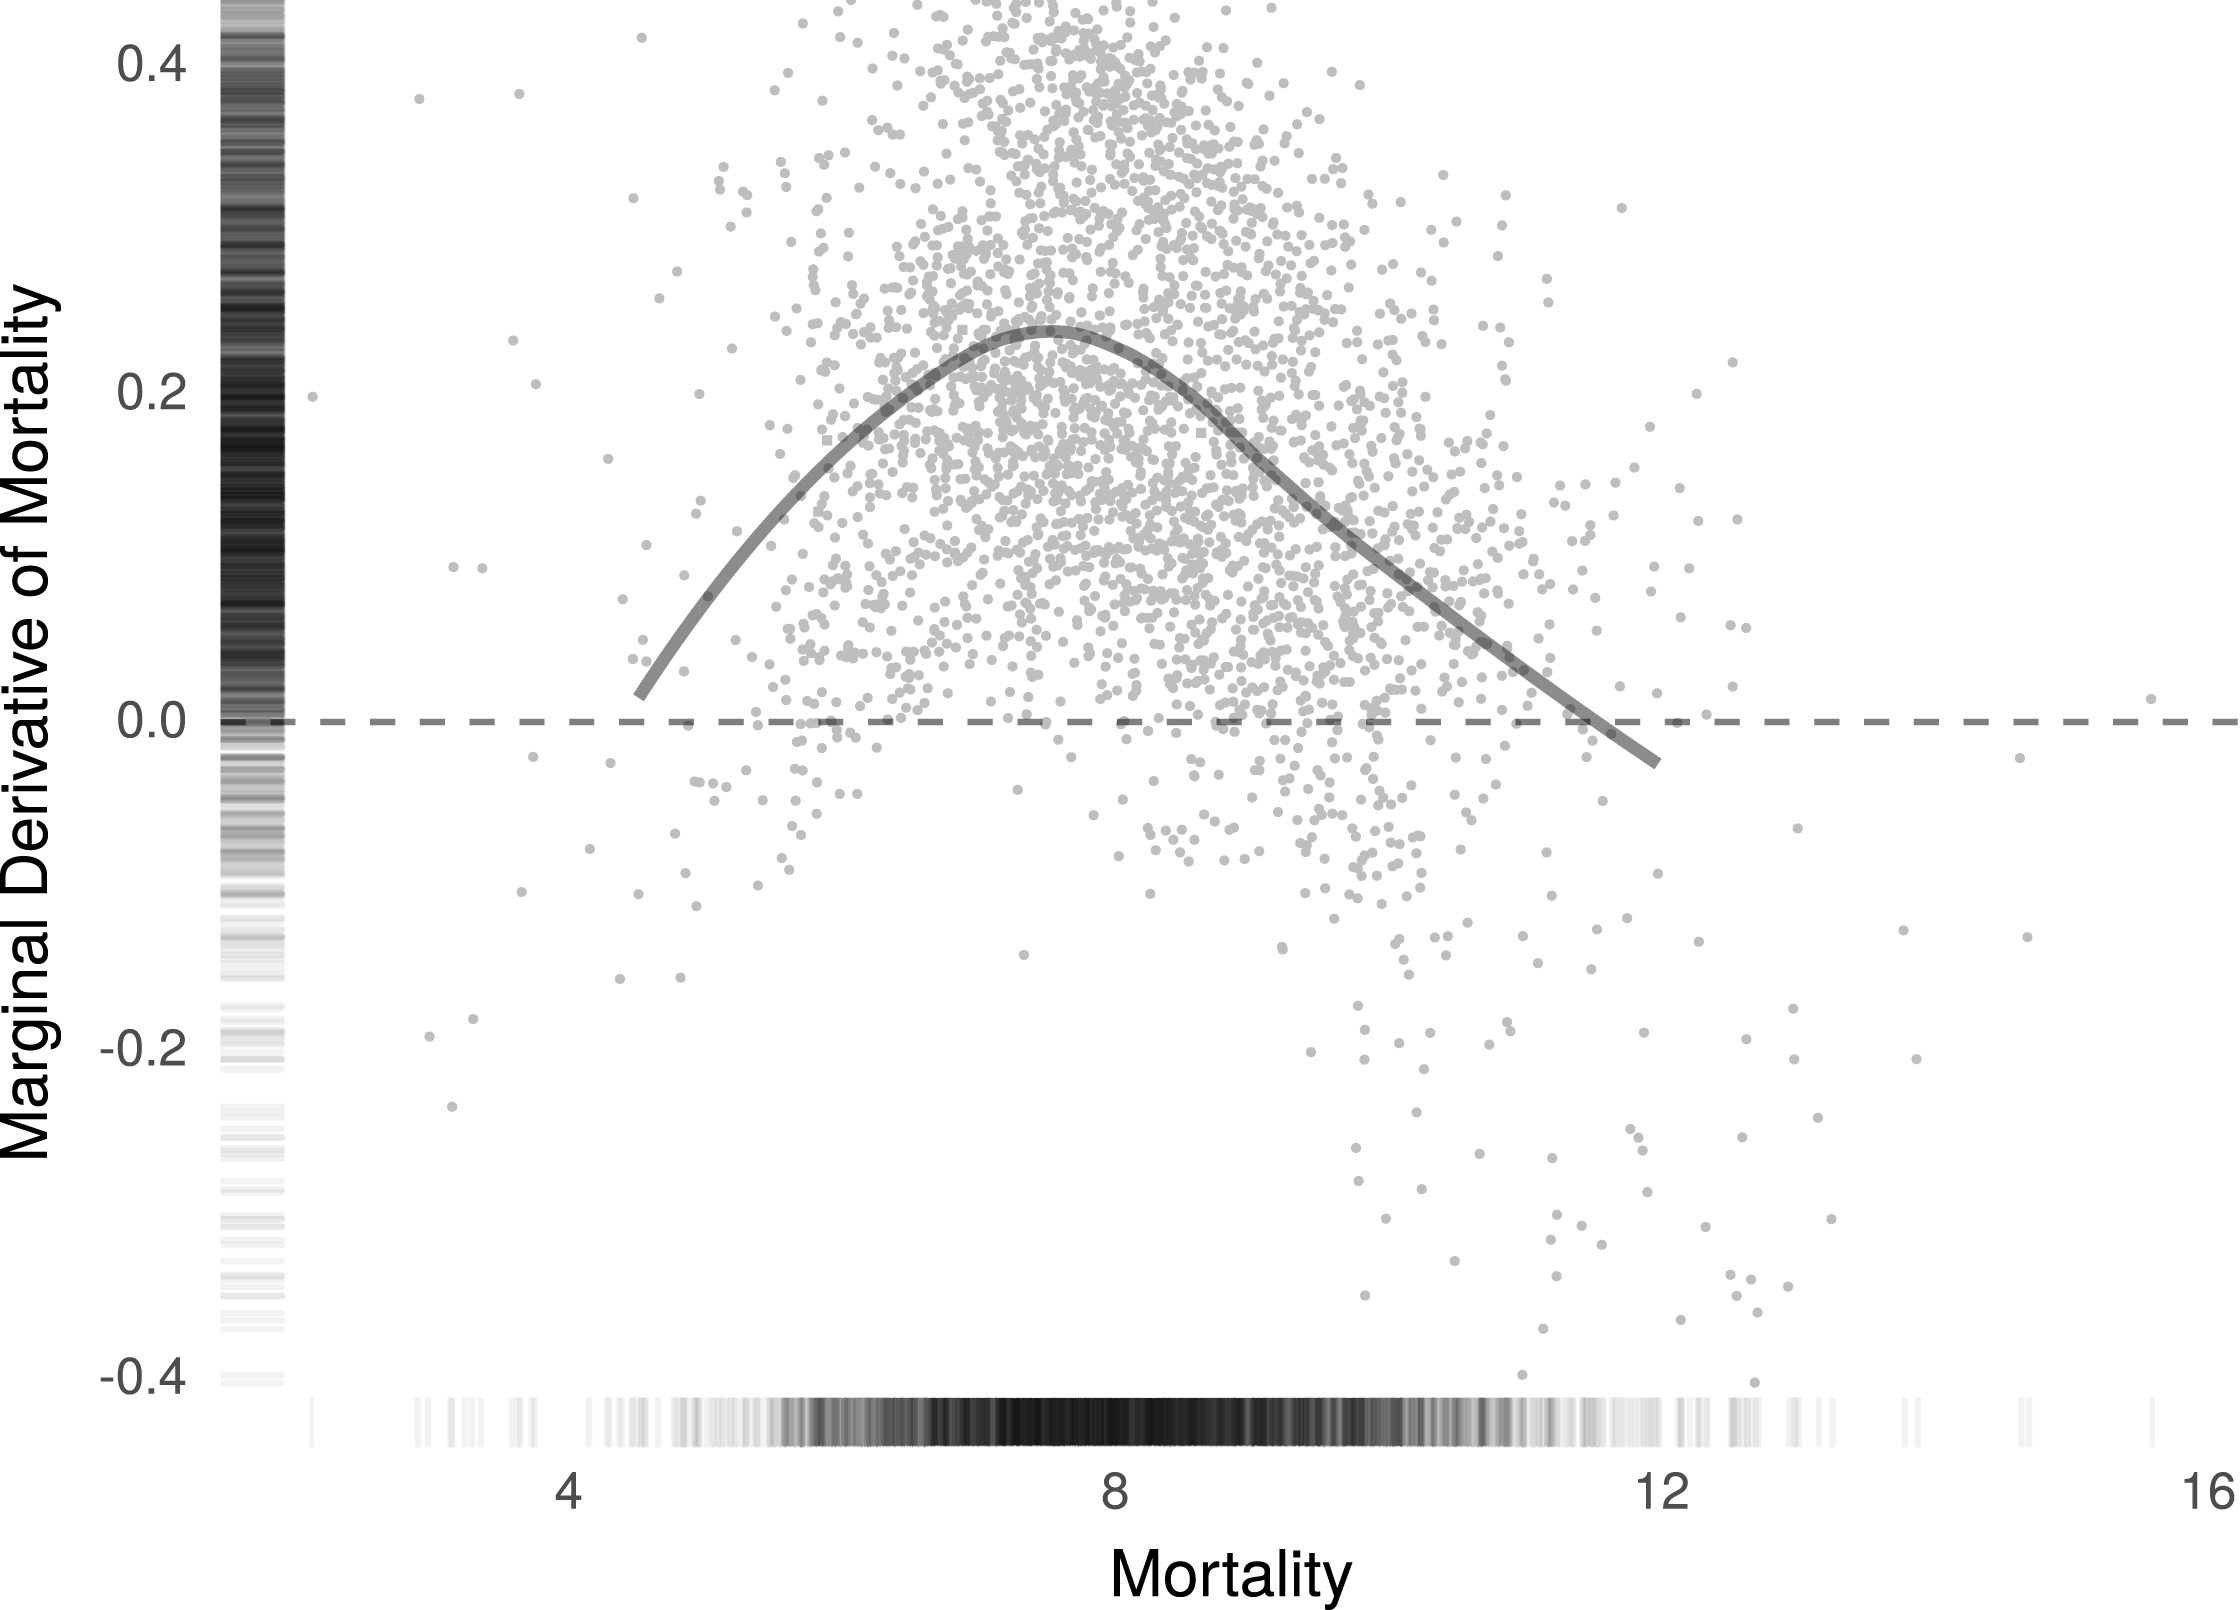
Second, we should also expect the marginal effect of mortality to be increasing. Marginal increases in mortality, in other words, should have a relatively small effect in low-mortality counties, and a much larger one in high-mortality locations (as mortality rates approach “crisis” status). However, as shown in Figure 7, the estimated marginal effect of mortality actually peaks in mid-mortality counties and declines as mortality increases. Based on these results, true “crisis” communities (those with the highest mortality rates) appear to have been less responsive to mortality differences than their moderate-mortality counterparts, suggesting that the mortality effect is largely concentrated within the latter group of localities.
We hasten to emphasize that the discussion of pointwise marginal effects in this section necessarily possesses an exploratory quality. Unlike the first difference estimates we present in the previous section, pointwise hypothesis tests for these quantities are difficult to construct. Developing appropriate pointwise uncertainty estimators represents a fruitful direction for future research.
Marginal effect of age-adjusted mortality on
 $\unicode[STIX]{x1D6E5}GOP$
presidential vote share, 2012–16, by mortality.

6 Conclusion
In recent years, researchers have become increasingly interested in methods and models that combine canonical statistical properties with flexibility, robustness, and predictiveness. Some modeling approaches in this area also emphasize interpretability, which we argue should be viewed as a coequal goal with the other traits mentioned above. The Hainmueller and Hazlett (Reference Hainmueller and Hazlett2013) KRLS paradigm balances many of these concerns and has the capacity to contribute to social science research at a number of stages. Inevitably, KRLS offers no free lunch. By attempting to couple a flexible statistical model with interpretable effect estimates, KRLS encounters a steep scalability curve. We introduce bigKRLS not with the hopes of eliminating the computational burden of
 $N\times N$
calculations but rather in an effort to push the frontier (in terms of both
 $N$
and
 $P$
) for a variety of important political problems. For most applications, our improvements reduce runtime by about 75% and reduce memory usage by an order of magnitude. Our proposed
 $p$
-value correction for the model’s AME further improves on the model’s statistical properties, particularly for complex data-generating processes estimated using smaller samples.
There are a number of exciting areas for future work. Optimizing kernel regularization to scale to truly “big data” applications without compromising inference or interpretability is an open area of research. Though kernels are theoretically well suited to high dimensions (Diaconis, Goel, and Holmes Reference Diaconis, Goel and Holmes2008; El Karoui Reference El Karoui2010), large numbers of
 $x$
variables still create practical problems, both computational and interpretative. Statistically, recent theoretical advances in selective inference (Taylor and Tibshirani Reference Taylor and Tibshirani2015), risk estimation for tuning parameters (Tibshirani and Rosset Reference Tibshirani and Rosset2016), and subsampling (Boutsidis, Mahoney, and Drineas Reference Boutsidis, Mahoney and Drineas2009; Gu, Jeon, and Lin Reference Gu, Jeon and Lin2013; Homrighausen and McDonald Reference Homrighausen and McDonald2016) offer paths forward in high-dimensional space. In the meantime, our analysis suggests that KRLS can produce interpretable and theoretically useful estimates on a perennial topic of interest: the behavior of American voters.
Supplementary material
For supplementary material accompanying this paper, please visit https://doi.org/10.1017/pan.2018.33.