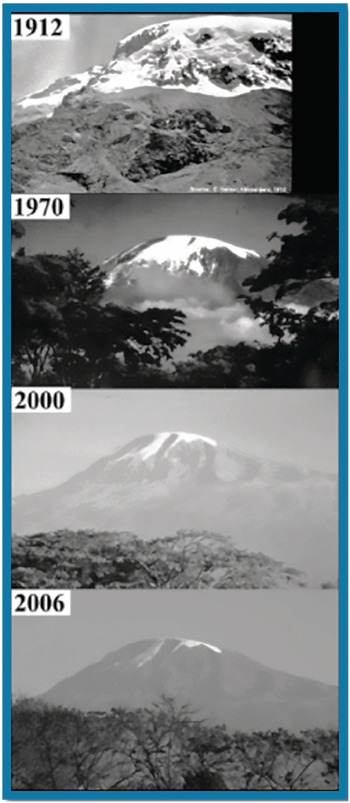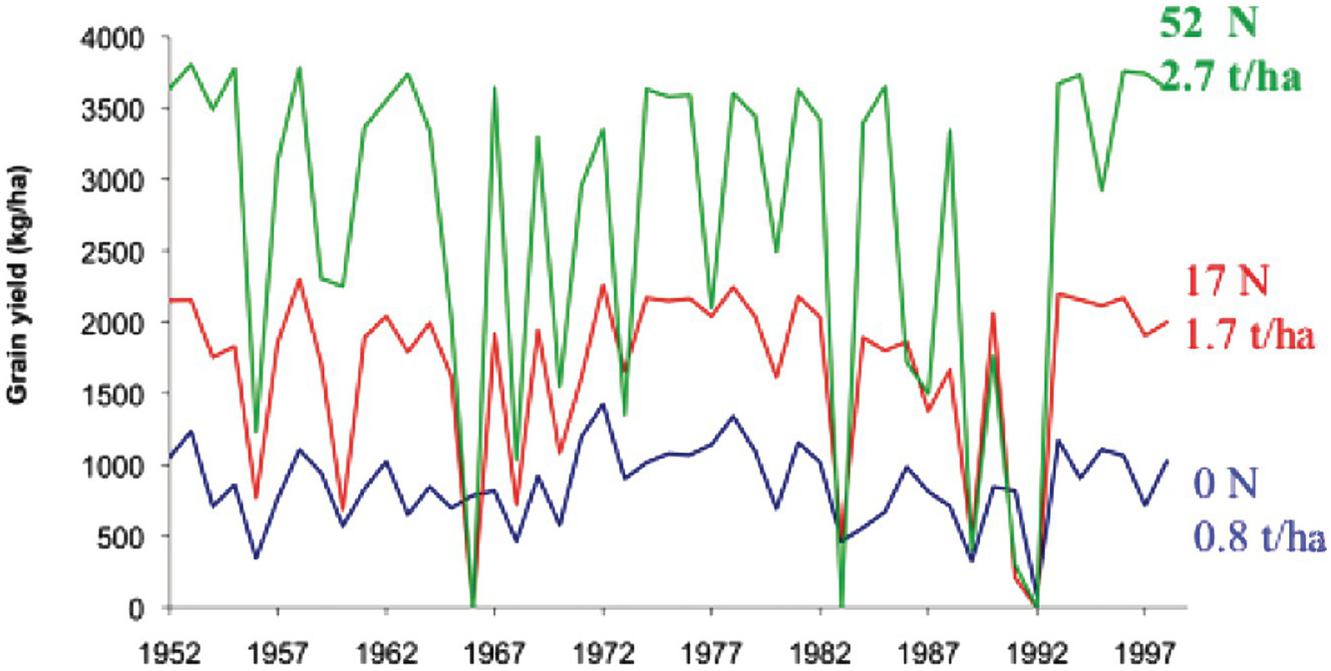


The purpose of this chapter is to provide a framework of the biophysical environment of the tropics. There have been major changes in emphasis since the first edition was published 40 years ago. At that time, I looked at the tropical environment almost exclusively in terms of increasing food production to feed a rapidly growing population. While doing my doctoral research in the Philippines in the late 1960s I never heard the terms climate change, biodiversity, or ecosystem services while working at the University of the Philippines at Los Baños, the International Rice Research Institute (IRRI) and Cornell University. Things have changed for the better. Soil science in the tropics has broadened to encompass tropical ecology as well as tropical agronomy.
1.1 The Tropics Defined
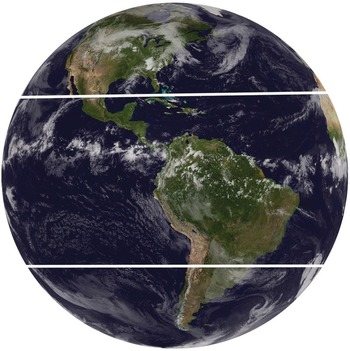
The geographic definition of the tropics includes that part of the world located between 23° 28′ north and south of the equator, that is between the tropic of Cancer and the tropic of Capricorn (Fig. 1.1). Because the tilt of the Earth’s axis has the same angle, these latitudes are the limit of the Sun’s apparent migration to the north or south of the zenith. The tropics are the only part of the world where the Sun passes directly overhead, receiving more energy than the temperate and boreal regions.
The western hemisphere tropics. Heavy lines show the Tropic of Cancer (23.5° N) and the Tropic of Capricorn (23.5° S).

The tropics comprise 38 percent of the Earth’s land surface (approximately 5 billion hectares) and half of the world’s population, about 3.6 billion people in 2013 (according to the FAOSTAT statistics database [fao.org/faostat]). A total of 124 countries and territories lie wholly or mostly in the tropics. They include most of the “developing” countries except those in the Middle East, North Africa, the former Soviet Union, China, Mongolia, North Korea, Pakistan, Afghanistan, Bhutan and Nepal.
The literature is full of attempts to quantify precisely the tropical versus extra-tropical parts of the world. The concept used in this book is the strictly geographical one, which includes the cold tropical highlands as well as the hot lowlands. Like any quantitative geographical definition, it loses meaning at the boundaries because changes are gradual. The tabular data presented in this book follow the latitudinal definition but are based on entire countries. Thus, parts of northern India, northern Bangladesh, northern Mexico, southern Brazil, southern Australia and southern South Africa outside of the tropics are included, whereas parts of southern China and the Arabian Peninsula within the tropics are excluded.
1.2 Temperature and Solar Radiation
1.2.1 Temperature
The reason for choosing the latitudinal definition is its ease of quantification in terms of temperature. The tropics can be defined as that part of the world where the mean monthly surface air temperature variation is 6 °C or less between the average of the three warmest and the three coldest months (Table 1.1). The daily variation is generally within this range.
| Latitude | January | July | Mean annual |
|---|---|---|---|
| 20° N | 22 | 28 | 26 |
| 15° N | 24 | 28 | 26 |
| 10° N | 26 | 27 | 26 |
| 5° N | 26 | 24 | 26 |
| 0 | 26 | 25 | 26 |
| 5° S | 26 | 25 | 26 |
| 10° S | 26 | 24 | 25 |
| 15° S | 26 | 23 | 24 |
| 20° S | 25 | 20 | 23 |
This definition includes the tropical highlands, the difference being their lower overall temperatures. Mean air temperatures generally decrease by 0.6 °C for every 100 m increase in elevation in the tropics. Local variation in topography, rainfall, wind direction, and other factors alters this relationship.
People unfamiliar with tropical regions generally consider them to be oppressively hot and humid. Although this condition certainly exists, it is as broad a generalization as considering the temperate region to be oppressively cold and dry. I have experienced more intense hot and humid conditions in Washington, DC during the summer than in the heart of the Amazon Basin, where one can almost always count on cool night breezes.
Near the equator, tropical climates are hot; averaging 26 °C at low elevations, pleasantly cool at 1000–2000 meters, and positively frigid at elevations above 3000 meters. Travelling in Kenya from hot and humid Mombasa at sea level, through the eternal spring climate of Nairobi (1550 m), and to the top of Mount Kenya with glaciers (5200 m) illustrates this point, as these locations all lie within 3° from the equator. The main point to remember about temperatures in the tropics is their relative constancy rather than any absolute value.
The low but constant temperatures of the tropical highlands constitute one reason why certain temperate crops that require winter chilling for high yields and quality, such as pears, perform poorly in these areas. In addition, it takes longer to grow crops. For example, it takes 5 months to grow a crop of maize in temperate North Carolina and about the same time in the lowlands of Colombia, but in Bogotá, at an altitude of 2800 m, maize requires 11 months to mature. During the growing season in the temperate region, temperatures are higher than in the tropical highlands.
Tropical climates are also different from Mediterranean climates, which are characterized by hot, dry summers and cool, wet winters, with temperature variations higher than in the tropics. Typical Mediterranean crops like red-wine grapes and olives do not do well in the tropics. I have yet to find an excellent red wine produced in the tropics. The best are from the Mediterranean climates of California, Italy, southern France, the Cape region of South Africa, Chile and Argentina.
The least temperature variation occurs within 6° of the equator. As latitude increases, diurnal and seasonal air temperature variations also increase, reaching maximum values in the desert areas near the tropic of Cancer. The widest temperature variation is found in inland areas with the least rainfall, close to the tropic of Cancer, such as Tomboctou, Mali.
Soil temperatures in the tropics, as defined in the Soil Taxonomy system, fall in the “iso” temperature regimes, that is, those with “less than 6 °C difference between the average soil temperature of June, July and August and the average soil temperature of December, January and February at 50 cm depth or to a dense, lithic or paralithic contact” (Soil Survey Staff 1999, 2014). Soil temperatures can be estimated from air-temperature records by adding 2 °C to mean annual air temperatures in the lowland tropics (Murtha and Williams Reference Murtha and Williams1986). Table 1.2 presents the soil temperature regimes as defined by the Soil Taxonomy system along with their corresponding approximate equivalents of mean annual air temperature at the soil surface and elevation at the equator, using a change of 6 °C for each 1000 m increase in elevation.
| Regime | Soil temperature (°C)a | Mean annual air temperature (°C) | Elevation (m) |
|---|---|---|---|
| Isohyperthermic | > 22 | > 20 | 0–900 |
| Isothermic | 15–22 | 13–20 | 900–2000 |
| Isomesic | 8–15 | 6–13 | 2000–3200 |
| Isofrigid | < 8 | < 6 | > 3200 |
a In all cases the difference between mean soil temperature is < 6 ºC between the three warmest and the three coldest months.
The above definition excludes soil temperature variation in the topsoil. This is illustrated in Table 1.3, where the monthly air and soil temperature variations are shown for a soil in Indonesia. Very high soil temperatures have been registered on the surface of bare soils during dry periods. Mohr et al. (Reference Mohr, van Baren and van Schuylenborgh1972) reported a record of 86 °C at the surface of a bare soil in Congo. At a depth of 10 cm, the same bare soil had a nearly normal temperature of 30 °C. At the same site, the surface soil temperature was 34 °C under grassland and 25 °C under forest. Unless exposed, soil temperatures even at the surface do not seriously exceed air temperatures.
| Soil depth (cm) | Highest month (°C) | Lowest month (°C) | Daily variation (°C) |
|---|---|---|---|
| Air | 26.6 | 22.5 | 6.9 |
| 3 | 29.9 | 28.3 | 5.2 |
| 5 | 29.9 | 28.7 | 5.0 |
| 10 | 29.9 | 28.9 | 3.1 |
| 15 | 30.0 | 28.7 | 1.5 |
| 30 | 30.0 | 28.5 | 0.3 |
| 60 | 30.8 | 28.5 | 0.05 |
| 90 | 29.8 | 28.7 | 0.05 |
| 110 | 29.7 | 28.8 | 0.04 |
This buffering is due partly to the relatively low heat capacity of soils, about one-fifth of the heat capacity of water. Any excess heat is reradiated to the atmosphere. This is the reason why one cannot fry an egg even on the hottest soil, whereas it is possible to do so on asphalt because it has higher heat capacity.
1.2.2 Solar Radiation
The tropics receive more solar energy that is available for photosynthesis than the temperate and boreal regions. Because of the spherical shape of the Earth’s atmosphere the Sun’s rays strike almost at right angles near the equator but at increasingly acute angles towards the poles. This concentrates heat in the tropics. Also, as latitude increases, the Sun’s rays have to pass through a thicker atmosphere and lose more energy through absorption, reflection and scattering (Osborne Reference Osborne2000). From 56 to 59 percent of the Sun’s radiation at the rim of the atmosphere reaches the Earth’s surface in the tropics; about 46 percent at 40° latitude (New York City); and only 33 percent at 60° latitude (Stockholm) (Landsberg Reference Landsberg1961).
The average annual solar radiation in the tropics (20.3 MJ/m2 per day) is twice that of the temperate region, and about 2.5 times that of the boreal region (Landsberg Reference Landsberg1961, Reading et al. Reference Reading, Thompson and Millington1995). The annual solar radiation is lowest in the humid tropics (about 15 MJ/m2 per day) due to high cloud cover, and highest (25 MJ/m2 per day) in tropical deserts (Reading et al. Reference Reading, Thompson and Millington1995). In areas with even rainfall distribution, such as rainforests or deserts, there is little seasonality in solar radiation.
In areas with distinct rainy and dry seasons, cloudiness causes considerable seasonality. Table 1.4 shows some examples, with the tropical ones related to irrigated rice-growing areas. In Los Baños, the Philippines, the higher solar radiation during the dry season has a positive impact on irrigated rice yields and nitrogen fertilizer response. Rainy-season irrigated rice yields are almost identical in Yurimaguas, Peru and Los Baños, when solar radiation is relatively low, due primarily to cloudiness.
The highest crop yields in the tropics are in arid, irrigated valleys where solar radiation is very high. This is shown for Lambayeque, Peru, where some of the highest experimental rice yields have been recorded. The situation is similar in other arid, irrigated areas in Mexico, India, Mali and elsewhere.
In the temperate region, the annual solar radiation reaches high levels during the summer months because of longer days, as shown for Ithaca, New York in Table 1.4. The breadbaskets of the temperate region therefore receive more solar radiation during their cropping season than most tropical rainy seasons, giving these temperate regions the advantage on a per-crop basis. But most humid and many subhumid tropical areas can produce more than one crop per year.
1.2.3 Photoperiod
Days in the tropics are shorter throughout the year than days during the growing season in temperate regions. Day length changes during the year, ranging from almost zero at the equator to 2 hours and 50 minutes at 23.5° latitude. The variation in day length in the temperate region is much wider. Tropical plants are considered “short-day” plants, but many are very sensitive to changes in photoperiod. Some cultivars, for example, are so photoperiod sensitive that a 10-minute change in day length prevents flowering. This is why it is not feasible to transport “long-day” crop cultivars from the temperate region to the tropics where the days are short. Such plants would produce low yields.
1.3 Rainfall
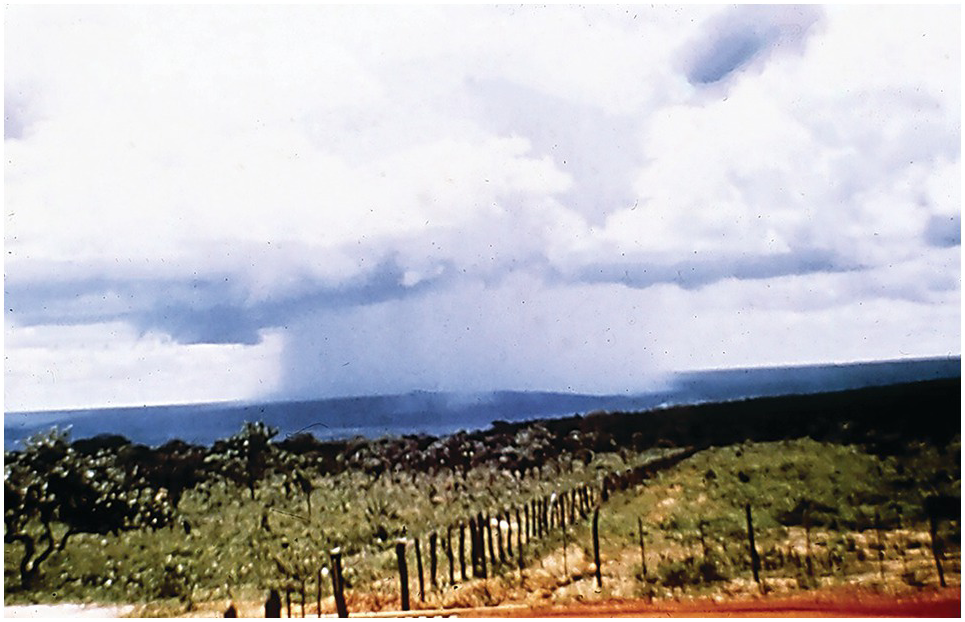
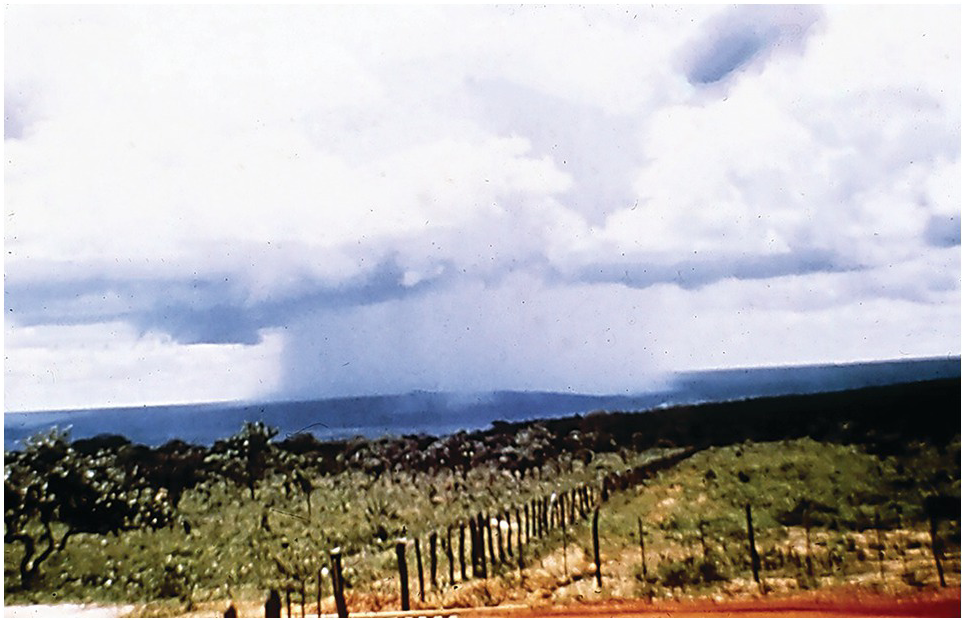
Rainfall distribution – not annual rainfall – is the most important climatic parameter for plant growth in the tropics (Fig. 1.2), and it is the main criterion used to classify tropical climates. The seasons in the tropics are rainy or dry, not cold or hot. As a carryover of temperate influence, the term “summer” is often synonymous to dry season and “winter” to rainy season in many tropical countries.
Rainfall distribution is the most critical biophysical parameter in the tropics. Localized wet-season rains in Planaltina, Brazil.
Rainfall in the tropics is driven by complex circulation patterns and weather disturbances. The main pattern is the movement of the Intertropical Convergence Zone and the main disturbances are the El Niño Southern Oscillation and tropical cyclones.
1.3.1 Intertropical Convergence Zone
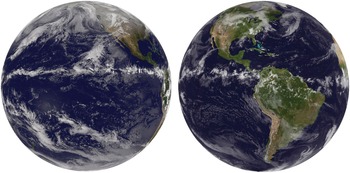
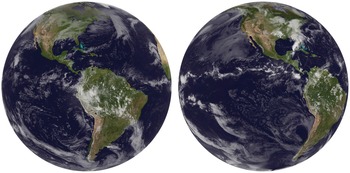
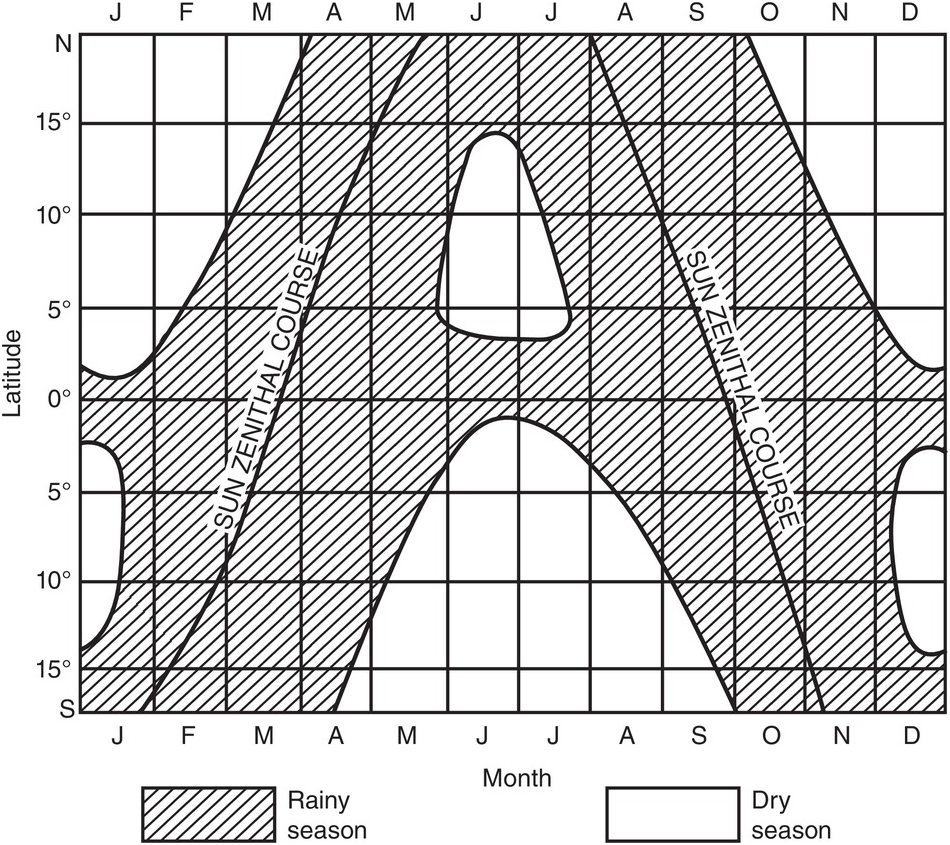
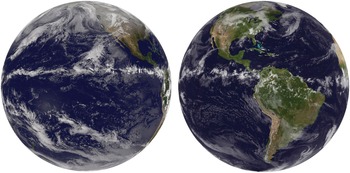
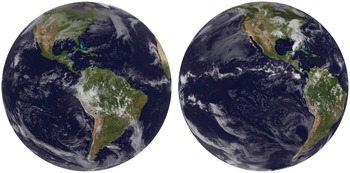
The concentration of radiant heat above the equator warms the air, which rises as it expands. When the warm air rises, it cools, and since cold air holds less water, rain falls. The resulting drier air spreads poleward and falls again at about 30° N and S, creating high atmospheric pressures, where many of the deserts are. The Coriolis force caused by the Earth’s rotation deflects the winds, becoming northeasterly in the northern hemisphere and southeasterly in the southern hemisphere in the tropics. These two “trade winds” mix in an equatorial low-pressure trough known as the Intertropical Convergence Zone. The march of this low-pressure trough causes the rainy seasons. The periods of heaviest rain follow the apparent north–south migration of the Sun in the tropics (Figs. 1.3 and 1.4). Over much of the globe the Intertropical Convergence Zone position is influenced by the ocean, so there is a lag from the time when the Sun is directly overhead (Mark Cane, personal communication, 2016).
The Intertropical Convergence Zone over the Pacific Ocean and Latin America as it moves north towards the equator. Images were taken May 19, 2013, about 1 month before the northern-hemisphere summer solstice (21 June), the longest day of the year in the northern hemisphere.
The Intertropical Convergence Zone at the tropics of Capricorn and Cancer. Left image shows the zone on November 24, 2010, having crossed the equator and approaching the tropic of Capricorn, which it will reach 3 weeks after, on the summer solstice (21 December), the longest day in the southern hemisphere. Right image, taken May 17, 2016, shows the return northwards of the Intertropical Convergence Zone, approaching the tropic of Cancer on 21 June.
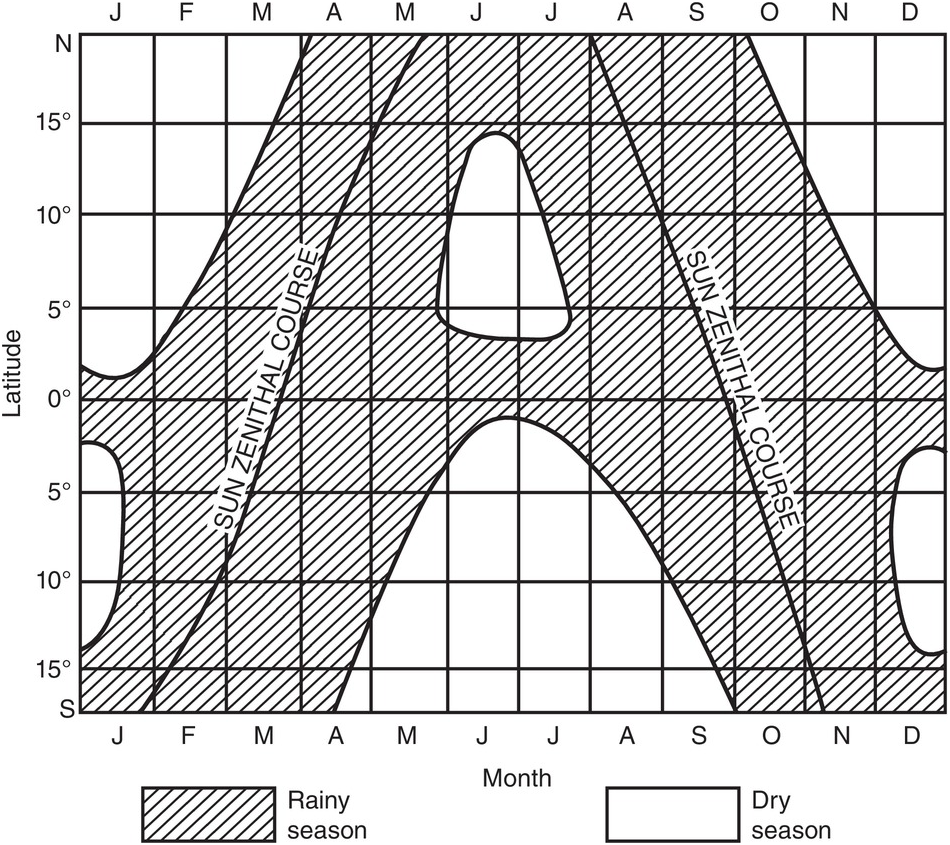
The Intertropical Convergence Zone moves northwards from the equator during the northern-hemisphere summer (June–August) and southwards from the equator during the southern-hemisphere summer (November–January) following the apparent migration of the Sun. It is approximately over the Equator during the summer and winter solstices (21 June and 21 December) and at the tropics during the equinoxes (21 March and 21 September). Although such global generalizations are of limited local value, they correlate well with the timing and length of dry seasons, including the bimodal pattern of two dry seasons and two rainy seasons within 5° of the equator (Fig. 1.5). These equatorial regions receive periods of maximum rainfall when the Intertropical Convergence Zone crosses the equator.
The march of rainy and dry seasons in the tropics (De Martonne Reference De Martonne1957).
1.3.2 Monsoons
Monsoon is the Arabic word for season and it’s used in the context of change in the direction of winds. Monsoons are an actual manifestation of the movement of the Intertropical Convergence Zone northward in India (Gadgil Reference Gadgil2003). Their consequences extend beyond the tropics, to 35° N on the Indian subcontinent. Here land masses heat more rapidly than the Indian Ocean during the hotter months, drawing humid air from it. A similar situation takes place in West Africa and in northern Australia (Osborne Reference Osborne2000). The variability of monsoon rains under the Intertropical Convergence Zone is a critical feature of the Indian subcontinent, affecting hundreds of millions of people. The East African coast is also affected by the Indian monsoon. The kazkazi north to northeasterly winds provide rains during the hot season from October to May, while the kusai, the cooler and stronger winds from the southern Indian Ocean, take place during the dry season. It is important to remember that monsoon wind and rainfall changes are produced by the Intertropical Convergence Zone, not by a separate phenomenon.
An idealized diagram of the march of the seasons in tropical regions appears in Fig. 1.5.
1.3.3 El Niño Southern Oscillation
The El Niño Southern Oscillation (sometimes abbreviated to ENSO) is an irregular low-frequency oscillation between a warm (El Niño) and a cold (La Niña) stage in the tropical Pacific Ocean (Cane Reference Cane2005). The normal tropical eastern Pacific high pressure is associated with southerly winds. The winds create strong coastal upwelling and drive the cold Humboldt Current northwards, resulting in coastal deserts in Peru and Chile. Starting at about 6° S the southeasterly trade winds normally move the cold waters westwards. Surface water is gradually warmed under the tropical Sun as it crosses the equatorial Pacific Ocean, creating a pool of very warm water in the western equatorial Pacific that produces low atmospheric pressures and high rainfall as it reaches equatorial Southeast Asia. The western equatorial Pacific Ocean around Indonesia becomes 30 cm higher than the eastern Pacific Ocean.
When the trade winds collapse this mountain of water spreads east, bringing warmer sea surface temperatures and rains to the coastal desert around Christmas time. Peruvian fishermen of the nineteenth century called these events “El Niño” (for baby Jesus).
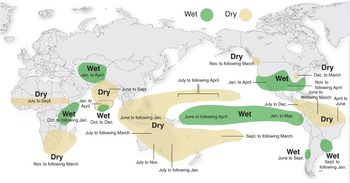
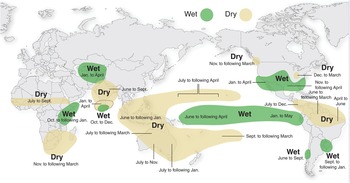
El Niño affects the entire tropics and beyond (Fig. 1.6). The main disturbances are droughts in Southeast Asia and Australia, the weakening of the monsoon rain-bearing winds on the Indian subcontinent, droughts in southern Africa (south of and including Malawi), and droughts in the Sahel and in parts of Central America, the Caribbean, and the northern Amazon. Wetter and warmer than normal weather takes place in East Africa, parts of Central Asia, across the southern half of the United States from California to Georgia, and in parts of the US Midwest and the La Plata basin of South America. Forest fires in Alberta, Canada are affected by El Niño, and two recent winter Olympics were too warm for snow to fall during El Niño years (Mark Cane, personal communication, 2016). There seems to be less hurricane activity in the Atlantic during El Niño years.
The main consequences of El Niño events across the world.
The larger the increase in seawater temperature under the Intertropical Convergence Zone, the more intense the El Niño events are, but the global impacts also depend on the timing of the El Niño with respect to the seasonal pattern of sea-surface-temperature changes in the tropical Pacific and whatever opposing or reinforcing effects the rest of the climate system imposes. Nevertheless, there will be more intense rainfall during El Niño events because there will be more available moisture (Mark Cane, personal communication, 2016).
La Niña events produce colder sea surface temperatures and less rainfall. The effects are also felt widely as the opposite of El Niños.
I experienced my first El Niño in 1971 when living in Chiclayo, a coastal desert city of Peru, while working on irrigated rice. What a terrible thing rain is in a desert that normally gets none! Adobe houses melted and irrigation and sewage systems were disrupted, spreading mud and filth all over.
My second El Niño was in 1992, this time in Africa, when many agroforestry experiments were wiped out by drought in Malawi, Zambia and Zimbabwe, while floods disrupted crops and infrastructure in Kenya. Similar “oscillations” are now beginning to be recognized in other oceans, but not to the magnitude of El Niño. In effect, most of the world is affected by El Niño. Because of this global effect, climatologists assert that “the tropics rule the world’s climate” (Cane and Evans Reference Cane and Evans2000).
1.3.4 Moisture Availability Index
As indicated before, rainfall distribution, rather than the total amount, is the most important climatic parameter for tropical plant growth. The number of consecutive months when soil moisture is limiting plant growth is used to differentiate tropical climates for agriculture as well as delineate natural systems. A dry month is traditionally and arbitrarily defined as one with less than 100 mm of rainfall.
A more detailed definition used by the Food and Agriculture Organization of the United Nations (FAO) Agroecological Zones project is that of the growing period, defined as the number of days during the year where the average precipitation exceeds half the potential evapotranspiration plus the days required to evaporate 100 mm of stored soil moisture (FAO 1981).
Reliance on average values has led to disastrous results. One of most notorious examples of such was the British Groundnut Scheme in Tanzania during the late 1940s (Wood Reference Wood1950). The area had an average rainfall of about 700 mm during the rainy season, which is sufficient in quantity and length to grow peanuts. On this basis, several thousand hectares were planted to peanuts. They received 250 mm of rain during the first year and 300 mm the second, resulting in massive crop failures costing about 100 million dollars (in 1950 dollars).
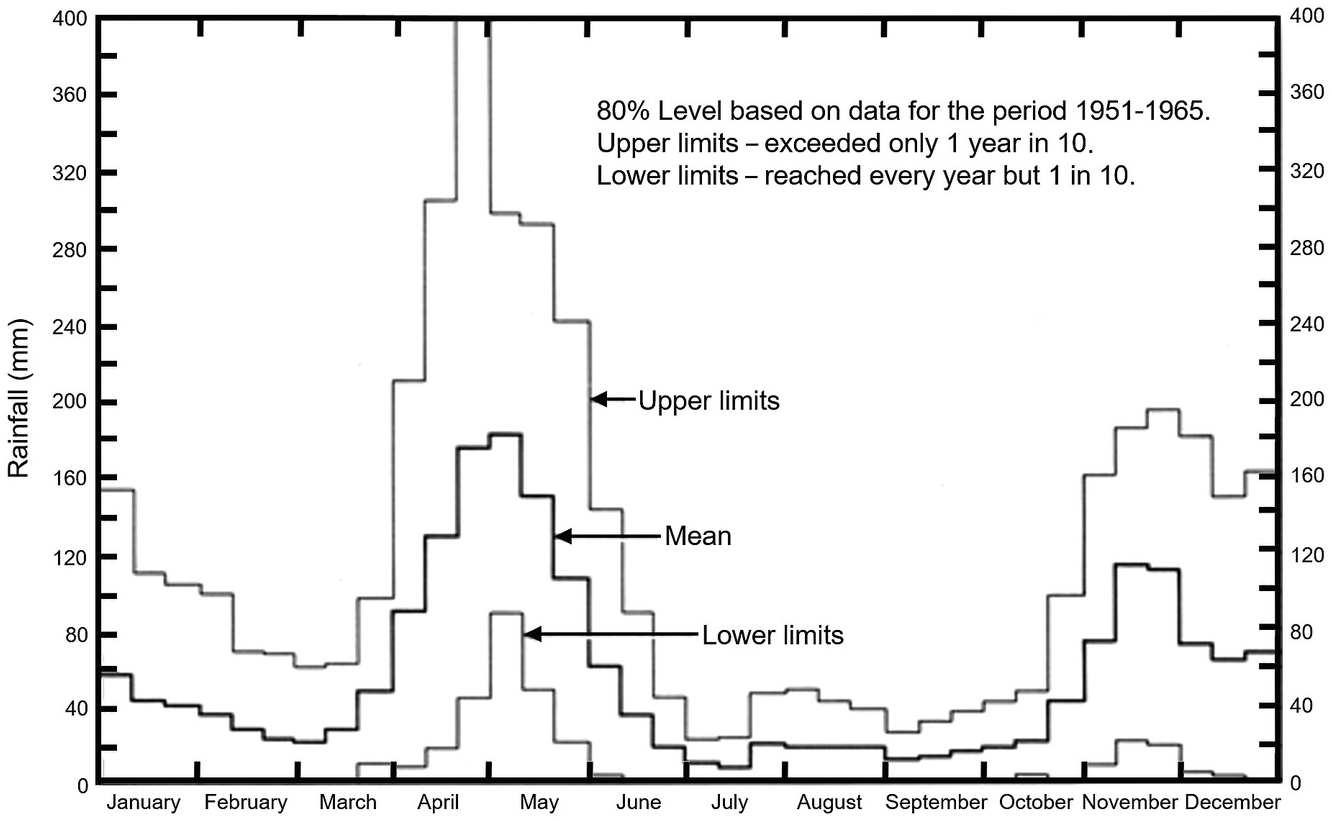
Given the high variability, it is better to use a probability statement in rainfall data. An example of weekly rainfall probabilities is presented in Fig. 1.7 for Muguga, Kenya. Rainfall probabilities have been used to develop the Moisture Availability Index (MAI) concept (Hargreaves Reference Hargreaves1977). MAI is the ratio of the monthly dependable precipitation (75% probability level) divided by the potential evapotranspiration, in effect predicting the intensity of drought stress. MAI values > 1.00 predict no stress; from 0.67 to 1.00, slight probability; from 0.67 to 0.33, moderate; and < 0.33, highly probable drought stress.
Confidence limits of expected rainfall in Muguga, Kenya.

The dry season is then defined as consecutive months with MAI values lower than 0.33, which reflects a high probability of serious drought stress to crops. Whenever more than 20 years of rainfall records are available this procedure, or a similar one, should be used in favor of average rainfall values. The MAI concept has been used effectively in Latin America (Cochrane et al. Reference Cochrane, Sanchez, de Azevedo, Porras and Garver1985).
1.3.5 Rainfall Intensity
Rainfall intensity (mm H2O/hour) is also variable, largely depending on whether the rains are advective or convective. Advective rains are caused by air masses moving inland from the ocean or up a mountain range, causing drizzle, fog, high humidity and low-intensity rains for several days. I have endured this several times in the Amazon as well as in New York State. Most tropical rainfall, however, is convective (Kellman and Tackaberry Reference Kellman and Tackaberry1997). Convective rains, caused by localized warming and rising air, develop into localized thunderstorms, which cause high-intensity rainfall for short periods. Such intense rains may result in direct crop damage and runoff, even in flat areas. It has been estimated in Surinam that 80 percent of a 10 mm/hour rain is retained by the soil, whereas only 32 percent is retained during a 50 mm/hour rain (Mohr et al. Reference Mohr, van Baren and van Schuylenborgh1972).
1.3.6 Soil Moisture
Many attempts have been made to classify rainfall quantitatively in tropical climates. Since all of these are based on rather arbitrary assumptions and since our interest in rainfall lies in its role as a source of soil moisture to plants, the soil moisture terminology of the Soil Taxonomy system (Soil Survey Staff 1999, 2014) is used in this text.
The soil moisture regime is defined according to Table 1.5, based on the moisture control section. The moisture control section is defined as that part of the soil between the following two depths: (1) the upper boundary is the depth to which a dry soil will be moistened by 2.5 cm of water in 24 hours and (2) the lower boundary is that reached by 7.5 cm of water in 48 hours (Soil Survey Staff 1999). Roughly, this corresponds to depths of 10–30 cm for fine loamy, silty and clayey soils, 20–60 cm for coarse loamy soils, and 30–90 cm for sandy soils. The term “dry” refers to soil moisture tensions of at least –1.5 MPa (megapascals, or 15 atmospheres), that is, at or above the wilting point of most plants. A normal year or a normal month is one within plus or minus one standard deviation from the long-term mean (at least 30 years of data). Additional caveats are described in the latest editions of Soil Taxonomy, such as the 12th edition (Soil Survey Staff 2014).
| Soil moisture regime | Consecutive months per year when control section is dry |
|---|---|
| Udic | < 3 |
| Ustic: | 3–9 |
| Typic tropustic | 3–6 |
| Aridic tropustic | 6–9 |
| Aridic | > 9 |
| Aquic | Evidence of chemical reduction due to waterlogging |
The intent of this definition is to facilitate the estimation of soil moisture regimes from climatic data. The udic soil moisture regime is defined as when the control section is dry for less than 3 consecutive months, implying that water stress will be absent during most of the year. It is roughly equivalent to the humid climate for most tropical soils. The ustic soil moisture regime indicates one rainy season of three months or more, which encompasses both subhumid and semiarid tropical climates. The aridic soil moisture regime implies a very short rainy season, insufficient for most crops to grow, and it is well correlated with desert climates. The aquic regime is typical of poorly drained sites and occurs even in deserts. Four soil moisture regimes are recognized in the tropics (Table 1.5) with sample locations listed in Table 1.6.
| Soil moisture regime | Tropical Africa | Tropical America | Tropical Asia |
|---|---|---|---|
| Udic | Nairobi, Kenya | Yurimaguas, Peru | Kuala Lumpur, Malaysia |
| Ustic: | |||
| Typic tropustic | Tamale, Ghana | Brasília, Brazil | Hyderabad, India |
| Aridic tropustic | Ouagadougou, Burkina Faso | Santiago de Cuba | Mysore, India |
| Aridic | Khartoum, Sudan | Lambayeque, Peru | Dadiangas, Philippines |
| Aquic | Maun, Botswana | Pantanal of Brazil | Banjarmasin, Indonesia |
The proposed subdivision of the ustic by van Wambeke (Reference van Wambeke1982) helps soil moisture regimes fit better with tropical ecosystems. Although not officially part of the Soil Taxonomy system (Soil Survey Staff 2014) I use two subdivisions because they make eminent sense. The typic tropustic is roughly correlated with the subhumid tropics and savanna vegetation. The aridic tropustic is roughly correlated with the semiarid tropics and semiarid vegetation.
Variation in soil properties and topography permit the existence of different soil moisture regimes under the same rainfall regime. A deep sandy soil may be ustic in a humid tropical climate because of rapid drainage.
1.4 Tropical Climates
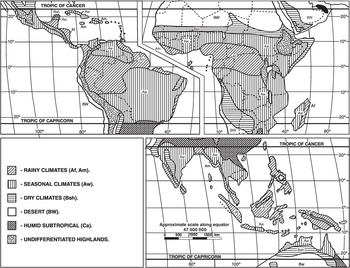
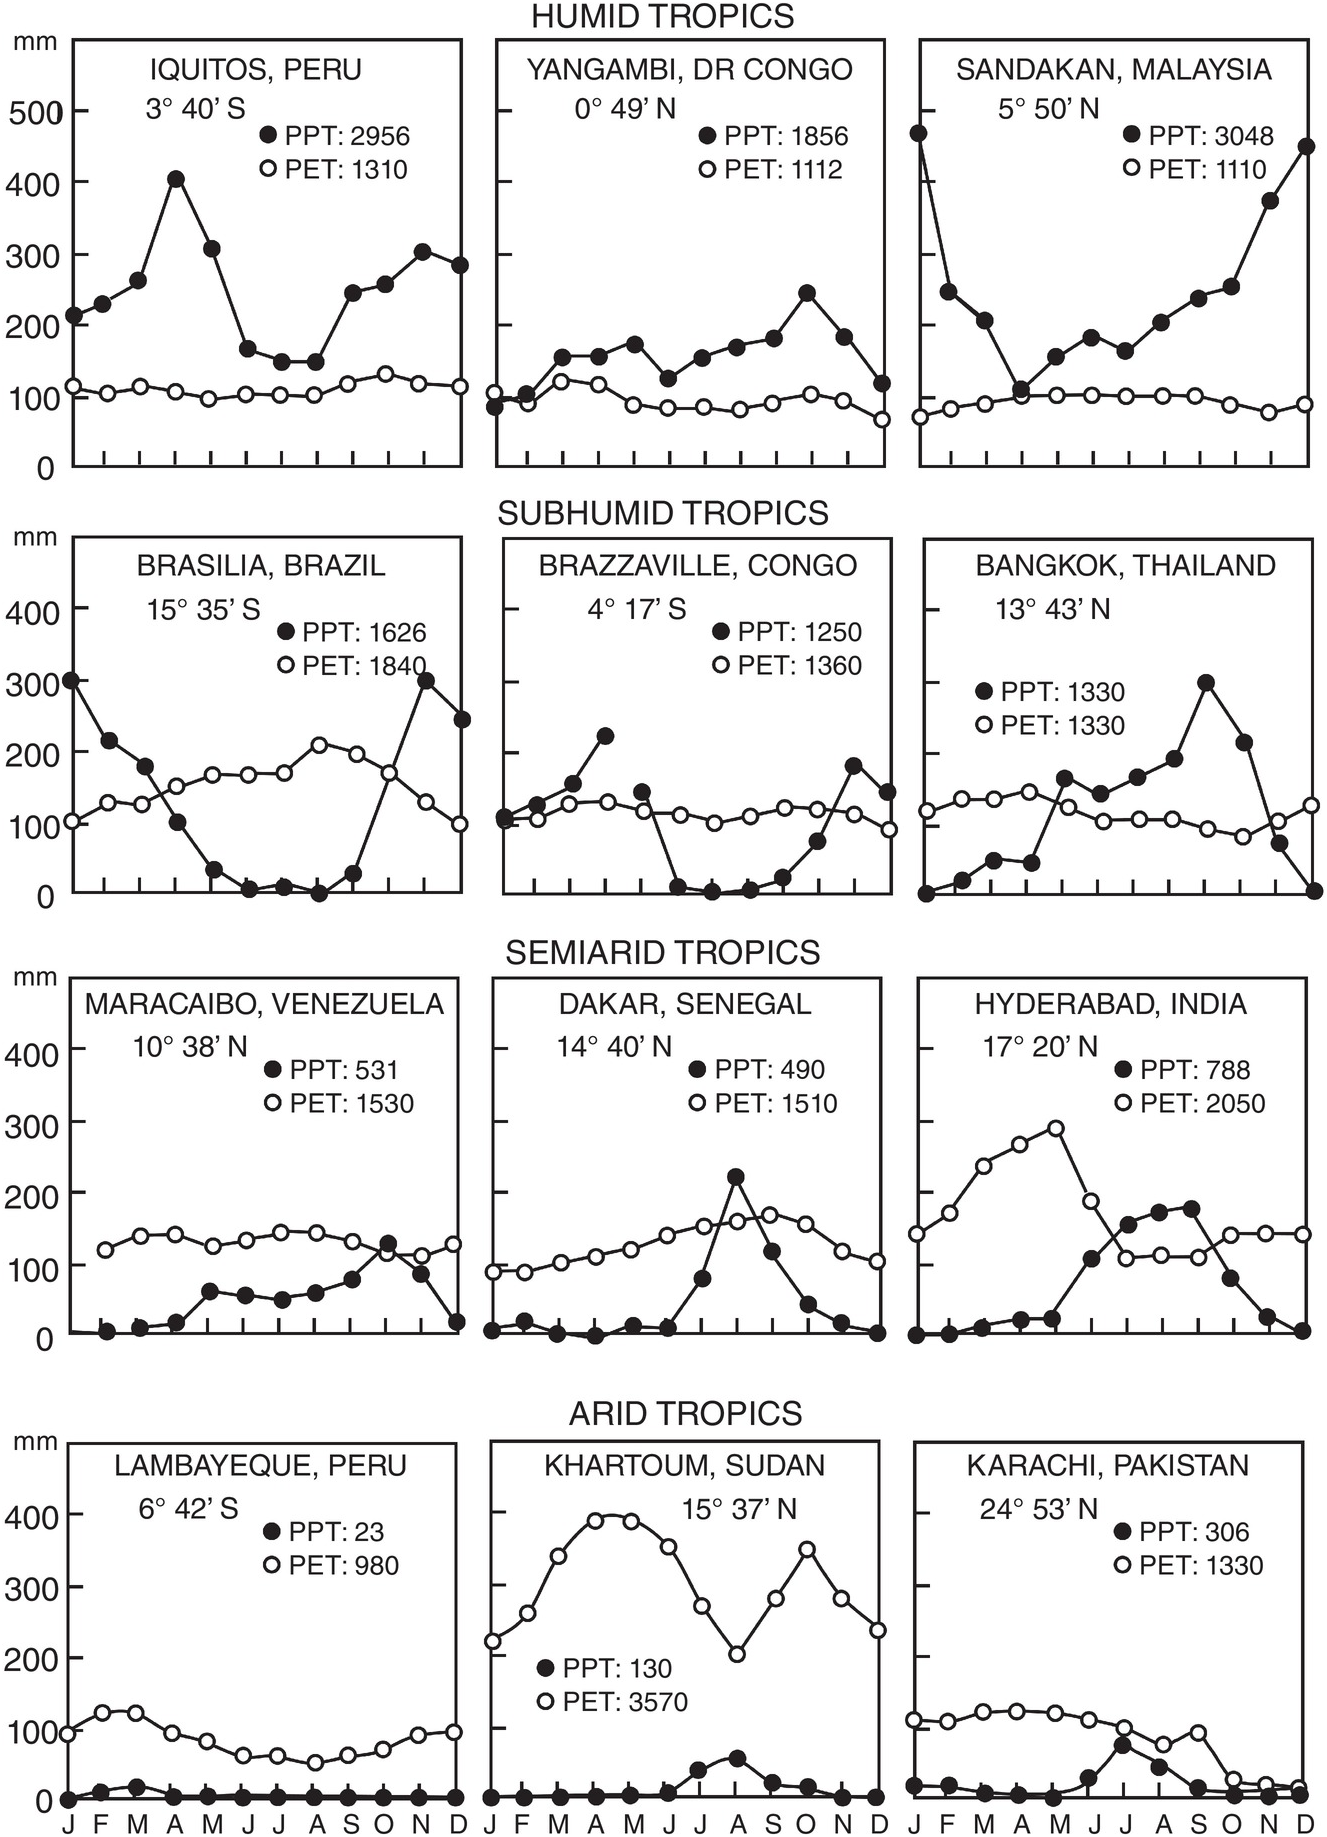
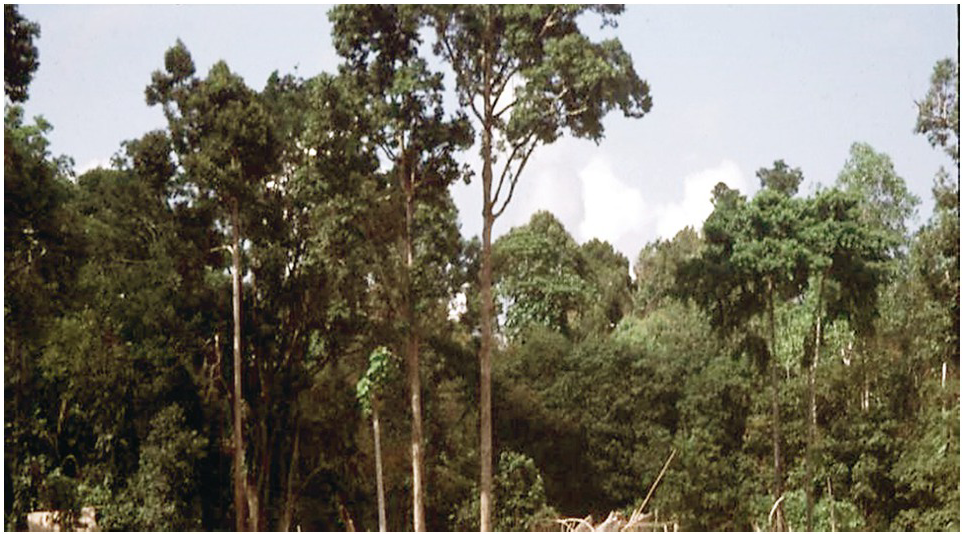
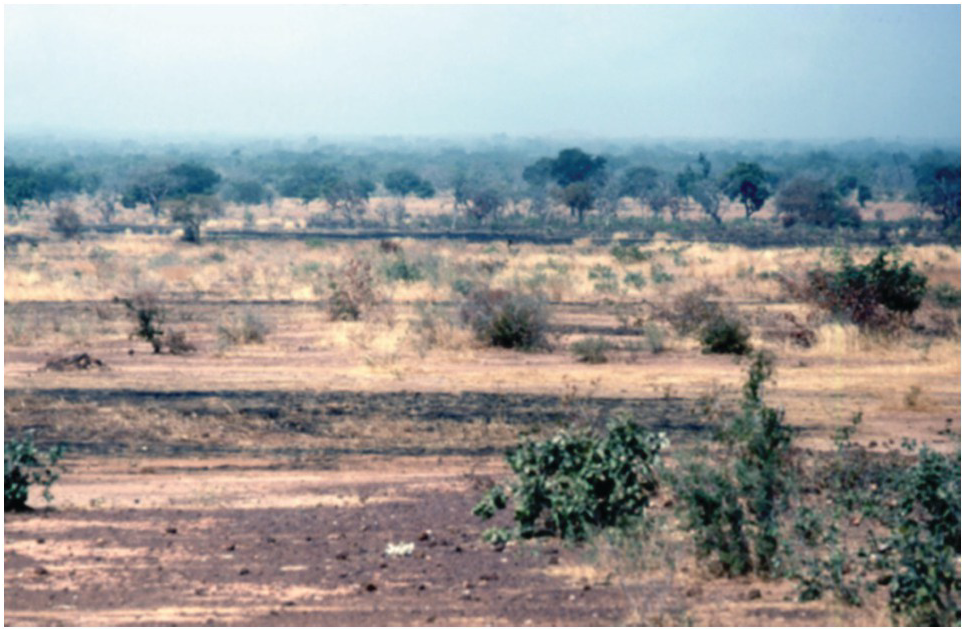
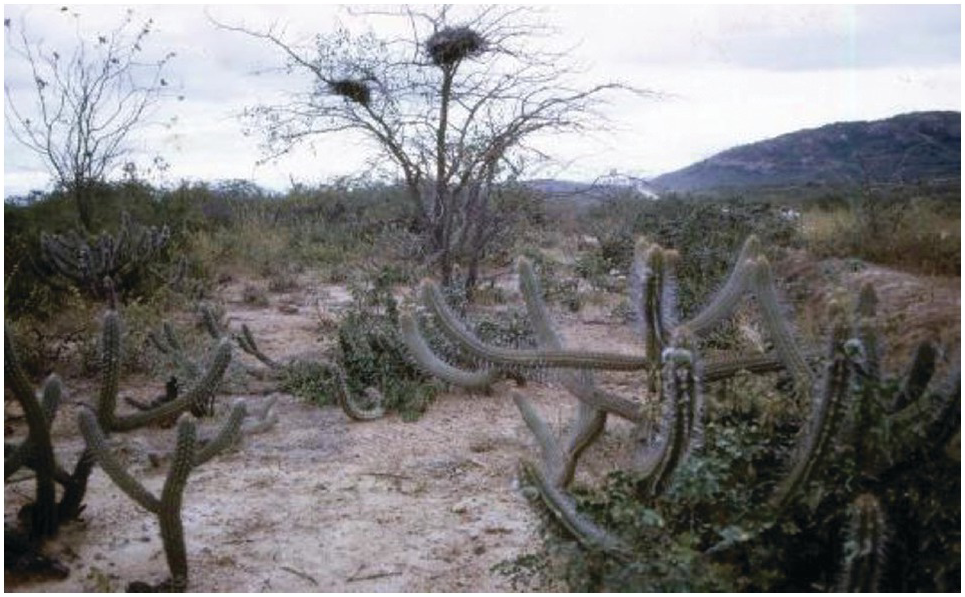
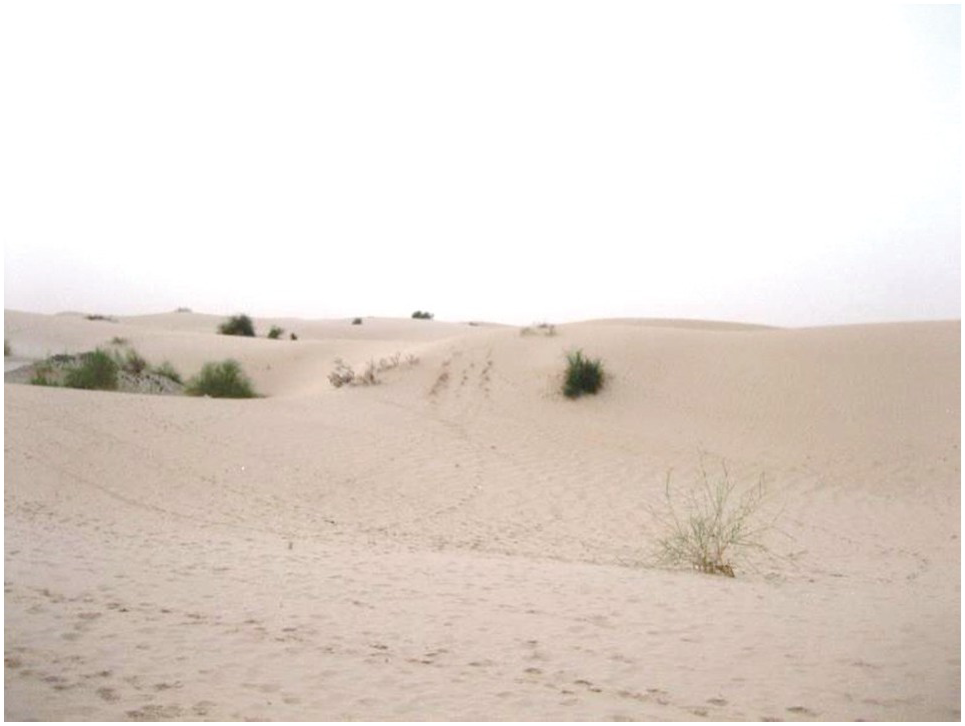
Many approaches have also been used to classify tropical climates, basically how to distinguish a rainfall/natural vegetation continuum between rainforests and deserts. Basically, all are based on the original classification of Wladimir Köppen and Rudolf Geiger in 1936, updated by Rodenwaldt and Jusatz (Reference Rodenwaldt and Jusatz1963) and Kotteck et al. (Reference Kotteck, Greiser, Beck, Rudolf and Rubel2006). I have chosen four main tropical climates that are most relevant to this book, the rainy climates (Af, Am), the seasonal climates (Aw), the dry climates (Bsh) and the deserts (BW). They are based on the length of the rainy seasons. Their associated natural vegetation and main soil moisture regimes are indicated in Table 1.7. The geographical distribution of such climates is shown in Fig. 1.8. About 24 percent of the tropics are humid, 49 percent subhumid, 16 percent semiarid and 11 percent arid. Such climates occur at all elevations in the tropics and are interspersed with natural wetlands and irrigated agriculture. Three examples of each tropical climate type are shown in Fig. 1.9.
| Tropical climate | Köppen– Geiger termino-logy | Humid months (> 100 mm) | Natural vegetation | Million ha | Percent of tropics | Main soil moisture regime |
|---|---|---|---|---|---|---|
| Subhumid tropics | Seasonal climates (Aw) | 4.5–9.5 | Savannas, deciduous forests or woodlands | 2430 | 49 | Typic tropustic |
| Humid tropics | Rainy climates (Af, Am) | 9.5–12 | Humid tropical forests | 1191 | 24 | Udic |
| Semiarid tropics | Dry climates (Bsh) | 3–4.5 | Shrubs and trees with discontinuous grass cover | 771 | 16 | Aridic tropustic |
| Arid tropics | Desert (BW) | 0–2 | Deserts | 558 | 11 | Aridic |
| Total | 4950 | 100 |
Geographical distribution of tropical climates.


1.4.1 Subhumid Tropics
The subhumid climate covers about half of the tropics. It is characterized by distinct seasonality of rainfall, with 4.5 to 9.5 humid months per year. Close to the equator the subhumid tropics have a bimodal distribution, with two short rainy seasons and two short dry seasons, making it possible to grow two crops per year. At latitudes higher than 5° the subhumid tropics have one long dry season and one long rainy season, permitting one crop a year without irrigation.
The subhumid tropics include the Cerrado of Brazil, the Llanos of Colombia and Venezuela, eastern Amazonia, the Pacific coast of Central America and Mexico, and most of Cuba in Tropical America. In Africa, they include most of the continent south of the Sahel and north of the Kalahari Desert (except the humid Congo Basin), and are flanked by semiarid areas in East and southern Africa. In Asia, the seasonal, subhumid climates cover most of India, mainland Southeast Asia and a belt in northern Australia. These are the most agriculturally productive tropical climates where the breadbaskets of Asia, Latin America and West Africa are located. One of its main assets is that the dry season breaks many biological cycles of pests, acting in a similar way to the winter in temperate regions. Examples of three locations with this rainfall regime appear in Fig. 1.9.
1.4.2 Humid Tropics
The humid tropics have a short dry season or none at all, with 9.5 or more rainy months per year, where rainfall exceeds potential evapotranspiration. They occupy roughly one-fourth of the tropics, mostly near the equator. The largest areas are the Amazon Basin, the Congo forest, most of Indonesia, Malaysia, New Guinea, many Pacific islands, the Atlantic coast of Central America, the Atlantic coast of Brazil, the Pacific coast of Colombia and parts of coastal West Africa, eastern Madagascar and the Philippines. At low elevations (isohyperthermic soil temperatures), the lowland humid tropics are the stereotypical tropical climate – hot and humid. Three examples of humid tropical climates are shown in Fig. 1.9, one for each major tropical region. Rice and root crops are the predominant food crops. This is where cacao, oil palm, rubber, coconuts, and many other tree crops are grown. Often, two or more short-term crops can be grown annually, without irrigation.
There are considerable highland humid tropical climates with isothermic soil temperature regimes. Irish potatoes, wheat, bananas and coffee are abundant. Many montane humid tropical forests are cloud forests with unique biodiversity.
1.4.3 Semiarid Tropics
The semiarid tropics, also known as drylands, are characterized by one short, intense rainy season of 3 to 4.5 months and a protracted dry season. They cover about 16 percent of the tropics, including much of Mexico, northeast Brazil, the Sahel, parts of East and southern Africa, India and Northern Australia. Shrubs and trees with a discontinuous grass cover comprise the most widespread native vegetation, where only short-duration, drought-tolerant crops such as sorghum and millet can be grown with reasonable assurance without irrigation. The prevalence of grazing livestock increases as the length of the dry season increases, often replacing crops as the main form of agriculture. Examples of three locations with this rainfall regime appear in Fig. 1.9. Only one crop is grown annually.
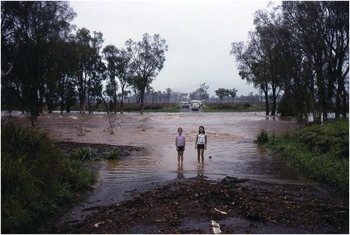
Semiarid tropics are notorious because of flash floods, normally happening during heavy rains at the beginning of the rainy season when raindrops hit partially bare and often surface-sealed soils (Fig. 1.10).
A flash flood developed rapidly west of Townsville, Australia, forcing the group I was with to sleep in our cars, reach a telephone in the morning (before cellphones), crossing the flood over railroad ties, and being picked up at the other end by CSIRO colleagues.

1.4.4 Arid Tropics
The tropical deserts, defined as those areas having two rainy months or less, cover about 11 percent of the tropics. Parts of the Sahara Desert and the Arabian Peninsula located geographically in the tropics, the Kalahari Desert, the Horn of Africa and the Australian Desert compose the greatest parts of this area. Narrow coastal deserts are found in Peru and Namibia because of cold currents from the south. Usually, only pastoralism is possible without irrigation. When irrigated, many of the loamy or clayey soils are extremely productive. High cotton yields are obtained in the Sudan Gezira, and very high rice and sugar cane yields in the coast of Peru. Three examples of this climate appear in Fig. 1.9.
1.5 Vegetation
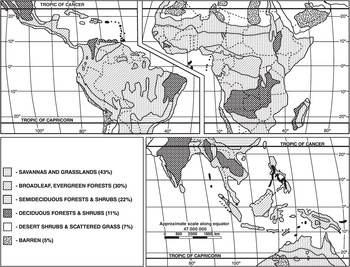
Natural vegetation in the tropics is closely related to climate. As mentioned earlier, the main classification systems of tropical climates presently in use are modifications of Köppen and Geiger’s (Reference Köppen and Geiger1936) employing vegetation names for the different climatic regions. Natural tropical vegetation can be grouped into the five general categories shown in Fig. 1.11: Savannas, which cover 43 percent of the area; moist tropical forests, which cover 30 percent; deciduous and thorn forests, which cover 22 percent; desert shrubs and scattered grasses, which cover 7 percent; and no vegetation, which is found in 5 percent of the tropics. A glance at Fig. 1.11 shows that most of the tropics are not covered by rainforests, as commonly conceived. Savannas are the most extensive type of tropical vegetation.
Geographical distribution of natural tropical vegetation.

Natural vegetation zones do not end abruptly; there is usually a transition, a melding and, in many instances, they form complex mosaics in the landscape (Scholes and Walker Reference Scholes and Walker1993).
1.5.1 Savannas
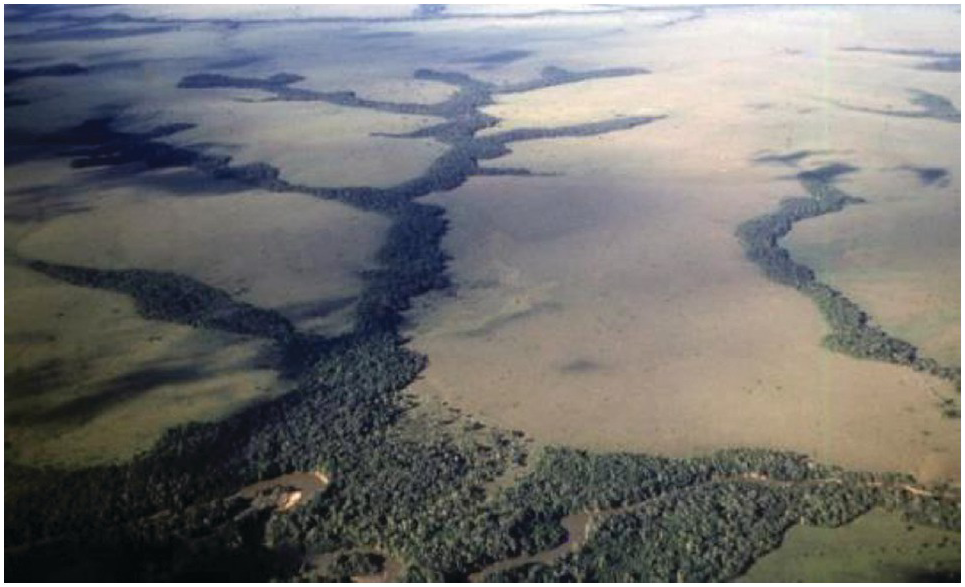
The term “savanna” probably originated in Central America, where the Caribs used it to refer to any area not covered by forests. Savannas are natural systems, occurring primarily in subhumid and semiarid tropical climates, defined by a nearly continuous grass canopy overlain by a tree canopy of varying density (Eyre Reference Eyre1963). The main soil moisture regime is typic tropustic. Savannas range from treeless grasslands to open forests with a grass understorey (Kellman and Tackaberry Reference Kellman and Tackaberry1997). Grasslands have few trees (campo limpo in the Cerrado of Brazil, the Altillanura in the Llanos of Colombia, the Maasai Mara in Kenya), and are often flanked by riparian forests in a dendritic pattern. Also, there are huge areas in the southern half of the Democratic Republic of Congo and surrounding countries that have the same dendritic pattern as the Colombian Altillanura (Fig. 1.12). I have only seen them from the air, crisscrossing southwestward from Nairobi to Luanda, and southeastward from Libreville to Lilongwe.
Grassland savanna and riparian forests along rivers forming a dendritic pattern in the Altillanura of the Llanos Orientales of Colombia.
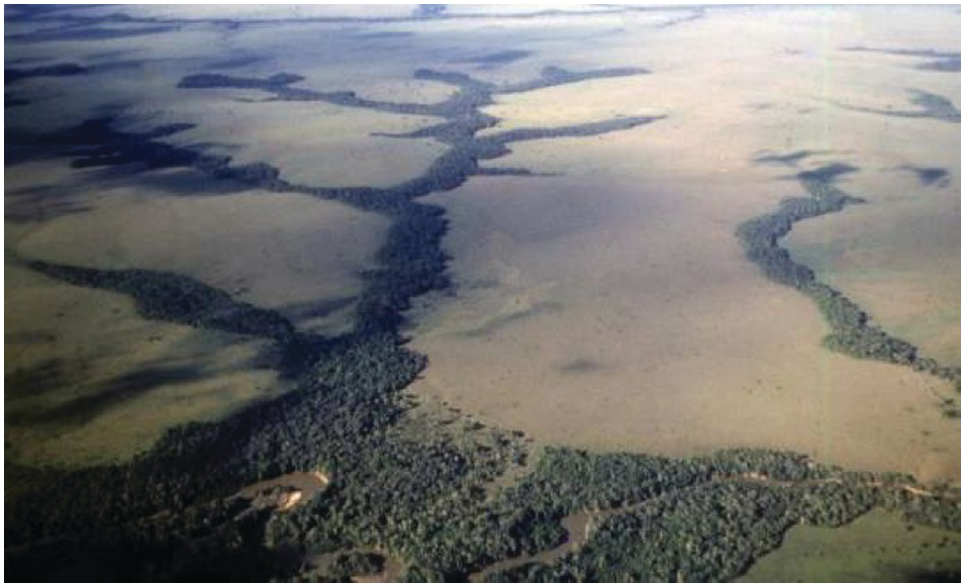
Savannas comprise approximately 28 percent of tropical America. The largest expanse is the Cerrado of Brazil, with over 200 million hectares, followed by the Llanos of Colombia and Venezuela, parts of Cuba, and the Pacific coast of Mexico and Central America.
About 57 percent of tropical Africa consists of savanna vegetation. This includes most of sub-Saharan Africa outside the humid tropics of the Congo Basin, and fringed by the Sahel in West Africa and semiarid areas in East and southern Africa. Savannas cover about 34 percent of tropical Asia and the Pacific, the largest one in northern Australia, with significant areas of anthropogenic savannas in Southeast Asia.
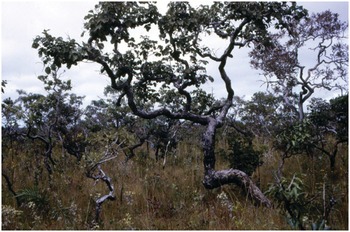
Natural savannas are mostly a fire climax, caused by lightning-rich thunderstorms at the end of the dry season. People cause additional fires, often intentionally. Savanna vegetation is well adapted to fires, because the basal meristems of the grasses are protected by sheaves of dead leaves, and many of the trees have the ability to sprout new growth from lateral meristems or cambium layers, often giving them a twisted, gnarled appearance (Fig. 1.13) due to multiple adventitious sprouting episodes (Kellman and Tackaberry Reference Kellman and Tackaberry1997). Fire suppression promotes the tree component.
The twisted appearance of trees in many savannas is due to fires killing meristems; then, ones surviving the fire produce new growth in different directions.

Many grasslands and savannas have been converted into improved pastures, particularly in tropical Latin America and Australia. Anthropogenic savannas occur as an end product of slash-and-burn agriculture in the humid tropics, even in the absence of a strong dry season. There are over 40 million hectares of such derived savannas in Southeast Asia, dominated by Imperata cylindrica (Garrity Reference Garrity1997). The unfortunate aspect of this widespread practice is that coarse, unpalatable grasses of the genus Imperata dominate the grasslands, rendering them practically worthless for grazing (see Chapter 18). There are also over 40 million hectares of pasture cleared from forest in the Amazon, many of which could be considered to be derived savannas (Serrão and Toledo Reference Serrão, Toledo and Anderson1990, Nepstad et al. Reference Nepstad, McGrath, Stickler, Alancar, Azevedo, Swette, Bezerra, DiGIano, Shimada, da Motta, Armijo, Castello, Brando, Hansen, McGrath-Horn, Carvalho and Hess2014).
The same protection that grasses have from fire helps them persist under grazing by ruminant animals. The largest concentration of wild ruminants and their carnivorous predators are in the East and southern African savannas. Extensive cattle grazing is the most widespread land use of the Latin American, African and Australian savannas. Termites and leaf-cutting ants excavate and deposit large quantities of soil on mounds several meters high in many savannas, adding microclimates and soil heterogeneity.
Although many ecologists believe that low soil fertility is part and parcel of the savanna environment, the evidence points otherwise. Savannas occur in fertile soils – mainly Vertisols and Alfisols in the Maasai Mara–Serengeti in Africa, the Guanacaste Peninsula of Costa Rica and the moist savanna belt in West Africa. Savannas most definitely also occur on acid, nutrient-poor Oxisols and Ultisols such as the Llanos and Cerrado of South America, and the Miombo in southern Africa.
The large concentration of wild mammals in Africa takes place mainly in savannas with non-acid soils, rich in calcium and phosphorus. In 1975, Sanchez and Buol proposed that the absence of such large animals in the acid savannas of South America is due to the deficiency of these two elements, and indeed cattle often break their bones (made of calcium phosphate) when grazing native savanna in these areas. Many studies now confirm this hypothesis (Kellman and Tackaberry Reference Kellman and Tackaberry1997).
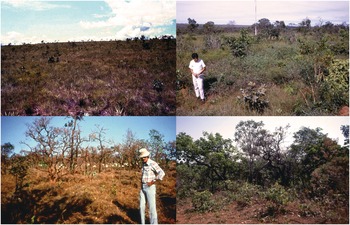
Small but significant changes in soil fertility parameters have been related to the different structural savanna types in the Cerrado of Brazil, which range from campo limpo (treeless savanna) to campo cerrado (trees spaced widely enough so one can drive a Jeep through), to cerrado proper, where the trees are closer, and to cerradão, with a denser and taller canopy of the same tree species (Fig. 1.14). Lopes and Cox (Reference Lopes and Cox1977) showed that subtle increases in topsoil pH, exchangeable calcium (Ca) (measured in centimoles of charge (cmolc) per kilogram of soil), available phosphorus (P), effective cation exchange capacity (ECEC) and decreases in aluminum (Al) saturation are related to these structural types, including a valley-bottom true forest (Table 1.8). The fact that clay content does not change is an indication that soils are physically similar. A possible explanation is increased nutrient cycling with the increasing tree component.
Types of cerrado savannas. Campo limpo (top left), campo cerrado (top right), cerrado (bottom left) and cerradão (bottom right).

| Topsoil property | Campo limpo (64) | Campo cerrado (148) | Cerrado (148) | Cerradão (45) | Forest (16) |
|---|---|---|---|---|---|
| pH (H2O) | 4.87a | 4.94ab | 5.00b | 5.14b | 5.28c |
| Exchangeable Ca2+ (cmolc/kg) | 0.20a | 0.33ab | 0.45b | 0.69c | 1.50d |
| ECEC (cmolc mol/kg) | 1.08a | 1.19a | 1.43b | 1.81c | 3.00d |
| Exchangeable Al3+ (cmolc /kg) | 0.74a | 0.63a | 0.66a | 0.61a | 0.78a |
| Aluminum saturation (%) | 66a | 58b | 54b | 44c | 40c |
| Available phosphorus (ppm) | 0.5a | 0.5a | 0.9b | 2.1b | 1.4c |
| Clay (%) | 33a | 36a | 34a | 32a | 37a |
In the African context, Scholes and Walker (Reference Scholes and Walker1993) explain that wherein savannas have short pulses of rapid growth following rainfall, the duration and frequency of these growth spurts is controlled by rainfall, while the growth rates are controlled by soil fertility levels.
Given the current importance of savannas from a biodiversity point of view as well as a source of pasture germplasm, the main types are described in more detail.
South American Savannas. Extreme soil acidity and infertility characterize the tropical South American savannas, comprising the Llanos of Colombia and Venezuela and the Cerrado of Brazil, all dominated by aluminum-toxic, naturally infertile Oxisols and Ultisols in subhumid climates with typic tropustic soil moisture regimes, isohyperthermic or isothermic soil temperature regimes and a 4–6-month-long dry season. Large areas of seasonally flooded savannas occur in the Llanos and the Pantanal of Brazil. Annual burning is a common practice in the native savannas. They cover about 300 million hectares (see Figs. 1.2, 1.13, 1.14).
Australian Savannas. Tropical Australian savannas occupy 270 million hectares but are quite different. The predominant soils are not acid, none of them are aluminum-toxic but they are often extremely deficient in phosphorus, sulfur and molybdenum. Some savannas also occur in semiarid climates. They all have isohyperthermic soil temperatures although frost does occur at latitudes of 17° S (Sanchez and Isbell Reference Sanchez, Isbell, Sanchez and Tergas1979).
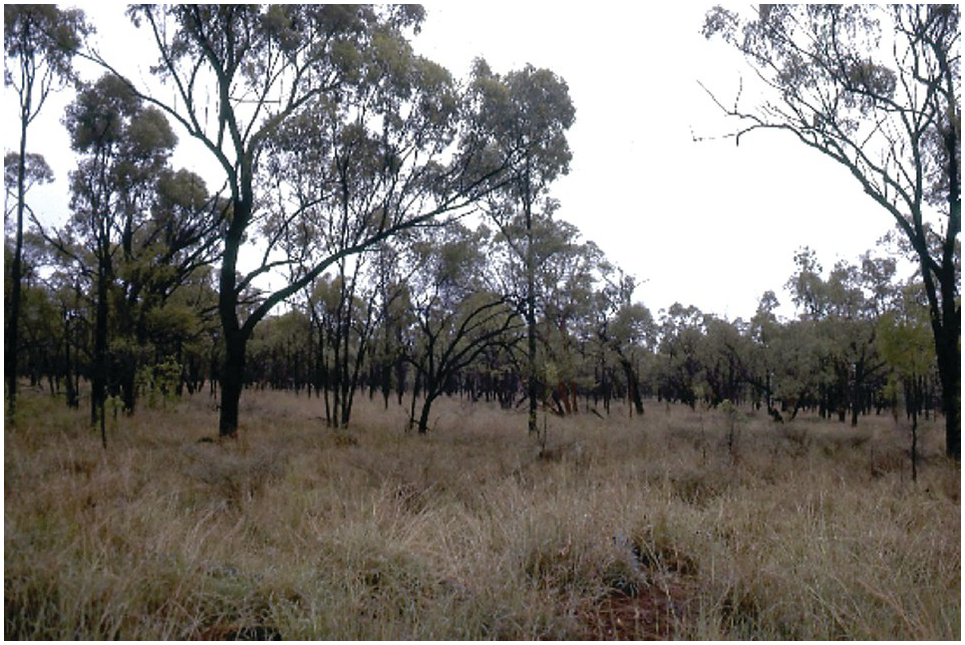
The subhumid zone comprises about 95 million hectares in a wide arc from the coast of the Northern Territories to the Cape York Peninsula, and extending south along parts of the Queensland coast. It consists of a continuous grass layer overlain by species of Eucalyptus and native Australian Acacia tree species (those with broad leaves) – see Fig. 1.15. Tothill et al. (Reference Tothill and Mott1985) assert these areas are the closest structural equivalents to the Cerrado, but the soils are totally different.

African Savannas. Savannas are the dominant vegetation of most of tropical Africa. Savannas encircle the Congo forest, but are readily divided into West and East/southern African savannas, mainly because of elevation – isohyperthermic in the West and isothermic in East/southern savannas. The main soils are low-fertility Alfisols of different texture and mineralogy, followed by sandy Entisols. Treeless savannas are usually on fertile Vertisols, with different species, just like in Australia. Wetlands (aquic soils) occupy valley bottoms, locally called fadamas, dambos or dimbas.
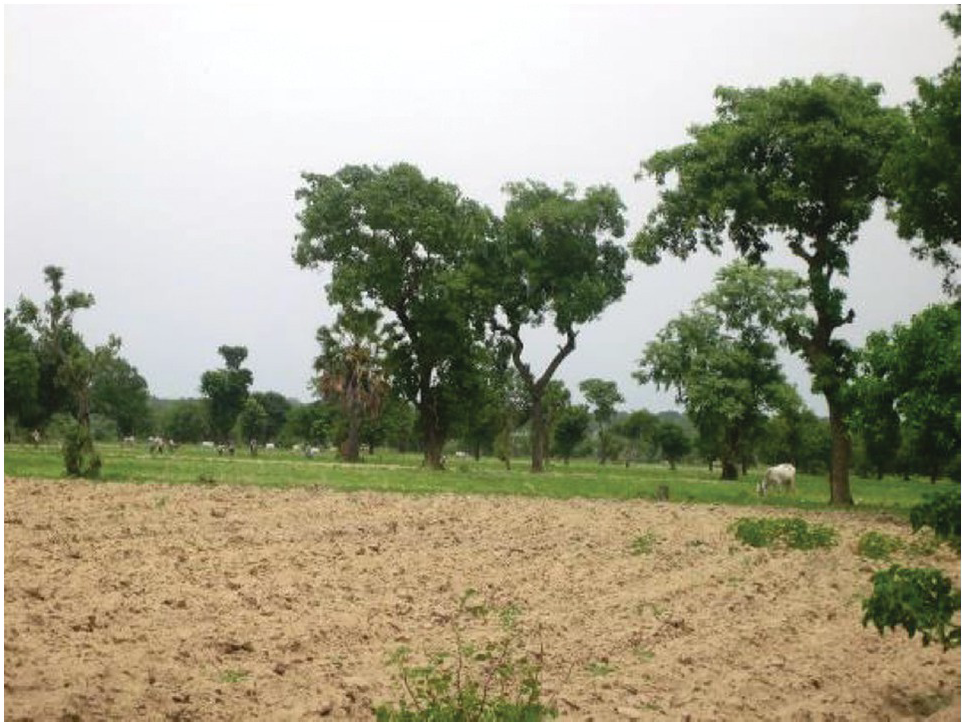
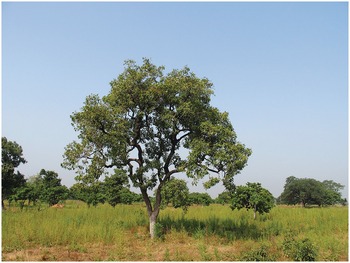
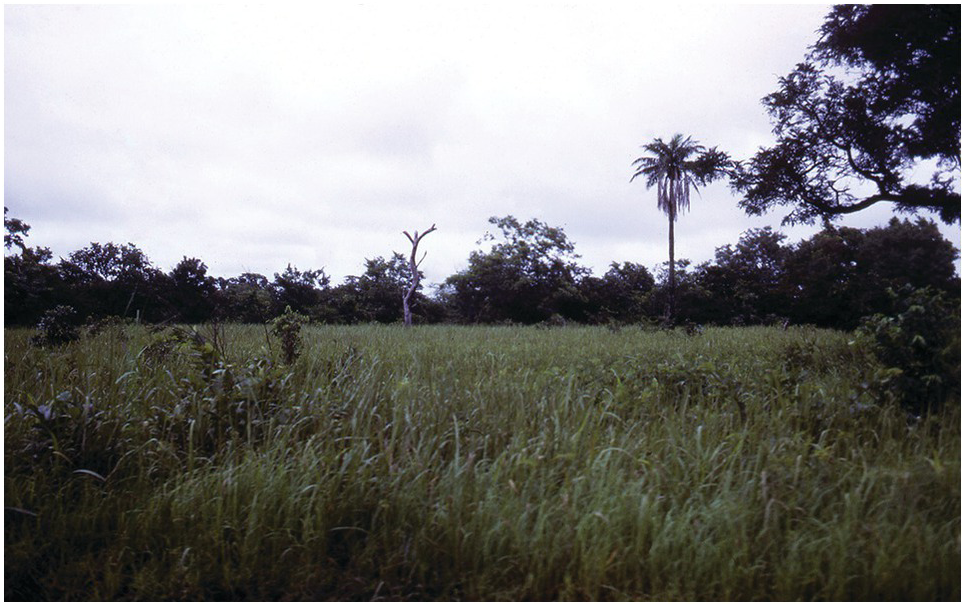
The West African savannas occupy specific rainfall gradients, increasing from north to south pretty much in parallel bands as the topography is flat and there are no major mountain ranges. All occur at low elevations and are therefore isohyperthermic. The main ecotypes, based on their annual rainfall ranges and soil moisture regime, are: the Northern Guinea savanna, 900–1200 mm, typic tropustic (Fig. 1.16), also known as Sudan savanna; the Moist or Southern Guinea savanna, 1200–1500 mm, typic tropustic with Hyparrhenia rufa as the dominant grass species (Fig. 1.17); and the derived savanna, with a similar rainfall range (Fig. 1.18). Panicum maximum (Guinea grass), an important pantropical grass species probably originated in derived savannas along the Gulf of Guinea.

Moist or Guinea savanna in Tamale, Ghana.

Derived savanna just north of Ibadan, Nigeria.
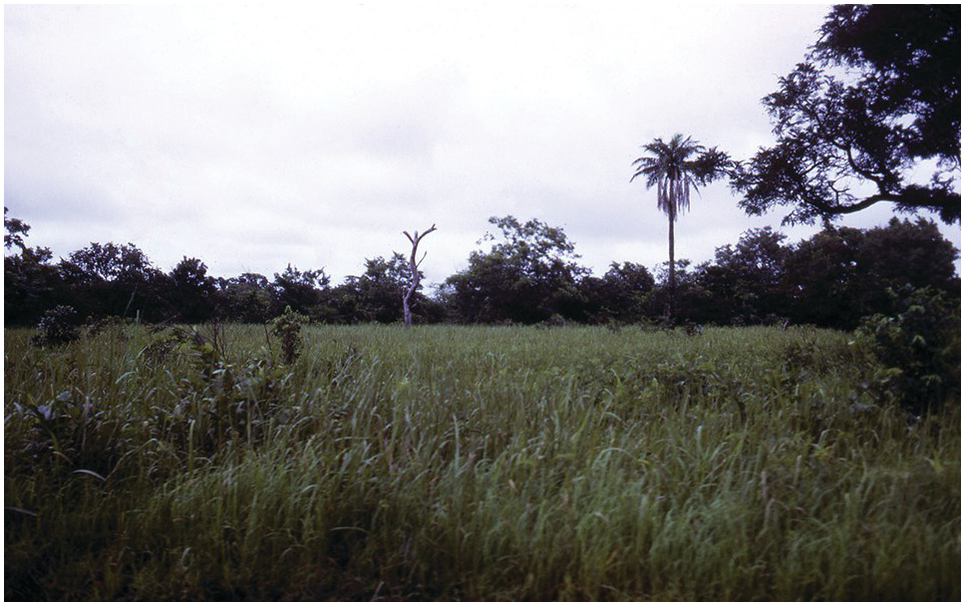
On the eastern side of Africa the savannas occupy a large upland plateau, averaging 1000 m of elevation and therefore with an isothermic temperature regime. This plateau ranges from Axum, Ethiopia to northern South Africa, extending to about 4° south of the tropic of Capricorn. Soil moisture regimes are typic tropustic. Hot, isohyperthermic aridic tropustic savannas occur east of the plateau in semiarid areas, and along the shores of Lake Malawi and parts of the Zambezi river shore in southern Africa.
While rainfall is the functional factor dividing the West African savannas, the East/southern African savannas are divided in terms of inherent soil fertility, the dystrophic (nutrient-poor) savannas and the eutrophic (nutrient-rich) savannas, convenient for soil scientists.
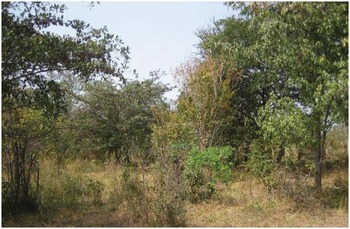
The nutrient-poor savannas (Fig. 1.19) are located mainly on sandy Alfisols and Inceptisols, acidic but not aluminum-toxic, with low levels of available phosphorus, potassium, calcium and magnesium, and granite commonly being the parent material. The tree vegetation is dominated by broad-leaved species of the genera Brachystegia and Julbernardia (generally known as “Miombo”). The trees are thornless, with leaves several centimeters wide, belonging mainly to the Caesalpinaceae and Combretaceae families (Scholes and Walker Reference Scholes and Walker1993).
Miombo savanna near Tabora, Tanzania. Broad-leaved trees are Brachystegia and Julbernardia and the main grass is Hyparrhenia rufa, known as Yaragua grass in Latin America.

The main grass species of the Miombo is Hyparrhenia rufa, now pantropical. Panicum maximum, an exotic, surprisingly grows well beneath the tree canopies, which are richer in organic carbon and nitrogen and microbial activity (Scholes and Walker Reference Scholes and Walker1993). These nutrient-poor savannas cover large areas of southern and western Tanzania, northern Mozambique, much of Zambia, the Kasai province of the Democratic Republic of Congo and much of Angola. Parts of the dystrophic savannas in northern Zambia strikingly resemble the Brazilian Cerrado, with similar latitude, topography, climate and acid Oxisols. In southern Africa, they are known as sour veldt.
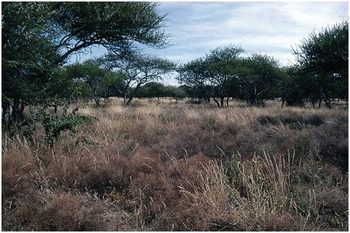
The nutrient-rich savannas are located mainly in lower-rainfall areas, and in areas cleared from forests in East Africa (Fig. 1.20). They are found primarily on soils derived from basalt, including medium-textured and clayey Alfisols, Oxisols, Inceptisols and, at lower topographic locations, Vertisols, and are usually treeless. The main trees are thorny and thin-leaved acacias. Nutrient-rich savannas are located in Kenya, northern Tanzania, the Zambesi river basin, central and southern Mozambique and non-desert areas of Botswana and Namibia. These trees are more nutritious to browsing animals than those in the nutrient-poor Miombo.

Dystrophic (acidic) and eutrophic (non-acidic) savannas often support different species. Grasses of the genera Andropogon, Paspalum, Trachypogon and Brachiaria tend to dominate the dystrophic miombo savannas, while more nutritive grasses of the genera Panicum, Cenchrus, Themeda, Chloris and Cynodon are more common in the eutrophic savannas. The tree component is also often different, broad-leaved trees versus thin-leaved African acacias.
Further information on tropical savannas can be obtained from Eyre (Reference Eyre1963), Bouliére and Hardy (Reference Bouliére and Hardy1970), Bouliére (Reference Bouliére1983), Huntley and Walker (Reference Huntley and Walker1982), Sarmiento (Reference Sarmiento1984), Cochrane et al. (Reference Cochrane, Sanchez, de Azevedo, Porras and Garver1985), Tothill and Mott (Reference Tothill and Mott1985), Goedert (Reference Goedert1986), Pieri (Reference Pieri1992), Scholes and Walker (Reference Scholes and Walker1993), Campbell (Reference Campbell1996), Kellman and Tackaberry (Reference Kellman and Tackaberry1997) and Osborne (Reference Osborne2000). In addition, there is a noteworthy long-term series of Cerrado symposia, dealing with the ecology and agronomy of tropical savannas (Ferri Reference Ferri1963, Correa Reference Correa1972, Marchetti and Machado Reference Marchetti and Machado1980, Embrapa 1988, Pereira and Nasser Reference Pereira and Nasser1996, Embrapa 1997, Sano and de Almeida Reference Sano and de Almeida1998).
1.5.2 Humid Tropical Forests
Humid (or moist) tropical forests occur in areas characterized by udic environments with high annual rainfall, covering about 30 percent of the tropics. The term includes rainforests (also known as lowland evergreen and equatorial forests), cloud forests near mountaintops, semi-evergreen forests and monsoon forests, at the wetter end of the typic tropustic soil moisture regime.
Humid tropical forests cover 52 percent of tropical America, primarily the Amazon Basin, as well as the Pacific coast of Colombia, the Atlantic coast of Brazil and parts of Central America. Only 12 percent of tropical Africa consists of rainforests, mainly in the lower Congo Basin and small areas of the West African coast, East Africa and eastern Madagascar. About 38 percent of tropical Asia and the Pacific consists of humid tropical forests, mainly in Indonesia, Malaysia and Papua New Guinea, and there is little of it in Australia.
The structure of humid tropical forests is similar throughout the tropics even though the dominant tree species differ (Fig. 1.21). They are characterized by a continuous, layered tree canopy with emergent individuals, a minority of deciduous trees, an understorey of shade-tolerant tree saplings, the absence of grasses and the presence of a forest litter layer. These forests have several structures adapted to the humid environment. Many leaves have “drip tips” that accelerate drying and reduce mold infestations. Lianas and strangler vines climb the trees and bind many together. Epiphytes develop in upper branches, catch leaves in their aerial roots, and produce a “soil” from which they draw nutrients.
Lowland humid tropical rainforest in Jambi Province, Indonesia.

But the most significant biological feature is their extreme species richness. They contain two-thirds of the estimated 250 000 of the world’s vascular plant species, 90 percent of the world’s insects and many bird species (Osborne Reference Osborne2000). About 2500 tree species are found in Malaysia and the Amazon, as compared with about 12 tree species in temperate forests. In many tropical forest areas, there are fewer than five marketable trees per hectare, making logging difficult.
Although tropical rainforests may appear impenetrable, they are easy to walk through with the aid of a machete because of the almost total absence of tangled vegetation at ground level. About 15 percent of the solar radiation reaches the soil surface. Air temperatures are substantially lower, but the humidity is higher than in surrounding cleared areas.
The nutrient cycle between the forest and the soil is essentially closed. Constant litter fall, decomposition throughout the year and the virtual absence of leaching permit the development of luxuriant forest with no nutrient deficiency symptoms in acid soils of low native fertility (more in Chapter 16). The only marked vegetation differences outside of wetlands and mountain tops that can be correlated with soils is the reduced size of rainforests growing on sandy Spodosols or Entisols, locally known as campinaremas in central Amazonia with similar occurrences in Southeast Asia.
Detailed studies of moist tropical forests and their use are abundant, particularly about issues of conservation versus development in the Amazon and Indonesia. Some noteworthy ones are Nye and Greenland (Reference Nye and Greenland1960), Richards (Reference Richards1966), Sombroek (Reference Sombroek1966), Odum (Reference Odum and Pigeon1972), Myers (Reference Myers1980), Moran (Reference Moran1981), Lanly (Reference Lanly1982), NRC (1982, 1993), Hecht et al. (Reference Hecht, Nores, Sanchez and Spain1982), Golley (Reference Golley1983), Nascimento and Homma (Reference Nascimento and Homma1984), Salati and Vose (Reference Salati and Vose1984), Cochrane et al. (Reference Cochrane, Sanchez, de Azevedo, Porras and Garver1985), Dickinson (Reference Dickinson1987), Vieira and dos Santos (Reference Vieira and dos Santos1987), Jordan (Reference Jordan1989), Anderson (Reference Anderson1990), Bruijnzeel (Reference Bruijnzeel1990), Dourojeanni (Reference Dourojeanni1990), Hecht and Cockburn (Reference Hecht and Cockburn1990), Gómez-Pompa et al. (Reference Gómez-Pompa, Whitemore and Hadley1991), Toledo (Reference Toledo1994), Clusener-Godt and Sachs (Reference Clusener-Godt and Sachs1995), Reading et al. (Reference Reading, Thompson and Millington1995), Kellman and Tackaberry (Reference Kellman and Tackaberry1997), Osborne (Reference Osborne2000) and Nepstad et al. (Reference Nepstad, McGrath, Stickler, Alancar, Azevedo, Swette, Bezerra, DiGIano, Shimada, da Motta, Armijo, Castello, Brando, Hansen, McGrath-Horn, Carvalho and Hess2014).
1.5.3 Semiarid Vegetation
This general term comprises the different types of vegetation located in the drier aridic tropustic soil moisture regime where the dry season is sufficiently strong to exclude forests and savannas. Scattered trees and shrubs are normally interspersed with a discontinuous grass canopy, which distinguishes them from the continuous grass canopy of savannas. Many semiarid areas are heavily populated. A striking one is the Sahel (desert fringe in Arabic), which lies just south of the Sahara and north of the Northern Guinea savanna in West Africa (Fig. 1.22). Large areas of semiarid tropical Africa are dotted with unique trees such as gigantic baobab (Adansonia digitata) and Faidherbia albida, with its unique reverse phenology (see Chapter 19). Other areas have a large proportion of succulents and cacti such as northeast Brazil and much of semiarid Mexico (Fig. 1.23). Crop production is largely limited to short growth duration, drought-tolerant species like sorghum, millet and cowpeas. Irrigated agriculture, where possible, is very high-yielding. Livestock grazing is often the dominant activity, with cattle and sheep in the wetter areas and goats and camels in the drier ones. Biodiversity is lower than tropical forests and savannas.
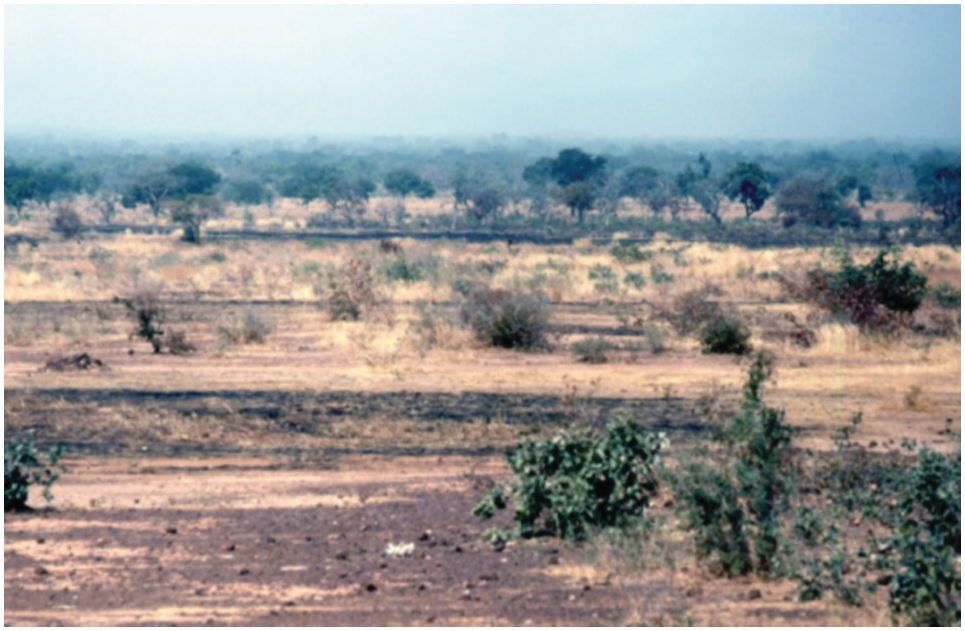
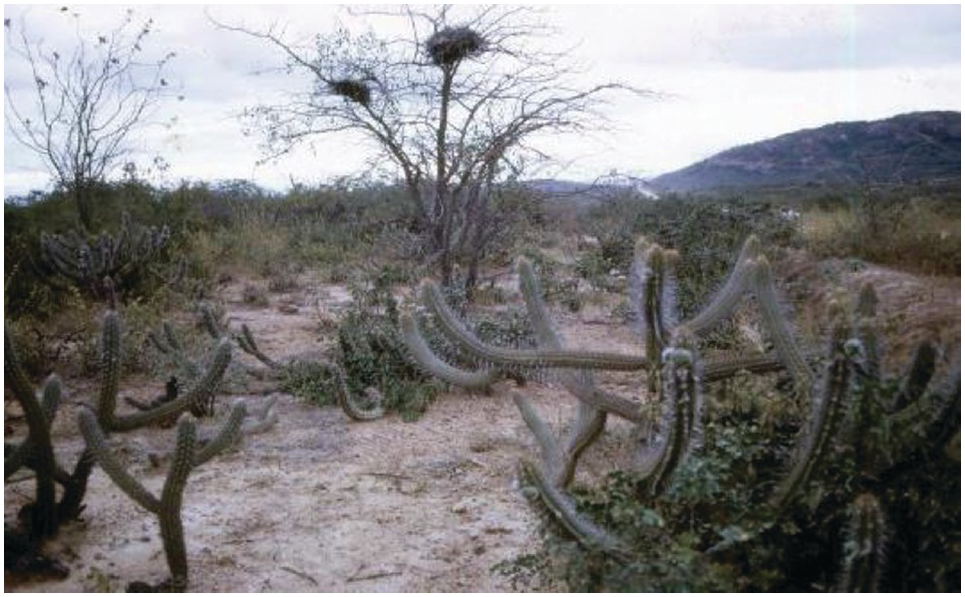
Knowledge about semiarid tropical ecology is less extensive than that of rainforests and savannas, although many works about savannas often include semiarid tropics. Important reference works are strongly related to agriculture. These include Russell and Greacen (Reference Russell and Greacen1977), Hall et al. (Reference Hall, Cannell and Lawton1979), ICRISAT (1989), Sivakumar et al. (Reference Sivakumar, Wallace, Renard and Giroux1991), Pieri (Reference Pieri1992), Vandenbelt (Reference Vandenbeldt1992), Bonkoungou et al. (Reference Bonkoungou, Ayuk and Zoungrana1993), Breman and Kessler (Reference Breman and Kessler1995) and Breman and Sissoko (Reference Breman and Sissoko1998).
1.5.4 Deserts
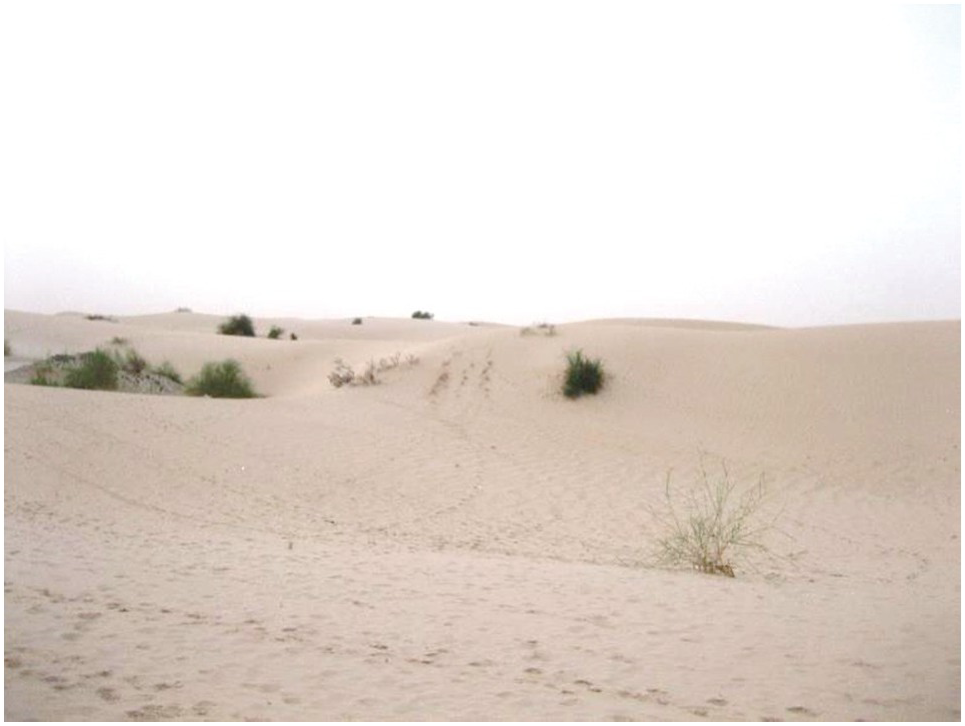
Tropical deserts by definition have little vegetation. But even the most absolute desert I have seen, north of Tomboctou, supports some trees in low spots (Fig. 1.24). Other deserts commonly have more vegetation, usually trees. “Gobi” deserts can be classified as those that have stony surfaces and no dunes, as compared to those dominated by sand dunes, such as in Fig. 1.24. Local wetlands (wadis) support their own unique ecology.
Southern end of the Sahara Desert just north of Tomboctou, Mali, with scattered trees.
1.5.5 Net Primary Productivity
The net primary productivity of various tropical vegetation types (measured in tons of dry mass/hectare per year)Footnote 1 is a good comparative parameter to characterize them. Golley and Leith (Reference Golley and Leith1972) developed a net primary productivity map of the world, which gives estimates of annual biomass increase plus litter production (Table 1.9). Tropical forests are more productive than temperate and boreal counterparts, and so are tropical savannas over temperate grasslands. But tropical rainforests are generally less productive than swamps and marshes and algal beds and coral reefs, the latter being perhaps the most threatened tropical ecosystem.
| Ecosystem | NPP mean | NPP range | Area (1000 hectares) | Total production (109 t/ha per year) |
|---|---|---|---|---|
| Tropical rainforest | 22 | 10–35 | 1700 | 37.4 |
| Tropical seasonal forest | 16 | 10–25 | 750 | 12.0 |
| Temperate forest | 13 | 6–25 | 1200 | 14.9 |
| Boreal forest | 8 | 4–20 | 1200 | 9.6 |
| Tropical savanna | 9 | 2–20 | 1500 | 13.5 |
| Temperate grassland | 6 | 2–15 | 900 | 5.4 |
| Cultivated land | 7 | 1–40 | 1400 | 9.1 |
| Swamps and marsh | 30 | 8–60 | 200 | 6.0 |
| Open ocean | 1 | 0.2–4 | 33 200 | 41.5 |
| Algal beds and coral reefs | 25 | 5–40 | 60 | 1.6 |
| Total terrestrial | 8 | 14 900 | 117.5 | |
| Total marine | 2 | 36 100 | 55.0 | |
| World total | 3 | 51 000 | 172.5 |
Cultivated lands (worldwide) have a very broad range in net primary productivity, their average reflecting the natural ecosystems they were derived from. On the basis of solar radiation and growing-season length, De Wit (Reference De Wit and Pietro1967) estimated the potential food crop yields by latitudinal belts. Calculations from his data indicate that tropical areas have approximately twice the crop production potential per hectare per year of temperate areas, assuming no additional limiting factors. De Wit calculated an average annual yield potential for the tropical latitudes of 60 tons of dry mass per hectare. Approximately half of that amount is considered the economic yield. Such yield levels have already been obtained or approximated in the tropics. Abruña et al. (Reference Abruña, Caro-Costas, Figarella, Pearson, Silva and Vicente-Chandler1964) have reported an annual production of 60 t/ha per year of dry forage in Puerto Rico. At the IRRI in the Philippines, 25.7 t/ha per year of rice grain (about 52 t/ha per year of dry matter) have been produced in one field with four crops during 1 year (Evans Reference Evans1997). These figures by far surpass annual production records of the temperate region. They underline the importance of year-round high solar radiation, allowing multiple crops per year, as a chief asset of tropical agriculture.
However, crops yields are generally lower in the tropics for crops that grow well in both tropical and temperate regions. Kellman and Tackaberry (Reference Kellman and Tackaberry1997) expected natural or agricultural systems in humid tropical environments to support three to four times the productivity of temperate regions on climatic basis alone, but they do not. Kellman and Tackaberry suggest this is due to two main limiting processes in the tropics: the complexity of biological interactions, and nutrient deficiency in the soils, to which I add the often-occurring lack of enabling government policies.
1.6 Physiography
About half of the tropics are in Africa, 35 percent in Latin America and 16 percent in Asia and the Pacific. Tropical lands are complex geologically and geomorphologically. Approximately 77 percent can be classified as “lowlands,” with elevations below 900 m; in 20 percent of the tropics, altitudes range from 900 to 1800 m; and they exceed 1800 m in about 3 percent of the tropics. These regions are the Andes of Central and South America, the East African Highlands, and parts of Southeast Asia. The Himalayas are located outside the tropics.
The 20 percent of the tropics located between 900 and 1800 m has one of the most pleasant climates on earth, with mild temperatures throughout the year. Persons in the temperate region seldom recognize this fact. A Kenyan, visiting England in July, used to amaze his British friends when he told them that he wanted to go back to Africa to get cool.
The following is a brief summary of the geology and geomorphology of the three tropical regions. The reader is referred to Thomas (Reference Thomas1974) for detailed information on tropical geomorphology, to Kellman and Tackaberry (Reference Kellman and Tackaberry1997) for an excellent description of past geologic history and tropical paleoecology and, finally, to two excellent soil atlases, Africa (Jones et al. Reference Jones, Breunig-Madsen, Brossard, Dampha, Deckers, Dewitte, Gallali, Hallert, Jones, Kilarsara, leRoux, MIcheli, Montanarella, Spaargaren, Thiombiano, van Ranst, Yemefack and Zougmoré2013) and Latin America (Gardi et al. Reference Gardi, Angelini, Barceló, Comerma, Gaistardo, Rojas, Jones, Krasilnikov, Mendonça, Montanarella, Muñiz, Schad, Vara-Rodriguez and Vargas2013).
1.6.1 Tropical America
The main surface features of tropical America are the Andean Cordillera and its continuation into Central America and Mexico; the Guyana and Brazilian shields; the Orinoco, Amazon and Paraná basins; and the Antilles Islands.
The Andes extend throughout the western edge of tropical America. They rose from the seas during the Tertiary epoch, a period of great volcanic activity, reversing the flow of the Amazon River, which at that time emptied in Guayaquil, Ecuador. There are active or recently active volcanoes in Mexico, throughout Central America, and in Colombia, Ecuador, Peru and Bolivia. Some extensive portions of the Andes, such as central Peru, however, have not been affected by recent volcanic activity. Although relatively narrow, the Andes have important and relatively flat intermountain valleys where human population density is high. Examples of these are the Mexico City Valley, the Guatemalan Altiplano, the Meseta Central of Costa Rica, the “Sabana” of Bogotá, the Cauca Valley of Colombia, the Mantaro and Cajamarca valleys in Peru and the Cochabamba Valley in Bolivia. High-altitude plateaus dominate southern Peru and northern Bolivia. Glaciers occur at the highest elevations, with the snow line at about 4800 m (probably higher now because of global warming).
The Guyana and Brazilian shields are much older land surfaces but with lower elevations. They originated during the Archean and Paleozoic eras and consist mainly of granite and gneiss, partially covered by sedimentary rocks, mainly sandstone. Large areas of the central plateau of Brazil have a gently undulating topography where two or three erosion surfaces can be seen. These shields are the oldest land surfaces in tropical America.
The Andes and the two shields delimit the Amazon Basin. The upper portion west of Manaus is quite wide; the basin narrows considerably, east of the city. Many of the present sediments originate from erosion of the Andean uplifts, but some are derived from the shield areas. The Orinoco Basin is separated from the Amazon by the Guyana highlands. Tertiary period deposits producing old soils with bands of recent alluvium cover both areas. The Paraná Basin to the south is rich in basalt deposits.
The Antilles are formed primarily from uplifted limestone or volcanic deposits. The present volcanic activity is limited to the Lesser Antilles.
1.6.2 Tropical Africa
Compared with other continents, Africa is geologically and topographically the most uniform. There are only two intensely folded areas, the Atlas Mountains in the north and the ranges of the Western Cape Province in the extreme south, both outside the tropics. The rest of the continent is largely one vast, rigid block of ancient rock, two-thirds of which is covered by sediments. The old crystalline rocks are mainly granite but also contain much metamorphic schist and gneiss. Because of the lack of folding and the continuous weathering, most of the continent appears as worn-down plateaus. These plateaus are at low elevations in West Africa, but in East and southern Africa they average 1000 meters, extending from Ethiopia to South Africa. Interspersed in the plateau are volcanoes in Cameroon, Central and East Africa, which have produced extensive basalt deposits. The Rift Valley splits the eastern part of the plateau from the Dead Sea in the north to the Zambezi River in the south. Parts are now occupied by the African Great Lakes (Turkana, Victoria, Tanganyika, Malawi and others).
The oldest rocks can be found in the east and west, parallel to the coast. This material dates from the Precambrian era. Some of these were folded before or during the Mesozoic period. The granites, gneisses and schists of the continental plateau are mostly of Archean age. During the Cambrian, Ordovician and Silurian periods, much of the continent was covered by sea, and some of the sandstones and dolomites in South Africa are considered to be from this period. After the elevation of the continent during the late Carboniferous times, during which Africa and India were united as Gondwanaland, the interior of Africa was occupied by large lakes, resulting in the formation of enormous layers of sandstone and marl. This is referred to as the “Karoo system” of South Africa, but the same situation is found in the Congo Basin and areas in East Africa. During the following Jurassic period, great volcanic activity caused the basalt flows of West Africa. It was during this time that Gondwanaland broke up and the continents drifted apart. Afterwards, seas covered certain areas again, such as the Sahara and the west coast. Continental sediments, on the other hand, are very extensive and range from Cambrian to Pleistocene age, accumulated in basins of the Middle Niger River, as well as in Chad, Congo, Sudan and the Kalahari Desert.
One unfortunate consequence of tropical African geomorphology is the lack of broad river basins in spite of the long rivers it contains. The narrow basins of the Nile, Niger, Congo and Zambezi prevent large-scale irrigation and thus the presence of large, irrigated valleys, such the breadbaskets of tropical Asia.
D’Hoore (Reference D’Hoore1956) provides an interesting comparison between the geology of tropical America and that of Africa. He points out that most of tropical Africa is a giant crystalline plateau, two-thirds of which is covered by sediments. Continental sediments filled in the big depressions or basins. In tropical America, however, the equivalent crystalline plateaus are limited to the Guyana and Brazilian shields. They are also partially covered by sediments of more recent origin, caused by the Andean uplift. Mountain uplifts and volcanic activity are less extensive in Africa than in America, however, important in East Africa for agriculture supporting dense human populations. The basaltic deposits in Paraná are contemporary to those in South Africa and the Deccan Plateau in India. In conclusion, D’Hoore considers the geologic history of tropical America to be more favorable than that of tropical Africa because the Andes provide a constant source of new materials. This situation is similar to that of the Indo-Gangetic plains in northern India, which receive the sediments from the Himalayas. However, as a whole, tropical America has a larger proportion of acid soils than tropical Africa. This is apparently due to the aeolian deposits from the Sahara, which affect a large part of tropical Africa.
1.6.3 Tropical Asia and the Pacific
The Indian subcontinent, which collided with the Asian mainland during the Eocene period, is a very old land mass and has not been under water since the Carboniferous period. The Deccan Plateau, with elevations lower than 1800 m, remains in the highest area of the subcontinent. During the Cretaceous period, volcanoes were very active and covered central India, with basalt producing fertile soils.
Mainland Southeast Asia is a combination of mountain ranges and large rice-growing valleys such as the Ganges, Brahmaputra, Irrawaddy, Chao Phraya and Mekong. These are the “rice bowls” of tropical Asia and are subject to periodic flooding. Most of the present volcanic activity is limited to the island regions, particularly Indonesia and the Philippines, as well as many Pacific islands, including Hawaii.
1.7 The Anthropocene
A relatively stable climate has characterized the time during which the great human inventions of agriculture and industrialization took place (Amundson et al. Reference Amundson, Berhe, Hopmans, Olson, Sztein and Sparks2015) – the Holocene epoch of the last 10 000–12 000 years. But this is now history. Rapid human population growth has caused changes at the planetary scale in atmospheric composition, climate, hydrology, widespread species extinctions, species invasions, changes in the local and global patterns of net primary production and the global biogeochemical cycles of carbon (C), nitrogen (N) and phosphorus (P) (Ellis Reference Ellis2015), as well as in land degradation, human migration and new kinds of conflicts. Paul Crutzen suggested that the world has entered a new geological epoch, the Anthropocene, where humans are the main drivers of biophysical change (Crutzen and Stroemer Reference Crutzen and Stroermer2000). Many of the natural systems (biomes) – shown in Fig. 1.11 – have been replaced by anthropogenic biomes, which Ellis calls “anthromes.” They are shown in Table 1.10 at Ellis’ highest categorical level. Some of these are called “novel” systems.
| Anthrome | Area (billion hectares) | Land cover (%) | Number of people (millions) | People (%) | Global tree cover (%) |
|---|---|---|---|---|---|
| Wildlands | 2.9 | 22 | 0 | 0 | 19 |
| Seminatural populated forests | 2.5 | 19 | 40 | <1 | 45 |
| Rangelands | 4.0 | 31 | 300 | 4 | 6 |
| Croplands | 2.7 | 21 | 900 | 14 | 25 |
| Villages | 0.8 | 6 | 2600 | 41 | 4 |
| Cities and towns | 0.2 | 1 | 2600 | 41 | 1 |
| Total | 13.1 | 100 | 6400 | 100 | 100 |
The evidence is staggering. About 78 percent of the Earth’s ice-free land surface has been modified by people. Only about one-fifth of the natural systems without humans remain at the beginning of the twenty-first century, largely in remote locations in the humid tropics, deserts, high mountains, the Arctic and Antarctica.
Seminatural populated forests now cover 19 percent of the land with less than 1 percent of the people, including much of the Amazon and rural eastern United States. These “novel” forests account for almost half of the world’s tree cover.
The rangelands, including savannas and semiarid areas, occupy 31 percent of the land surface with 300 million people, while the world’s croplands occupy an additional 21 percent of the land hosting 900 million people. Therefore, agricultural systems (cropland and rangeland) cover 52 percent of the land with 1.2 billion people. The fact that croplands hold 25 percent of the world’s tree cover indicates the importance of agroforestry, which will be discussed in Chapter 19.
Finally, the urban settlements, from villages to cities, cover 1 billion hectares or 7 percent of the land, hosting over 80 percent of the world’s population, denoting the importance of urbanization. We are facing a different world.
Ariel Lugo (Reference Lugo2015) observed that human activities are now accelerating the speed of evolution of organisms beyond the notion that “ecology governs evolution by tailoring organisms to fill niches.” He also observed that forests are now valued more for the ecosystem services they provide than for their wood production, and that novel forests as well as other anthromes need to be better understood, particularly with regard to the interactions between conservation and sustainable development.
Two critical issues that are part of the Anthropocene, biodiversity and climate change, are discussed below to provide background to the properties and management of soils in the tropics.
1.8 Biodiversity in the Tropics
Biodiversity – the genetic diversity of plants, animals and microorganisms, the genes they contain and the ecosystems they support – is now well recognized as a major global public good, because of its products and services. Biodiversity produces germplasm for agriculture, medicines, raw materials for industry and has the potential to produce many new products for humankind. Biodiversity also provides key ecosystem services like pollination, biological control of pests and diseases and increased ecosystem resilience. The higher the trophic level (level of nourishment) in a food web, the better the system can withstand shocks. Removing species at the top of the food chain often results in excessive populations at a lower level, which can in effect become pests. Having many species performing a similar service, nitrogen fixation for example, provides redundancy that can be crucial when one species is destroyed (Heywood Reference Heywood1995). Soil biodiversity is described in detail in Chapter 10.
About 80 percent of the world’s terrestrial species occur in the tropics (Reading et al. Reference Reading, Thompson and Millington1995). But the high biodiversity of the tropics is largely confined to the humid tropics. Lowland tropical rainforests are the world’s most species-rich terrestrial ecosystems, with 66 percent of the estimated 250 000 of the world’s plant species and 90 percent of the world’s insect species (Osborne Reference Osborne2000). The subhumid tropics probably come in as a distant second, with the East and southern African savannas having spectacularly large mammal and bird biodiversity, while others like the South American savannas are much less biodiverse.
The number of vascular plant species ranges from 30 000 to 90 000 in tropical forest regions of Africa, Asia and Latin America, while the subhumid Cerrado savanna of Brazil has less than 1000 vascular plant species (Kellman and Tackaberry Reference Kellman and Tackaberry1997). Other natural tropical ecosystems such as deserts, mangroves and semiarid ones, have much less biodiversity than tropical forests and savannas. According to Kellman and Tackaberry (Reference Kellman and Tackaberry1997), plant species richness (the number of species/unit area) increases with annual rainfall and decreasing latitude.
Why is biodiversity so high in the humid tropics? Kellman and Tackaberry speculate that tropical forests have endured because of large-scale and long-term processes; for instance, they have never undergone glaciations. Angiosperm plants started to diversify when tropical forests occupied a huge area as far north as the northern United States and Europe during the Tertiary period, which suffered few disruptions during the Quaternary as it shrank to the present area (during the Tertiary, New York and London were tropical forests). Coupled with the year-long growing conditions, this may be why tropical forests are the most diverse.
Tropical deforestation is the primary cause of global biodiversity loss (Heywood Reference Heywood1995). Tropical agriculture is the chief cause of the destruction of terrestrial habitats, which is pushing species toward extinction because the most threatened ecosystems are also home to large numbers of rural people, many of them desperately poor (McNeely and Scherr Reference McNeely and Scherr2001). Furthermore, most protected areas are in close contact with agricultural areas in tropical biodiversity hotspots, thereby enhancing their vulnerability (Wood et al. Reference Wood, Sebastian and Scherr2000). Biodiversity hotspots are those threatened areas with a large number of endemic species – those found nowhere else (Myers et al. Reference Myers, Mittermeier, Mittermeier, da Fonseca and Kents2000). Sixteen of the 25 biodiversity hotspots are in the tropics, precisely in areas with high rural poverty and malnutrition (McNeely and Scherr Reference McNeely and Scherr2001).
Protected areas alone are not sufficient to preserve biodiversity. Not only are the millions of deforested hectares important but also the spatial distribution of the forested/deforested margins. Fragmentation of natural forests threatens migrating species and predator species such as the Amazonian panthers that require large habitats to survive. New highways and logging roads add to forest fragmentation, effectively increasing the forest margins. It is now necessary to distinguish these fragmented forests that are extremely prone to deforestation from the “frontier forests,” those that are large, ecologically intact, relatively undisturbed and capable of supporting wide-ranging animal species (Bryant et al. Reference Bryant, Nielsen and Tangley1997). Bryant and colleagues estimate that only 37 percent of the tropical forests in the late 1990s qualify as frontier forests.
Land-use change from natural systems into agroecosystems, as well as the intensification of those agroecosystems, generally diminishes their biodiversity, commonly known as agrobiodiversity. This is particularly acute in the most intensively managed monocultures, which involve a narrow crop genetic base. Farm management practices often involve the excessive use of pesticides and other inputs, ending up with fewer niches in field boundaries and wildlife corridors that harbor diverse species, including beneficial insects.
Fortunately, this is not necessarily the norm in the tropics. When farming is done with a more agroecological approach – particularly with agroforestry, crop rotations and keeping the soil covered by some sort of vegetation throughout the year – it can minimize the loss of biodiversity (Pretty et al. Reference Pretty, Guijt, Scoones, Thompson and Holmberg1992, Sanchez Reference Sanchez1995, Altieri Reference Altieri2002). There are, however, few hard quantitative data on agrobiodiversity and its benefits in the tropics.
As mentioned before, biodiversity hotspots are often in the same place as poverty hotspots in the tropics (Barrett et al. Reference Barrett, Travis and Dasgupta2011), a set-up for lose–lose scenarios. When travelling though Tanzania’s southern corridor in 2010, I asked Dr. Gerson Nyadzi, who grew up in the region, why we saw no birds there. His answer: “we ate them all as kids because we were hungry.”
In their pilot analysis of agroecosystems Wood et al. (Reference Wood, Sebastian and Scherr2000) suggested tree cover in agricultural lands as an indicator of natural habitat quality. They report that a majority of agroecosystems have significant tree cover in sub-Saharan Africa, Latin America, and South and Southeast Asia, except in irrigated drylands and parts of semiarid South Asia. Wood and co-workers contrast this situation with that of North America, Europe, the former Soviet Union and East Asia where over half the agricultural extent has little or no tree cover, despite the high original extent of forests. The tropics, therefore, are not doing as badly as the temperate region in this respect, although this is no reason for complacency.
Wood et al. (Reference Wood, Sebastian and Scherr2000) also proposed two indicators of agrobiodiversity: species-level diversity and varietal diversity (within species). Others believe that functional biodiversity, that is, the number of organisms that perform a specific function (decomposition, for example) is more important than the number of species per se. In effect, “it is not who you are, but what you do.” There is controversy between the purist (structural) and this functional approach. From my viewpoint, the functional approach is more relevant and pragmatic, also for soil science (Chapter 10).
But the high biodiversity of the humid tropics has some negative effects on agriculture and people as well. Kellman and Tackaberry (Reference Kellman and Tackaberry1997) indicate that there is a much higher number of pest organisms attacking the same crop in the tropics than in the temperate regions where they also grow (Table 1.11). Also, they indicate that more abundant human pathogens and infectious diseases of the tropics are related both to high biodiversity and high vulnerability as a result of poverty and less research.
Diversity in agricultural systems (agrobiodiversity) as well as soil biodiversity will be discussed throughout the text.
1.9 Climate Change
Climate change is clearly with us in the early twenty-first century, pretty much ending decades of skepticism in view of the increasingly solid scientific evidence. It is also clear that the majority of changes are anthropogenic – caused by humans – beyond those caused by natural fluctuations (Hansen Reference Hansen2004). Given the overwhelming data, extreme events like “tropical” Hurricane Sandy devastating the coasts of temperate New York and New Jersey in the United States and extreme heat waves in France have made the skeptics think twice.
Global warming is the direct outcome of trapping infrared radiation in our atmosphere by trace concentrations of heat-trapping gases. Higher air temperature is the “greenhouse effect,” triggered by increasing trace concentrations of carbon dioxide (CO2), methane (CH4), nitrous oxide (N2O) and other gases that trap outgoing radiation in the atmosphere. Carbon dioxide, the main greenhouse gas, is released by respiration of plants, animals and aerobic microorganisms, and the mineralization of soil organic carbon, as well as the burning of tropical forests (Chapters 11, 16). Methane is principally produced by the anaerobic decomposition of carbon under flooded soil conditions and by enteric fermentation by ruminants (Chapters 17, 18). Oxides of nitrogen (mainly N2O, but also nitric oxide [NO]) are emitted from soils and manures, as intermediate products of both nitrification and denitrification (Chapter 13). The global warming potential of CH4 is 20 times more than that of CO2; N2O is 298 times more. Calculated together they are referred to as CO2-equivalents (CO2-eq). These gases are mixed in the atmosphere, regardless of where they originated from.
Estimations from Antarctic ice cores and direct measurements at Mauna Loa, Hawaii indicate a level of 280 ppm CO2 in pre-industrial times (about 1750), which slowly rose to about 330 ppm in the 1950s, 200 years later. Concentrations then started to rise sharply, reaching 400 ppm CO2 in January 2015 and 405 ppm CO2 in March 2016 (Pro Oxygen 2016).
The world mean annual temperature near the Earth’s surface had increased by 0.8 °C at the end of the twentieth century, relative to pre-industrial times. Temperatures are now increasing by an average of 0.2 °C per decade (Hansen et al. Reference Hansen, Sato, Ruedy, Lo, Lea and Medina-Elizade2006) so, by about the end of 2010, the world mean annual temperature had increased by 1 °C. Projections for the remainder of the twenty-first century vary between a 2 °C and 5 °C increase over pre-industrial levels. Sea level rose by 6–9 m when the Earth was less than 1 °C warmer than today, 120 000 years ago (Hansen et al. Reference Hansen, Sato, Hearty, Ruedy, Kelley, Masson-Delmotte, Russell, Tselioudis, Cao, Rignot, Velicogna, Tormey, Donovan, Kandiano, von Schuckmann, Kharecha, Legrande, Bauer and Lo2016), so we are in trouble. The decrease of the snow and glaciers in tropical Mount Kilimanjaro, 5895 m high and 3° south of the equator (Fig. 1.25), is painful evidence for people in the tropics (Thompson et al. Reference Thompson, Brecher, Mosley-Thompson, Hardy and Mark2009, Thompson Reference Thompson2010).
The decrease of snowcap and glaciers in Mount Kilimanjaro, Tanzania.

The United Nations Paris Agreement of December 2015 represents the first substantial accord among countries since climate negotiations began. It calls to limit further global temperature increase to “well below 2 °C” over pre-industrial levels and to make “efforts” to limit it to 1.5 °C. There is some confusion about this 2 °C target – is it 2 °C above what we have now or above pre-industrial levels? The text of the Paris agreement says “above pre-industrial levels” (UNFCCC 2015). That means the plan is to limit additional temperature increases to 1 °C. The text also asks for “efforts” to limit the increase to 1.5 °C; that really means only an additional 0.5 °C – extremely difficult. The 2 °C increase of global warming will occur when the atmospheric CO2 level reaches 450 ppm – not far from the 405 ppm level at the time of this writing. The United Nations declarations are not known for their accuracy, but in this case ambiguity is not going to help. The Paris agreement also calls to achieve net-zero emissions – a balance between sources and sinks – in the second half of this century. These are magnificent targets but they would require extraordinary efforts in climate mitigation. Without such interventions, CO2 levels will rise to 550–700 ppm CO2-eq by 2050, increasing world temperatures anywhere from 3 to 5 °C, a catastrophic scenario (Stern Reference Stern2007).
Climate-change research is broadly divided into three categories: impacts, adaptation and mitigation. Impacts are the consequences of predicted climate change on humans and ecosystems. Adaptation is the ability of people and ecosystems to cope, usually described in terms of vulnerability. Mitigation includes the actions people can take to decrease global warming. Avoided deforestation is considered mitigation.
The following subsections detail the results of innumerable references relevant to the tropics. Only the most important of these will be referred to. Many more may be found in the Intergovernmental Panel on Climate Change (IPCC) Fifth Assessment Report (Stocker et al. Reference Stocker, Qin, Plattner, Tignor, Allen, Boschung, Nauels, Xia, Bex and Midgley2014) as well as in the previous assessment reports. Our current knowledge will be obsolete as the new assessment reports are published.
1.9.1 Impacts
Climate change has played a major role in the tropics in the past, and will keep presenting us with major challenges in the next decades. Land use, mostly tropical, is the second most important source of greenhouse gas emissions after fossil fuels, emitting 4.1 Pg CO2-eq per year, while fossil fuels and cement plants emit the lion’s share, 28.1 Pg CO2-eq per year (86 percent of the total) (Chapter 11).Footnote 2 Most of the research on impacts is based on climate models, many of which have been criticized. They are getting better but much remains to be done to link climate models to more complex agricultural systems (Campbell et al. Reference Campbell, Vermullen, Aggarwal, Corner-Dolloff, Girvetz, Loboguerrero, Ramírez-Villegas, Rosenstock, Sebastian, Thornton and Wollenberg2016) such as those described in Chapters 16–19. These models are the best we have to work with and, like the FAO data on which we base much of our agricultural and soils data, they are far from perfect, but thank goodness they exist.
The main impacts in the tropics are: increasing air temperatures, particularly night temperatures; increasing rainfall variability; increasing frequency of extreme weather events (droughts, floods, hurricanes); more freshwater shortages; sea-level rise affecting low-lying coastal cities, where much of the population is concentrated; bleaching of coral reefs, giving rise to unsustainable fishing; and several others. Higher CO2 concentrations may result in a positive carbon fertilization effect on natural and agricultural systems, provided they are not limited by nutrients. Furthermore, tropical glaciers are thinning and a northward geographic spread of malaria and other tropical diseases is taking place as well as increased crop pest and disease pressure where wetter climates are beginning to happen. Climate change affects all the dimensions of agriculture – crops, livestock, forestry, fisheries and land resources. Most of these impacts are already measurable (Campbell et al. Reference Campbell, Vermullen, Aggarwal, Corner-Dolloff, Girvetz, Loboguerrero, Ramírez-Villegas, Rosenstock, Sebastian, Thornton and Wollenberg2016).
Developing countries are more adversely affected by climate change than industrialized economies. The IPCC projects annual reductions of gross domestic product (GDP) of 2–9 percent in developing countries versus 1–2 percent for industrialized countries due to climate change (Houghton et al. Reference Houghton, Meira Filhod, Callander, Harris, Kattenberg and Maskell1996). The economic costs, “if we don’t act would be equivalent of losing 5% of the global GDP each year, now and forever while the costs of avoiding the worst impacts can be about 1% of the global GDP each year” (Stern Reference Stern2007).
One consistently overly pessimistic impact present in all IPCC assessment reports is the predicted decreases in crop yield in the tropics to catastrophic levels of 30 percent or more in the next decades, particularly in tropical Africa, as the region to be most affected. These reports fail to take account of the positive impact of agricultural research and farmer innovation in their predictions. Now that crop yields are beginning to increase in Africa (Sanchez Reference Sanchez2015), and have done so in Asia and Latin America for decades, I hope the next assessment reports will be more balanced.
1.9.2 Adaptation to Climate Change
The negative consequences of climate change will be borne more by the vulnerable and they are located mainly in the tropics. This is understandable because of the lower resilience of tropical societies – nothing biophysical. Research also has a huge new role to play in adapting to the inevitable. Some examples are given below. Many options will be discussed in the chapters of this book.
Genetic manipulation offers several approaches, including breeding for resistance to higher day or night temperatures, gene transfers from crops that tolerate higher temperatures, decreasing night respiration by manipulating stomata-closing, to name a few. Increased grain sterility due to thermal damage could be avoided by finding genes that make crops flower early in the morning. Can this trait be combined with high yields, tolerance to pests and diseases, and high grain quality? I hope so. Another approach is to decrease peak temperatures by manipulating microclimate, as done when sorghum and millet are grown under Faidherbia albida trees (Chapter 19).
Moving late-maturing cultivars that have proved useful in other climates is another option. They may have longer vegetative and grain filling growth phases at the new warmer location than the current ones being grown there, permitting more dry-matter accumulation.
Increasing nitrogen fertilizer application, believe it or not, is a way to adapt to rainfall extremes. Figure 1.26 shows simulated maize yields in Masvingo, Zimbabwe (596 mm annual rainfall), a semiarid area marginal for maize. Without nitrogen applications, the yields varied over the 47-year period from zero (crop failures during El Niño years), to a maximum of 1.6 t/ha in the best years, giving an overall mean of 0.8 t/ha; about the same as the current average maize yield in tropical Africa at the beginning of this century. With the recommended rate 52 kg N/ha per crop the average yields tripled, but increasing nitrogen fertilization did not prevent crop failures during the three drought years. Farmers actually preferred a smaller rate (17 kg N/ha), which, over the long run, about doubled maize yields and gave them a higher economic return from the fertilizer investment (Cooper et al. Reference Cooper, Dimes, Rao, Shapiro, Shiferaw and Twomlow2008). Regardless of the rate, N fertilization helped Masvingo farmers adapt to the varying seasonal rainfall, but did not help during the three major drought events encountered in this 47-year period. Better forecasts, a few seasons ahead, can help to refine practices such as nitrogen usage.
Simulated maize yields using rainfall data from 47 years in Masvingo, Zimbabwe, using APSIM modeling for three nitrogen application rates, 0 (blue line), 17 (red line) and 52 (green line) kg N/ha; Y axis is grain yield (kg/ha).

1.9.3 Mitigating Climate Change
The main mitigation strategies are reducing greenhouse gas emissions to the atmosphere, sequestering carbon in soils and plants (Smith et al. Reference Smith, Martino, Cai, Gwary, Janzen, Kumar, McCarl, Ogle, O’Mara, Rice, Scholes, Sirotenko, Howden, McAllister, Pan, Romanenkov, Schneider, Towprayoon, Wattenbach and Smith2008) and avoiding further carbon emissions by deforestation. Smith et al., after a comprehensive review of the existing knowledge, estimate that the global technical mitigation potential from agriculture would be 5.5–6.0 Pg CO2-eq/year by 2030. This is higher than the most recent estimation of carbon fluxes from land use and land-use change (largely tropical) of 4.1 Pg CO2-eq per year (Chapter 11), showing enormous potential. But this has to be tempered by social and policy realities and somewhat optimistic scientific projections. Nevertheless, of the total mitigation potential, approximately 89 percent is from reduced soil emissions of CO2, 9 percent from mitigation of CH4 from wetland soils, livestock and manures, and 2 percent from mitigation of N2O emissions, mostly from soils (Smith et al. Reference Smith, Martino, Cai, Gwary, Janzen, Kumar, McCarl, Ogle, O’Mara, Rice, Scholes, Sirotenko, Howden, McAllister, Pan, Romanenkov, Schneider, Towprayoon, Wattenbach and Smith2008).
The main mitigation options outlined by Smith et al. (Reference Smith, Martino, Cai, Gwary, Janzen, Kumar, McCarl, Ogle, O’Mara, Rice, Scholes, Sirotenko, Howden, McAllister, Pan, Romanenkov, Schneider, Towprayoon, Wattenbach and Smith2008) are improved cropland and grazing-land management; restoration of degraded lands; avoiding drainage of cultivated organic soils; and, to a lesser extent, rice management, agroforestry, livestock management and manure management. Most of these are discussed in different chapters of this book.
1.9.4 An Unwitting Case of Mitigation
There is one case of mitigation that has not received much attention in the climate-change literature: the avoided deforestation by the Asian Green Revolution of the 1960s to 1990s.
Although the agronomic and socioeconomic consequences of the Green Revolution have been amply researched (Chapter 2), the question arose as to its effects on the drivers of climate change. A study by the Consultative Group for International Agricultural Research (CGIAR) Intercenter Working Group on Climate Change (Grace et al. Reference Grace, Sanchez, Ingram, Palm, Wassmann, Fisher, Thomas, Chandler, Bowen, Reid, Wopereis and Waddington2000) estimated the differences in land-use change and land-use intensification on greenhouse gas emissions between the actual Green Revolution and a hypothetical extensification (no Green Revolution) scenario in developing countries for the period 1965–1995. This included both tropical and non-tropical developing countries. The extensification scenario was based on the assumption that 1995 cereal yields and fertilizer use per hectare remained at 1965 levels, but with cereal production at actual 1995 levels.
With the Green Revolution, the total cropping area in developing countries increased by 82 million hectares from 1965 to 1995 (Table 1.12). This increase is close to the 85 million hectares increase for the tropics indicated in Table 2.12, so we can assume that most of the land-use change took place in the tropical developing countries.
| Cropland | Area (million hectares) |
|---|---|
| Actual area 1965 | 384 |
| Actual area 1995 (with the Green Revolution) | 466 |
| Estimated area 1995 without Green Revolution | 892 |
| Area saved by the Green Revolution 1965–1995 | 426 |
Without the Green Revolution, an additional 426 million hectares would have been required to meet the 1995 levels of crop production, assuming similar land quality. This almost doubling of cropland in developing countries would have come primarily from the conversion of natural systems, primarily tropical forests and subhumid savannas.
The assumption that higher yields automatically discourages further deforestation has been subjected to scrutiny by Angelsen and Kaimowitz (Reference Angelsen and Kaimowitz2001). But they concluded that improved agricultural technologies do actually benefit forest cover when they lead to major declines in agricultural prices and/or are more labor intensive. Angelsen and Kaimowitz cited the Green Revolution as one such example. This also indicates that technologies that do not require much labor, such as cattle ranching or mechanized soybean production in the Amazon, actually encourage deforestation. As will be shown in Chapter 16, this effect can be stopped and even reversed when farmers recognize the ecological losses due to deforestation, leading to the establishment of new policies that result in higher food yields while decreasing deforestation.
The Green Revolution in effect decreased greenhouse gas emissions due to deforestation to one-third of what they would have been in its absence, saving 2.1 Pg of CO2-eq per year (Table 1.13).
| Land-use change (mainly deforestation) | Emissions (million tons CO2-eq per year) | |
|---|---|---|
| With the Green Revolution | Without the Green Revolution | |
| CO2 from soil | 422 | 2146 |
| CO2 from vegetation | 326 | 558 |
| CH4 from vegetation | 26 | 48 |
| N2O from vegetation | 4 | 4 |
| Total from land-use change | 777 | 2886 |
| Saved from land-use change | 2109 | |
The overall effect of the Green Revolution due to land-use intensification is nearly a zero-sum game (Table 1.14). The additional emissions due to nitrogen fertilizer use (N2O emissions and the CO2 cost of manufacture) were practically offset by savings in CH4 emissions from wetland rice cultivation. Since no change in total cereal production by 1995 was assumed, emissions due to burning crop residues in situ, biological nitrogen fixation, and crop residue decomposition were assumed to be the same in the two scenarios.
| Land-use intensification | Emissions (million tons CO2-eq per year) | |
|---|---|---|
| With the Green Revolution | Without the Green Revolution | |
| Rice cultivation: CH4 | 459 | 648 |
| Nitrogen fertilizer application: N2O | 169 | 56 |
| Nitrogen fertilizer production: CO2 | 100 | 33 |
| Residue decomposition: N2O | 59 | 4 |
| Burning crop residues: CH4 + N2O | 41 | 41 |
| Biological nitrogen fixation: N2O | 15 | 15 |
| Total from land-use intensification | 836 | 841 |
| Saved from land-use intensification | 15 | |
Overall, the Green Revolution has averted emissions equivalent to 2124 Pg CO2-eq per year from 1965 to 1995. The bulk of this saving is in carbon from the avoidance of land conversion. If the Green Revolution had not taken place, the CO2 concentration of the atmosphere would have increased from 361 to 369 ppm in 1995. As it is, atmospheric concentrations reached 369 ppm CO2 in the year 2000, thus the Green Revolution delayed the atmospheric build-up of CO2 by 5 years, a major contribution to mitigating global warming.
The scientific community knows well enough about the negative impacts of climate change. Emphasis should shift more toward implementing solutions to food security (Campbell et al. Reference Campbell, Vermullen, Aggarwal, Corner-Dolloff, Girvetz, Loboguerrero, Ramírez-Villegas, Rosenstock, Sebastian, Thornton and Wollenberg2016).
1.10 Summary and Conclusions
The tropics is that part of the Earth between 23.5° north and south of the equator. Because the tilt of the Earth’s axis has the same angle, these latitudes are the limit of the Sun’s apparent migration to the north or south of the zenith. As latitudes increase, the Sun’s rays have to pass through a thicker atmosphere.
Consequently, the tropics are the only part of the world where the Sun passes directly overhead, receiving twice the annual solar radiation of the temperate region. Variation within the tropics is related to cloudiness, especially during rainy seasons, but also the presence of suspended soil particles during the Harmattan season in West Africa.
The tropics can be defined as that part of the world where the mean monthly near-surface air temperature variation is 6 °C or less between the average of the three warmest and the three coldest months. The only unifying property of tropical climates is their relatively uniform temperature throughout a given year.
Soil temperatures in the tropics, as defined in the Soil Taxonomy system, fall in the “iso” temperature regimes that is, “less than 6 °C difference between the average soil temperature of June, July and August and the average soil temperature of December, January and February at 50 cm depth.”
Soil temperatures can be estimated from air temperature records by adding 2 °C to mean annual air temperatures in the lowland tropics. The isohyperthermic soil temperature regime has > 20 °C mean annual temperatures and occurs in the lowlands; the isothermic (13–20 °C), in the tropical highlands; the isomesic (6–13 °C), in highlands above 2000 m; and the isofrigid temperature regime (< 6 °C), in the high plateaus and mountain tops above the snow line.
Rainfall distribution is the principal parameter used to differentiate tropical climates for agricultural purposes. Approximately half of the tropics has pronounced wet and dry seasons (typic tropustic soil moisture regime), one-fourth has high rainfall distributed throughout the year (udic soil moisture regime), and one-fourth has semiarid or desert climates (aridic tropustic and aridic soil moisture regimes).
Intertropical Convergence Zone and El Niño
The Intertropical Convergence Zone is a low-pressure trough that determines the march of the rainy seasons within the tropics. The periods of heaviest rainfall occur when the Sun is directly overhead. The Intertropical Convergence Zone is not a continuous band of clouds, but clusters of clouds, as we see in television weather reports.
The wet and dry seasons exert on plant growth an influence similar to that of the winter and summer seasons in the temperate region. Much plant growth and animal production stops during intense dry seasons in ustic soil moisture regimes. The beginning of the rains produces an outburst of activity not unlike the arrival of spring in the temperate region.
El Niño Southern Oscillation is an irregular low-frequency oscillation between a warm (El Niño) and a cold stage (La Niña) in the tropical Pacific Ocean. At about 6° south, during the months of January to May, the easterly trade winds move the cold waters of the Humboldt Current westwards, gradually warming sea surfaces across the equatorial Pacific Ocean, creating low atmospheric pressures and high rainfall as it reaches equatorial Southeast Asia. The western equatorial Pacific Ocean around Indonesia becomes 30 cm higher than the eastern Pacific.
When the trade winds weaken this mountain of water collapses and spreads east, bringing warmer sea surface temperatures and rains to Peru’s coastal desert during Christmas. The effects are felt all over the world, to the point that climatologists consider that the tropics rule the world climate.
Tropical Vegetation
Natural vegetation in the tropics is closely related to climate. Savannas cover 43 percent of the tropics; tropical rain forests, 30 percent; deciduous and thorn forests, 22 percent; desert shrubs, 7 percent; and no vegetation, 5 percent of the tropics. Therefore, most of the tropics are not covered by rainforests, as frequently believed. Savannas are often related to soil fertility, particularly in South America and East/southern Africa.
Tropical forests are more productive than temperate and boreal forests in terms of net primary productivity, and so are tropical savannas over temperate grasslands.
Land surfaces in the tropics range from the oldest on Earth (ancient crystalline rocks in South America and Africa) to the most recent volcanic deposits.
The Anthropocene
There has been a relatively stable climate during the last 10 000–12 000 years, during which time the human inventions of agriculture and industrialization have taken place. But this is now history. Rapid human population growth has produced many changes, at the planetary scale, in atmospheric composition, climate, hydrology, geomorphology, widespread species extinctions, species invasions, changes in the local and global patterns of net primary productivity, global biogeochemical cycles of carbon, nitrogen and phosphorus, as well as in land degradation, human migrations and new kinds of conflicts. Paul Crutzen suggested that the world has entered a new geological epoch, the Anthropocene, where humans are the main drivers of biophysical change.
About 78 percent of the Earth’s ice-free land surface has been modified by people. Only about one-fifth of the natural systems remain untouched by humans at the beginning of the twenty-first century, largely at remote locations of the humid tropics, deserts, high mountains, the Arctic and Antarctica.
Seminatural populated forests now cover 19 percent of the land with less than 1 percent of the people. These “novel” forests account for almost half of the world’s tree cover.
Agricultural systems cover 52 percent of the land with 1.2 billion people. The fact that croplands hold 25 percent of the world’s tree cover indicates the importance of agroforestry.
Urban settlements from villages to cities cover 1 billion hectares or 7 percent of the land, hosting over 80 percent of the world’s population. We are facing a different world from just a few decades ago. Two key issues are biodiversity and climate change.
Biodiversity
Biodiversity is now well recognized as a major global public good. About 80 percent of the world’s terrestrial species occur in the tropics, mostly in the humid tropics. Tropical rainforests are the world’s most species-rich terrestrial ecosystem, with 66 percent of the estimated 250 000 of the world’s plant species and 90 percent of the world’s insect species. The subhumid tropics probably come in as a distant second, with the East and southern African savannas having spectacularly large mammal and bird biodiversity.
The number of vascular plant species ranges from 30 000 to 90 000 in humid tropical forests, while the subhumid savannas harbor less than 1000 vascular plant species. Other natural tropical ecosystems, such as deserts, mangroves and semiarid ones, have much less biodiversity than tropical forests and savannas. Plant species richness (the number of species/unit area) increases with annual rainfall, and also increases with decreasing latitude. Biodiversity is drastically reduced when people transform these natural systems. It is now necessary to distinguish these fragmented forests that are extremely prone to deforestation from the “frontier forests,” those that are large, ecologically intact, relatively undisturbed and capable of supporting wide-ranging animal species, like the South American panther. Only about 37 percent of tropical forests may qualify as frontier forests.
Unfortunately, biodiversity hotspots are often at the same location as poverty hotspots in the tropics, a set-up for major lose–lose scenarios.
Climate Change
Climate change is clearly with us in the early twenty-first century, pretty much ending decades of skepticism by many in view of the increasingly solid scientific evidence. It is also clear that the majority of changes are anthropogenic – caused by humans – beyond natural fluctuations.
Global warming is the direct outcome of trapping infrared radiation in our atmosphere by trace concentrations of heat-trapping gases. Higher air temperatures are caused by the “greenhouse effect,” triggered by increasing trace concentrations of carbon dioxide, methane, nitrous oxide and other gases. Our atmosphere has warmed by about 1 °C since pre-industrial times (about 1750), resulting from an increase in CO2 from 280 ppm in 1750 to the level of 405 ppm CO2 in 2016. The 2 °C increase in global warming will occur when the atmospheric CO2 level reaches 450 ppm. The December 2015 United Nations Paris Agreement represents calls to limit global further temperature increase to “well below 2 °C” over pre-industrial levels, that is another 1 °C warmer. Good luck to us all in getting this to actually happen.
Climate change research is broadly divided into three categories: impacts, adaptation and mitigation. Impacts are the consequences of predicted climate change on humans and ecosystems. The main impacts in the tropics are: increasing air temperatures, particularly night temperatures; increasing rainfall variability; increasing frequency of extreme weather events (droughts, floods, hurricanes); more freshwater shortages; sea-level rise affecting low-lying coastal cities, where much of the population is concentrated; bleaching of coral reefs, giving rise to unsustainable fishing; thinning of tropical glaciers; and a northward geographic spread of malaria and other tropical diseases, as well as increased crop pest and disease pressure where wetter climates are beginning to happen. Most of these impacts are already measurable.
Adaptation is the ability of people and ecosystems to cope, usually described in terms of vulnerability. Unfortunately, the tropics is the most vulnerable region, because poor societies are less resilient to changes. Genetic manipulation offers several approaches, including breeding for resistance to higher day or night temperatures. Increasing nitrogen fertilizer applications are a practical way to adapt to rainfall variability.
Mitigation includes the actions people can take to decrease global warming. The main mitigation strategies are reducing greenhouse gas emissions to the atmosphere from soils, sequestering carbon in soils and plants, and avoiding further emissions by deforestation. The theoretical annual mitigations from agriculture are actually higher than the current annual greenhouse gas emissions from agriculture, showing a huge potential. Approximately 89 percent of the potential mitigations are from reduced soil emissions of CO2; 9 percent from mitigation of CH4 emissions from wetland soils, livestock and manures; and 2 percent from mitigation of nitrous oxide (N2O) emissions, mostly from soils.
Without the Green Revolution, about an additional half a billion hectares would have to be converted from tropical forests and savannas into agriculture to meet the 1995 levels.
Emphasis should shift from modeling the impacts of climate change toward implementing solutions to food security.