I. INTRODUCTION
Pure aluminum and aluminum alloys play a key role in modern engineering since they are the most used nonferrous materials. They have been widely used in automotive, aerospace, and construction engineering due to their good corrosion resistance, superior mechanical properties along with good machinability, weldability, and relatively low cost. It is well known that the grain size is one of the principal tools for controlling mechanical properties of polycrystalline metallic materials. At low temperatures, the yield strength is related to the grain size by the well-known Hall–Petch relationship, where the yield strength of the material increases with decreasing grain size. Currently, there are several commonly used methods of refining grains in laboratory, such as power deposition,Reference Sabirov, Murashkin and Valiev1 severe plastic deformation (SPD),Reference Sabirov, Murashkin and Valiev1 and dynamic plastic deformation (DPD).Reference Meyers2,Reference Yang, Ma and Hu3
As the competition between the generation and the annihilation of dislocations reaches a dynamic balance, a steady plastic deformation will occur. Experimental results indicated that the grain size has a linear relationship with the inverse square root of dislocation density (D c = Kρ−1/2).Reference Hull and Bacon4 Plenty of research showed that there is a saturate grain size during the SPD of metallic materials.Reference Chen, Li, Walmsley, Dumoulin, Gireesh, Armada, Skaret and Roven5 To refine grain further, some special methods should be developed, such as cryogenic or DPD.Reference Huang, Tao and Lu6,Reference Li, Tao and Lu7
Ultrafine grain materials that were produced by SPD or DPD contain a large amount of dislocations and nonequilibrium grain boundaries, which result in significant increase in hardness and strength but limited stability.Reference Rao, Singh and Jayaganthan8–Reference Shankar, Chandrasekar, King and Compton11 That is to say, such microstructures can be easily changed by recovery and recrystallization during annealing. Microstructural coarsening will inevitably weaken mechanical properties of materials, against their application as potential engineering materials. Therefore, it is essential to clarify the coincident influences of annealing treatment on the microstructural evolution, along with reducing the instabilities.
1050 commercial pure aluminum was subjected to high-strain-rate deformation with the strain rate up to 2.3 × 10³ s−1 by means of split Hopkinson pressure bar (SHPB) in this work. The effects of the high strain rate on microstructural evolution and thermal stability of 1050 commercial pure aluminum were investigated.
II. MATERIALS AND METHODS
1050 commercial pure aluminum (0.25% Si, 0.05% Mn, 0.05% Cu, 0.05% Mg, 0.05% Zn, and the balance Al, all in mass percentage) was annealed at 673 K for 3 h in a salt-bath furnace to diminish the effect of residual stress and obtain homogeneous coarse grains. The average grain size of these samples is about 46 μm. The cylindrical samples (Φ15 mm × 23 mm) were prepared for uni-axial impact loading.
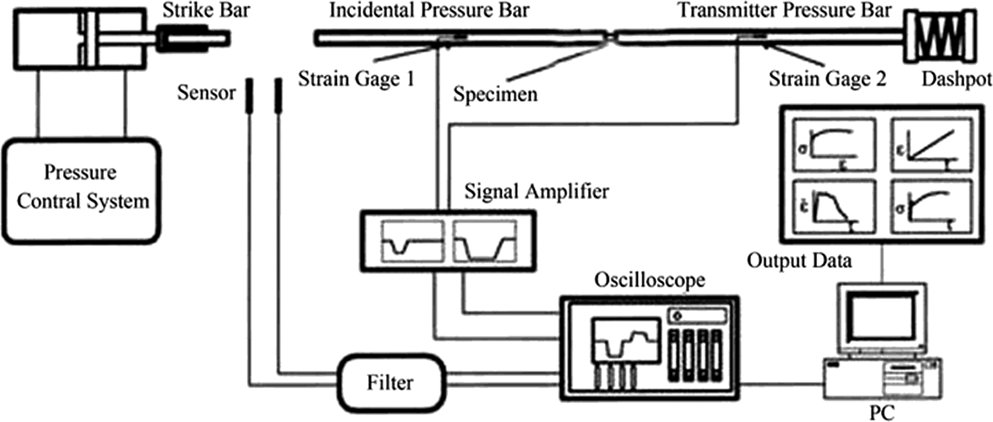
Figure 1 is the schematic diagram of SHPB, which was originally developed by Kolsky.Reference Kolsky12 The cylindrical-shaped samples (Φ15 mm × 23 mm) were prepared for uni-axial impact loading at high strain rates, and a reduction about 40% was achieved per pass. Plastic strain obtained during each pass is defined as ε = ln (h 0/h f), where h 0 and h f are the initial and the final thickness. The accumulation strain of uni-axial impacted samples was 1.8. The samples for annealing treatment were cut parallel to the loading direction, then annealed at 373, 423, 473, and 523 K for 1 h and quenched in water.
Schematic diagram of SHPB.
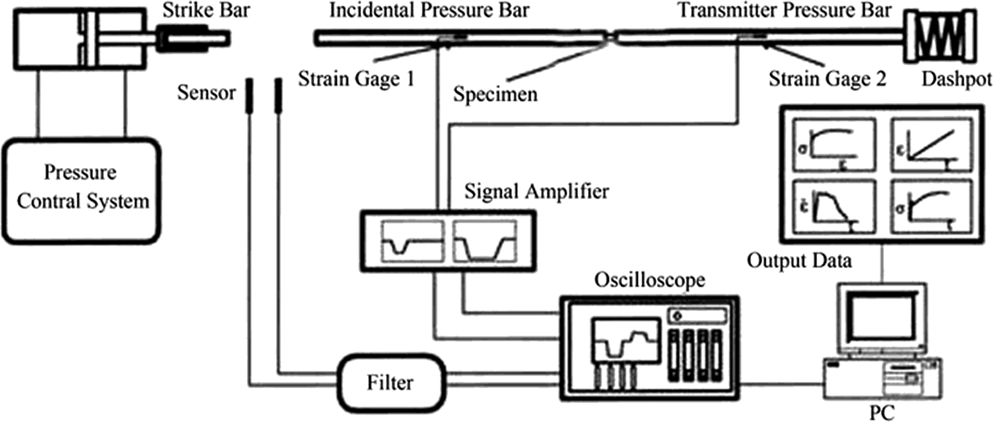
Microstructures of the as-deformed and annealed samples were characterized by using a Titan G2 60-300 transmission electron microscope (TEM; FEI Company, Eindhoven, Netherlands) in a section that is parallel to the loading direction, i.e., the longitudinal section. Thin foils for TEM observations were prepared by mechanical grinding to a thickness of 60 μm, final electro-polishing at 253 K in an electrolyte of 30% nitric acid and 70% methanol with a Struers Tenupol-5 double jet electrochemical machine (Struers, Ballerup, Denmark) operating at 20 V was carried out. Microhardness measurements were conducted on the longitudinal section under 3 kg load for 15 s. At least six separate measurements were conducted for each hardness value.
III. EXPERIMENT RESULTS
A. Flow stress–strain response
The signals of SHPB are electrical, as shown in Fig. 2 (the black solid line and red solid line represent the signals of the incident bar and transmitter bar, respectively), which should be transformed into mechanical information by the classical SHPB equationReference Meyers2,Reference Yang, Ma and Hu3 :
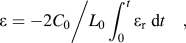 $$\varepsilon = {{ - 2{C_0}} \mathord{\left/ {\vphantom {{ - 2{C_0}} {{L_0}\int_0^t {{\varepsilon _{\rm{r}}}\;{\rm{d}}t} }}} \right. \kern-\nulldelimiterspace} {{L_0}\int_0^t {{\varepsilon _{\rm{r}}}\;{\rm{d}}t} }}\quad ,$$
 $$\dot \varepsilon = {{{\rm{d}}\varepsilon } \mathord{\left/ {\vphantom {{{\rm{d}}\varepsilon } {{\rm{d}}t}}} \right. \kern-\nulldelimiterspace} {{\rm{d}}t}} = {{ - 2{C_0}{\varepsilon _{\rm{r}}}} \mathord{\left/ {\vphantom {{ - 2{C_0}{\varepsilon _{\rm{r}}}} {{L_0}}}} \right. \kern-\nulldelimiterspace} {{L_0}}}\quad ,$$
 $$\sigma = {{E{A_0}{\varepsilon _{\rm{t}}}} \mathord{\left/ {\vphantom {{E{A_0}{\varepsilon _{\rm{t}}}} A}} \right. \kern-\nulldelimiterspace} A}\quad ,$$
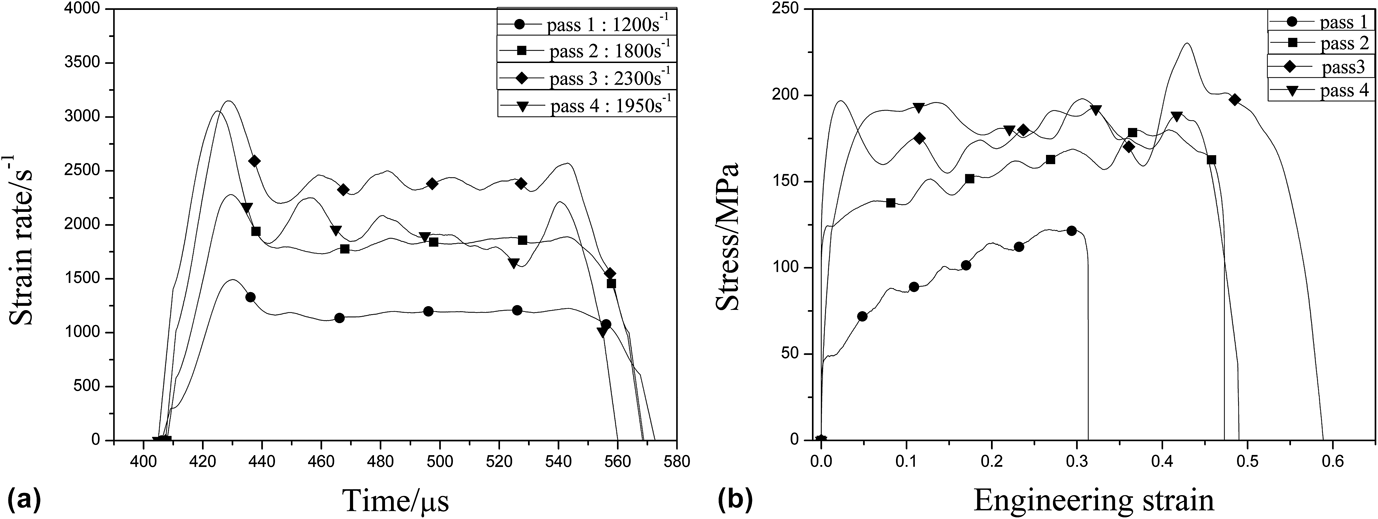
where C 0 and E are the elastic wave velocity and elasticity modulus of pressure bar, respectively, L 0 is length of the sample before impact, A 0 and A are cross-sectional areas of the pressure bar and sample before impact, εr and εt are electrical signals of the incident bar and transmitter bar, respectively. Strain rate–time  $\left( {\dot \varepsilon -t} \right)$ curves and stress–strain (σ–ε) relationships during high-strain-rate deformation are shown in Figs. 3(a) and 3(b).
The electrical signals of SHPB.

(a) The strain rate–time curves and (b) stress–strain curves obtained during high-strain-rate deformation.
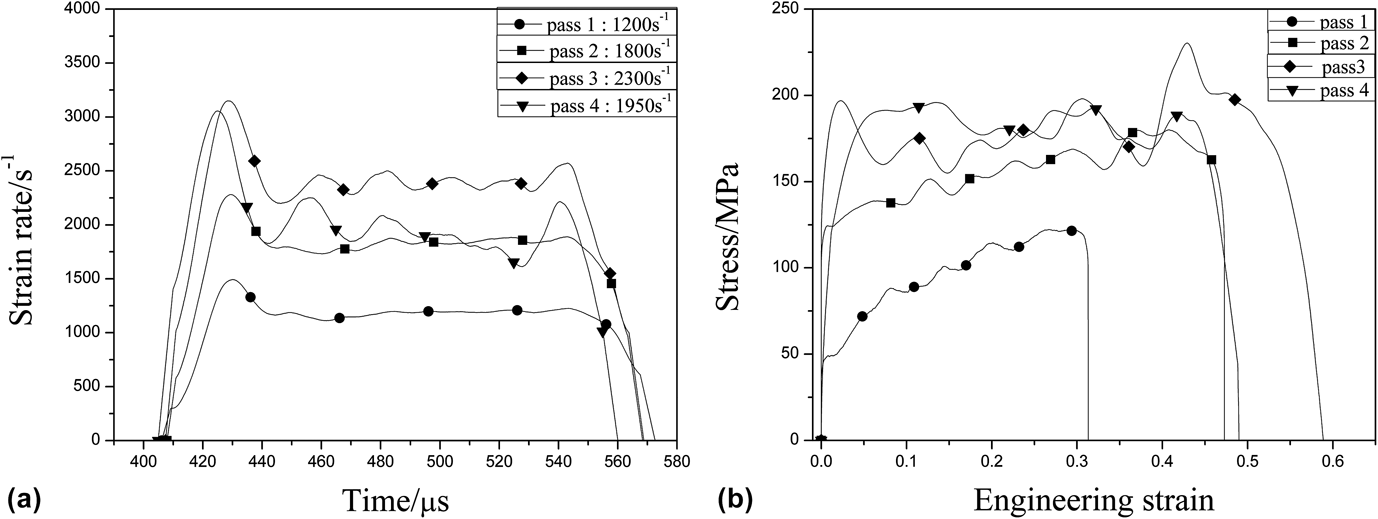
In the process of uni-axial impact loading, the strain rate increases from 1200 s−1 in pass 1 to 2300 s−1 in pass 3, and the flow stress presents a similar trend. In the first two passes, the flow stress increases with increasing strain, which indicates the effect of strain hardening and strain rate hardening. There is a saturate flow stress in pass 3 and pass 4, being about 180 MPa, indicating a dynamic equilibrium between generation and annihilation of strain-induced dislocations.
B. Microstructural characteristics of the samples after high-strain-rate deformation
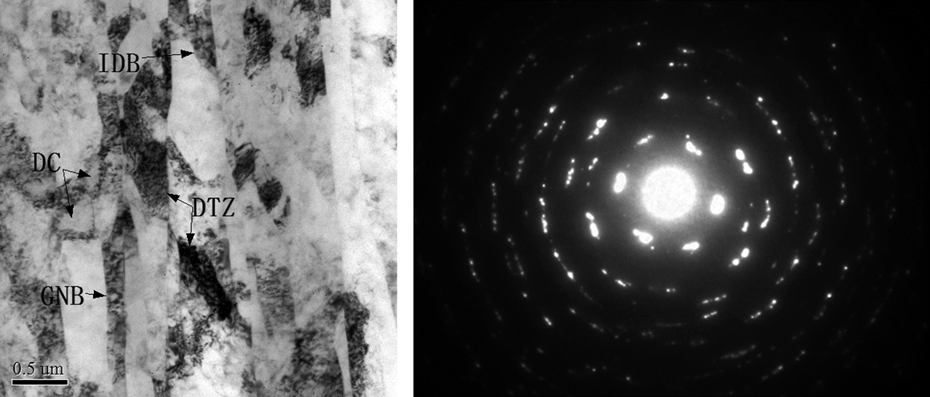
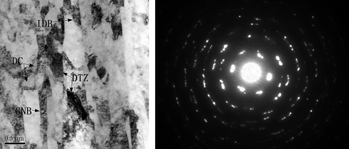
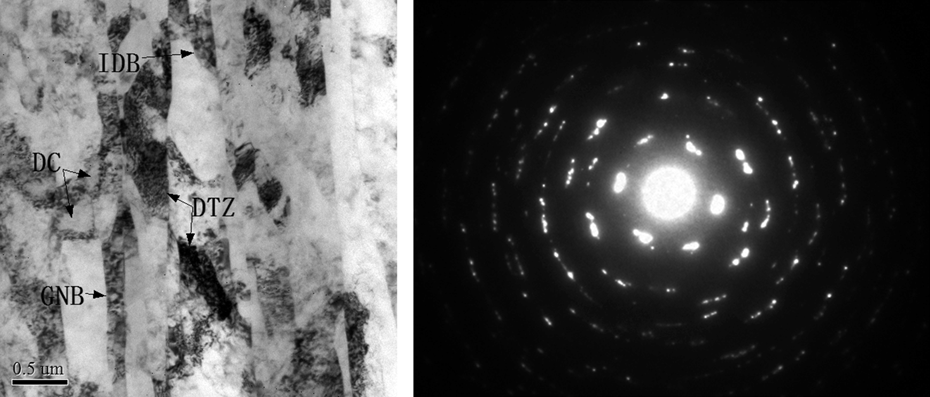
Figure 4 shows the typical TEM micrographs and the corresponding selected area electron diffraction patterns observed from the longitudinal section of the deformed samples. The dominant structural features of this high-strain-rate deformed Al are extended dislocation boundaries forming lamellar structures, which possess a regular shape with distinct and straight boundaries as well as a very high interior dislocation density. Different dislocation configurations, such as dislocation tangles and dislocation cells are produced [see Fig. 4]. The elongated lamellar structure in this uni-axial impacted sample seems like a bamboo structure obtained during cold rolling deformation, that is to say, serious deformed textures were produced, which can also be proven by the elongated diffraction spots in Fig. 4. The lamellar structure mainly consists of two types of boundaries, namely geometrically necessary boundaries (GNBs) and incidental dislocation boundaries (IDBs).Reference Liu, Juul and Hansen13,Reference Luo, Zhang, Hansen and Lu14 High density of dislocations was generated during high-strain-rate deformation, and they tend to distribute uniformly within the lamellar structures.
TEM image of the as-deformed sample. The illustration is the selected area diffraction pattern.
For quantitative analysis of subgrain/cell size distribution, the spacings between GNBs (D T) and IDBs (D L) were measured from TEM images as the intercept length along a line perpendicular and parallel to the extending direction. The results are plotted in Fig. 5. Statistical measurements of the average subgrain/cell sizes from at least 150 grains/cells are 293 nm (D T) and 694 nm (D L), respectively.
Statistical distribution of subgrain/cell sizes. D T and D L are the spacings between GNBs and IDBs of the as-deformed samples.
C. Microstructural evolution of the as-deformed samples during annealing treatment
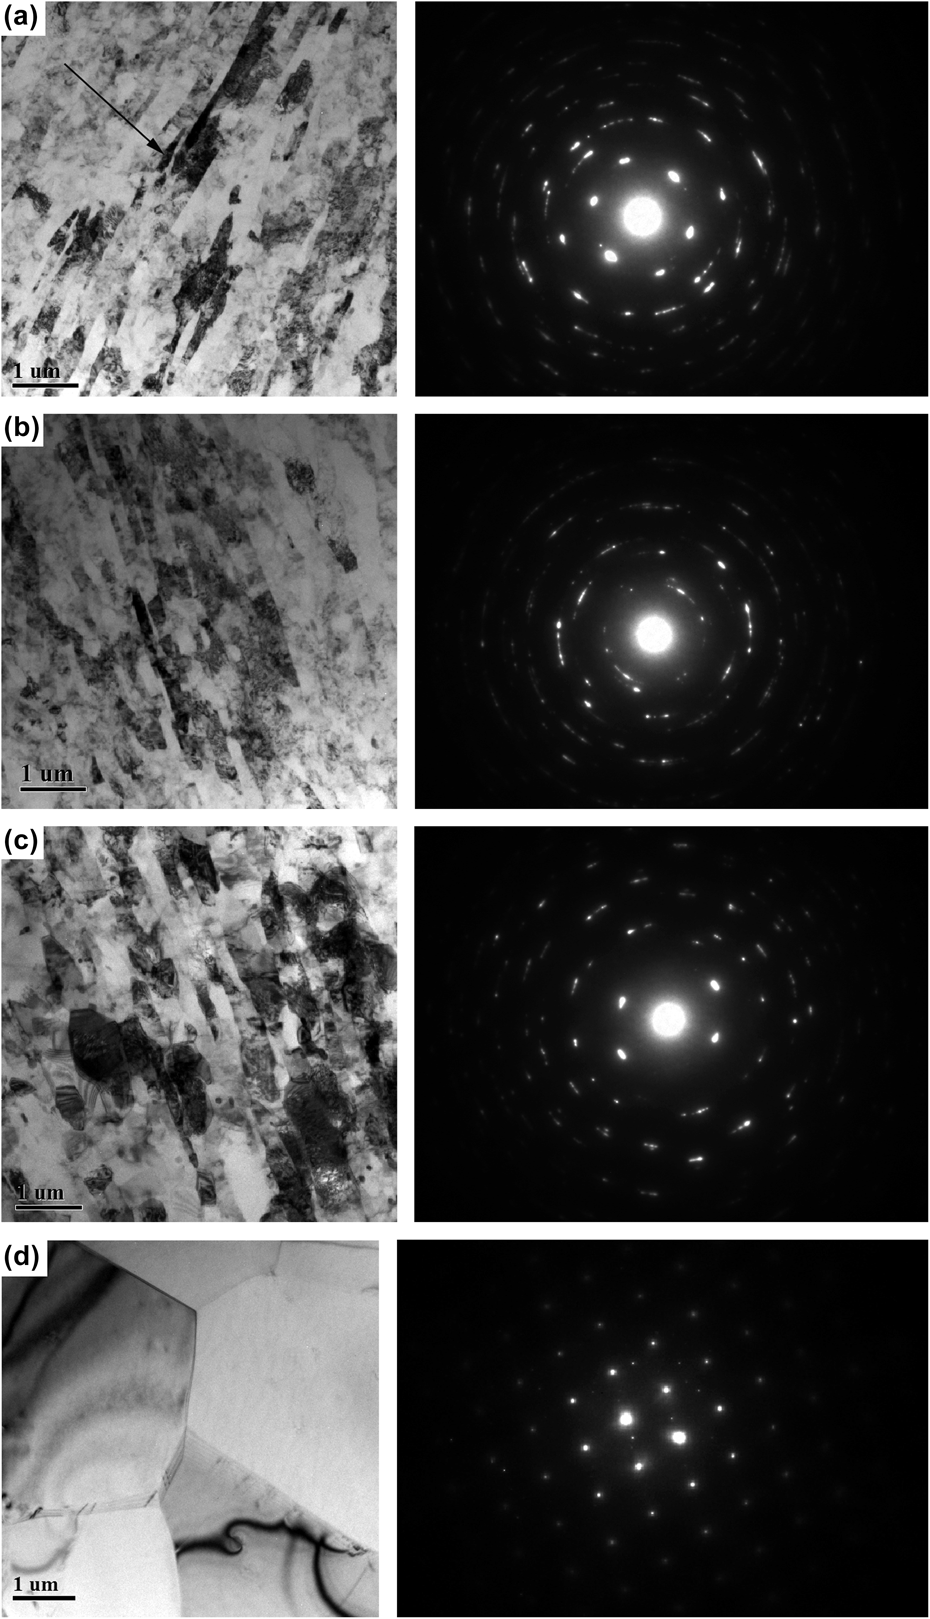
Isochronal annealing treatments for 1 h at increasing temperature lead to softening, microstructural coarsening, and a change in the crystallographic morphology. Figure 6 shows the representative TEM images of the specimens annealed at temperatures from 373 to 523 K for 1 h. The microstructural coarsening of the specimens annealed below 423 K [Figs. 6(a) and 6(b)] is insignificant. The majority of crystallites is still elongated. However, a mild microstructural coarsening is observed after annealing at 473 K [Fig. 6(c)]. The elongated lamellar structures are subdivided into subgrains. Most of the subgrains are pancake-shaped and consist of a large number of dislocations in the interior. Figure 6(d) shows that the microstructural features drastically change after annealing at 523 K for 1 h, and a significant microstructural coarsening and sharp grain boundaries evolve.
TEM images of the as-deformed specimens after 1 h annealing at various temperatures and the black arrow indicates the loading direction. (a) 373 K, (b) 423 K, (c) 473 K, and (d) 523 K.
Statistical distribution of subgrain/cell sizes from at least 150 subgrains/cells of the sample annealed below 473 K exhibits a lognormal distribution. Migration and interaction of the interior dislocations result in formation of incident dislocation boundaries and segmentation of lamellar structures into fine subgrains below 423 K, and thus D L decreases. For the sample annealed at 473 K [Fig. 7(c)], D T and D L are 442 and 875 nm, respectively, which coarsen slightly when compared with those annealed below 423 K. However, the sample with an average grain size of 4.7 μm was produced after annealing at 523 K for 1 h [Fig. 7(d)].
Statistical distribution of subgrain/cell sizes. (a)–(c) are the spacings between GNBs (D T) and IDBs (D L) of the samples after 1 h annealing treatment at 373, 423, and 473 K, respectively; (d) is the grain size distribution of the sample after 1 h annealing treatment at 523 K.
D. Microhardness measurements
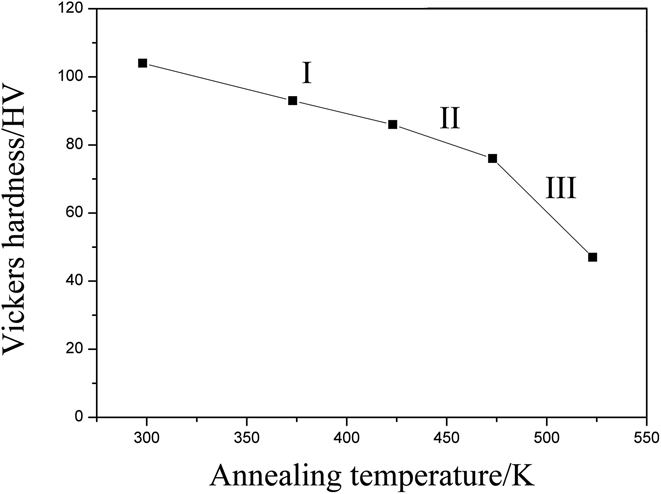
The specimens for microhardness tests are sectioned parallel to the loading direction from the as-deformed samples and the annealed samples, and the results are illustrated in Fig. 8. The microhardness gradually decreases with increasing annealing temperature at low temperatures below 473 K, which has been interpreted as continuous recovery or recrystallization at temperature above 473 K.
Microhardness curve of the as-deformed samples as a function of annealing temperatures.
IV. DISCUSSION
A. Flow stress curve characteristics
As shown in Fig. 3(b), the flow stress increases with the increasing strain in pass 1 and pass 2, indicating the effect of strain and strain rate hardening in the process of high-strain-rate deformation. There is a saturate flow stress in pass 3 and pass 4, the effect of work hardening is insignificant at large strains, which is attributed to generation and annihilation of dislocations reaching an equilibrium state. Besides, the saturate flow stress of commercial-pure aluminum in this work is about 190 MPa, larger than that of experiment results of quasistatic loading 120–170 MPa (see Refs. Reference Kapoor, Sarkar, Yogi, Shekhawat, Samajdar and Chakravartty15–Reference El-Danaf, Soliman, Almajid and El-Rayes18). It is therefore to be expected that higher density of crystal defects (mainly dislocations) introduced by high strain rate loading is responsible for this higher flow stress.
B. Microstructural evolution mechanism during high-strain-rate deformation
Figure 4 shows that the structural morphology appears not to be strongly affected by the increase in the strain rate and the dominating deformation mechanism in this high-strain-rate deformed Al is typically dislocation glide. The universal pattern of microstructural evolution during deformation at a low strain rate also applies when the strain rate is increased to a high level of 103 s−1. However, the mechanism of dislocation nucleation is clearly affected by the significant increase in the strain rate.
It is well known that the dislocation nucleation mechanism in the process of quasistatic plastic deformation can be explained by the Frank–Read source model. While for deformation at an extremely high strain rate, the homogeneous dislocation nucleation mechanism proposed by MeyersReference Meyers2 is applicable.
In light of the above model, during DPD, stress propagates along the loading direction in the form of a wave. As the shock wave penetrates into the material, high deviatoric stresses effectively distort the initially cubic lattice into a monoclinic lattice. When these stresses reach a certain threshold level, homogeneous dislocation nucleation can take place and then high densities of uniformly distributed dislocations are generated. Meanwhile, dislocations propagate at a speed of subsonic, but the propagation distance is limited. In general, the density of dislocation produced under high-strain-rate loading is about 103–104 times higher than that under statics loading.Reference Meyers2
For the short loading periods during high-strain-rate deformation at 103 s−1, dislocation movement and interactions are restricted, resulting in the limited motion distance of dislocations, so dislocation density is significantly higher than conditions of quasistatic loading. Density of dislocations can be approximated as given in Eq. (4) (Ref. Reference Cahn and Haasen19):
 $$\dot \gamma = \rho b\upsilon \quad ,$$
where  $\dot \gamma$ is the shear strain rate, ρ is average density of mobile dislocation per unit volume, v is the dislocation velocity, and b is the Burgers vector. During DPD, a higher strain rate is beneficial for the generation of dislocations, while the rearrangement and annihilation of dislocations are depressed and the average free path of mobile dislocation is limited, which results in a higher density of dislocations. Therefore, high-strain-rate deformation is significantly beneficial for the efficient refinement of grains according to the above qualitative analysis.
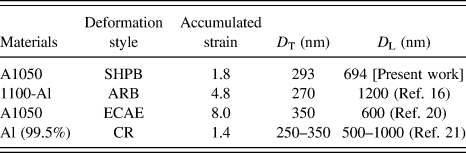
The average grain sizes of pure aluminum produced by different technologies are listed in Table I. It can be seen that a similar effect of grain refining has been obtained, but the accumulate strain of dynamic loading in this work is significantly lower than that of quasistatic loading, thus one can say that dynamic loading is more beneficial for the efficient refinement of grains than quasistatic loading under the same strain.
The average grain sizes of pure aluminum produced by different technologies.
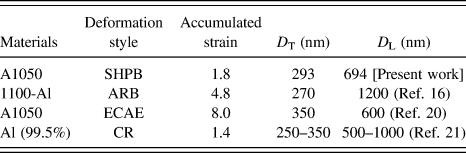
ARB = Accumulative Roll Bonding, ECAE = Equal Channel Angular Extrusion, CR = Cold Rolling.
C. Thermal stability of the as-deformed structure
Yu et al.,Reference Yu, Sun, Kao and Chang20 Mishin et al.Reference Mishin, Godfrey, Juul Jensen and Hansen22 and Hansen et al.Reference Hansen, Huang, Moller and Godfrey23 found that annealing treatment of cold rolled aluminum alloys has led to a possible change from conventional (discontinuous) recrystallization at low-to-medium strains to extended recovery or continuous recrystallization at very large strains. In this work, the initial lamellar grain structures of a dynamic impacted sample which consists of elongated grains are subdivided into pancake-shaped subgrains due to a gradual transition by triple junction motionReference Yu, Hansen and Huang24 at 473 K, and then a dramatic microstructural coarsening is observed at 523 K.
With the assumption that the driving force on a boundary arises only from the curvature of the boundary, the kinetics of grain growth can be described by Eqs. (5) and (6) (Ref. Reference Fur, Oresund and Nest25):
 $${D^2} - \mathop {{D_0}}\nolimits^2 = k{t^n}\quad ,$$
 $$k = A\;{\rm{exp}}\left( {{{ - Q} \mathord{\left/ {\vphantom {{ - Q} {RT}}} \right. \kern-\nulldelimiterspace} {RT}}} \right)\quad ,$$
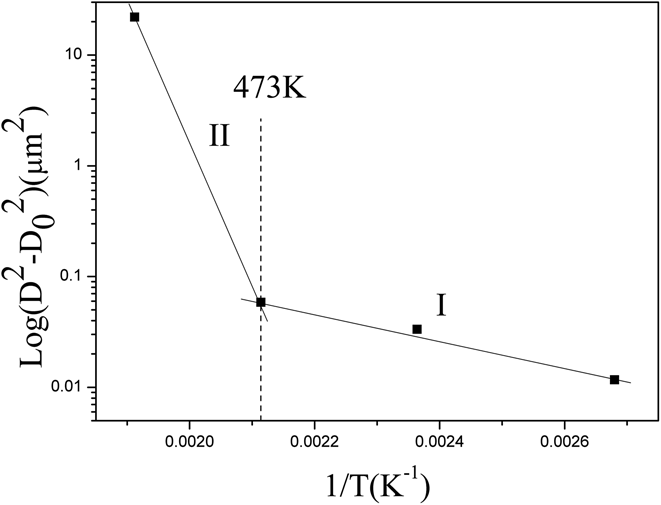
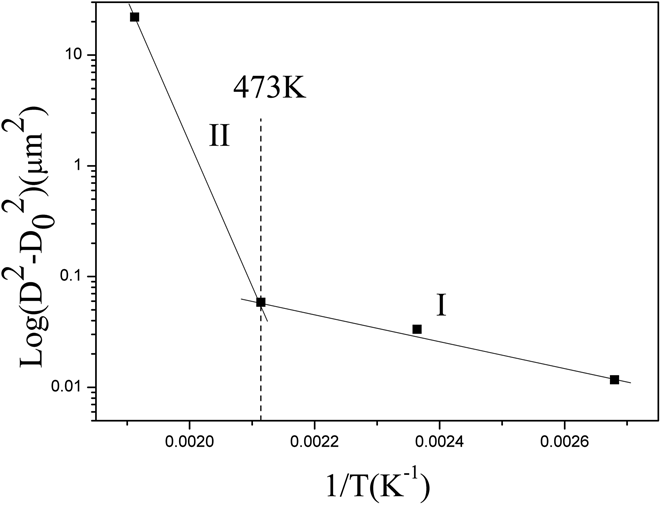
where D is the average grain size at time t (here taken as the equivalent circle diameter, the diameter of a circle having the same area as the grain, D T × D L = πD 2/4), D 0 is the initial average grain size, Q is the apparent activation energy for grain growth, R is the gas constant, T is the absolute temperature, and A and n are constants. For pure aluminum, the parameters A and n can be taken as 7.2 × 10⁻¹² m2 and 1, respectively.Reference Yu, Sun, Kao and Chang20,Reference Zhao, Xu, Liu and Wang26 The average grain size obtained at different temperatures in the isochronal annealing treatment may be interpreted in terms of Eq. (5) by plotting log(D 2 − D 02) versus 1/T, and the activation energy of grain growth can be determined. The result is shown in Fig. 9. At the annealing temperature below 473 K (regime I), the apparent activation energy is 51 kJ/mol, while in the range of 473–523 K (regime II), the apparent activation energy is 159 kJ/mol. Both were found to be much smaller than that of recrystallization, which is 178 kJ/mol.Reference Vandermeer and Hansen27 In addition, the hardness after 1 h at 523 K (47H V) is far from the hardness of a fully recrystallized Al 1050 (20H V). Therefore, the annealing behavior of this dynamic loading structure is better considered as a continuous process of grain coarsening or continuous recovery.
The kinetics of grain growth is illustrated by plotting log(D 2 − D 02) versus 1/T. It shows a discontinuous transition from low-temperature (regime I) to high-temperature (regime II).
Stored energy (E s) will increase as the dislocation density increases according to Eq. (7) (Ref. Reference Godfrey, Cao, Hansen and Liu28) as follows:
 $${E_{\rm{s}}} = K\rho G{b^2}\quad ,$$
where K is a constant, ρ is the average density of mobile dislocation per unit volume, G is the shear modulus, and b is the Burgers vector. Higher density of dislocations produced in the process of high-strain-rate deformation means higher stored energy and more nonequilibrium dislocation configurations, which will inevitably provide more driving force for recovery and recrystallization, and further cause significant microstructural coarsening in the subsequent annealing treatment.
V. CONCLUSION
(1) An elongated lamellar structure with an average subgrain/cell size of 293 and 694 nm in the direction perpendicular and parallel, respectively, to the extending direction is produced by high-strain-rate deformation. The initial coarse grains are refined significantly.
(2) The initial lamellar grain structures are subdivided into pancake-shaped subgrains due to a gradual transition by triple junction motion at 473 K, and then a dramatic microstructural coarsening is observed at 523 K. Annealing behavior of this dynamic loading structure is better considered as a continuous process of grain coarsening or continuous recovery.
(3) Thermal stability of dynamic loading samples in this work is well at lower annealing temperatures below 473 K, but it gets worse suddenly when annealed at 523 K. Therefore, the microstructure of this high-strain-rate deformed pure aluminum is stable below 473 K.
ACKNOWLEDGMENTS
This work is supported by the National Natural Science Foundation of China (No. 51274245), NSAF (No. U1330126), the Ph.D. Programs Foundation of Ministry of Education of China (No. 20120162130006), the Hunan Provincial Natural Science Foundation of China (No. 14JJ2011), and the key project of State Key Laboratory of Explosion Science and Technology (No. KFJJ11-1).