I. INTRODUCTION
There are many kinds of zinc borates found in nature as well as synthesized in the laboratory. Some of these borates have useful properties. During the past years, many borates were chosen as host lattices for phosphors because of their large band gap, high thermal stability, high luminescence efficiency, and low cost. Reference Liu, Wang, Wu and Kuang1,Reference Liu, Liang, Kuang, Zhong, Sun and Tao2
In recent years, zinc borates began to obtain some attentions being a host for photoluminescence (PL) applications, which were activated by trivalent rare-earth ions. For the preparation of lanthanide doped zinc borates luminescent materials, several methods have been designed, for example, Li et al. prepared Zn(BO2)2:Tb3+ or Dy3+ powder samples by the method of solid phase reaction at high temperature. Reference Li, Zhang, Tang, Zhang, Hao, Su and Wang3,Reference Li, Zhang, Tang, Hao, Zhang, Su and Wang4 Zheng et al. prepared Eu3+ doped ZnB2O4 with co-precipitation method. Reference Zheng, Qu, Tian, Rong, Wang, Li, Chen and Ma5 Liu et al. prepared Eu3+, Bi3+ co-activated ZnB2O4 with solid state reactions and found Eu3+ in ZnB2O4 exhibits a dominant emission peak at 610 nm under the excitation at 393 nm. Reference Liu, Lin, Chiu, Yeh, Jang and Liu6 Mu et al. prepared Bi3+, Gd3+ co-doped ZnB2O4 with solid state method. Reference Mu, Hu, Chen, Wang, Chen, Wang, Fu and Xu7
To the best of our knowledge, the luminescence properties of Eu3+ and Tb3+ co-activated ZnB2O4 have not been reported yet. In this paper, we report a novel thermal conversion method for preparation of ZnB2O4: Eu3+, Tb3+ phosphor using Zn[B3O3(OH)5]·H2O: Eu3+, Tb3+ as the precursor for the first time. The results show that ZnB2O4: Eu3+, Tb3+ has stronger emission intensity than that prepared by conventional high temperature solid state reaction method. Meanwhile, ZnB2O4: Eu3+, Tb3+ has stronger emission intensity and higher red to orange ratio than ZnB2O4: Eu3+.
II. EXPERIMENTAL
A. Preparation of Zn[B3O3(OH)5]·H2O: Eu3+, Tb3+ precursor
All of the reagents were of analytical grade and used directly without further purification. In a typical synthesis, stoichiometric ZnSO4·7H2O, Eu2O3, and Tb4O7 were dissolved in 80 mL of H2O, in which Tb3+ ion doped concentration was variable from 1 mol% to 15 mol% of total mole numbers for Zn2+, Eu3+, and Tb3+ while the Eu3+ doped concentration was fixed 6 mol% of Zn2+, Eu3+, and Tb3+. And then, 80 mL of solution containing 0.01 mol of Na2B4O7·10H2O and 1 mmol cetyltrimethyl ammonium bromide (CTAB) used as the surfactant was added. After being vigorously stirred for 48 h at room temperature, the obtained precipitate was washed with distilled water and absolute alcohol several times and dried at 50 °C for several hours for further characterization. The possible formation reactions are expressed as follows:
 $${\left[ {{{\rm{B}}_4}{{\rm{O}}_5}{{\left( {{\rm{OH}}} \right)}_4}} \right]^{2 - }} + 2{{\rm{H}}_2}{\rm{O\ }} = = {\rm{\ }}{\left[ {{{\rm{B}}_3}{{\rm{O}}_3}{{\left( {{\rm{OH}}} \right)}_5}} \right]^{2 - }} + {{\rm{H}}_3}{\rm{B}}{{\rm{O}}_3}\quad ,$$
 $${\left[ {{{\rm{B}}_3}{{\rm{O}}_3}{{\left( {{\rm{OH}}} \right)}_5}} \right]^{2 - }} + {\rm{Z}}{{\rm{n}}^{2 + }} + \left( {{\rm{{\rm E}}}{{\rm{u}}^{3 + }},{\rm{T}}{{\rm{b}}^{3 + }}} \right) + {{\rm{{\rm H}}}_2}{\rm{O}} = = {\rm{Zn}}\left[ {{{\rm{B}}_3}{{\rm{O}}_3}{{\left( {{\rm{OH}}} \right)}_5}} \right]\cdot{{\rm{H}}_2}{\rm{O}}:{\rm{{\rm E}}}{{\rm{u}}^{3 + }},{\rm{T}}{{\rm{b}}^{3 + }}\quad .$$
B. Preparation of ZnB2O4: Eu3+, Tb3+ phosphors
The samples named A-700, A-800, and A-900 were prepared by calcining the Zn[B3O3(OH)5]·H2O: Eu3+, Tb3+ precursor at 700, 800, and 900 °C for 6 h in air, respectively. The possible thermal conversion reaction is expressed as follows:
 $${\rm{Zn}}\left[ {{{\rm{B}}_3}{{\rm{O}}_3}{{\left( {{\rm{OH}}} \right)}_5}} \right]\cdot{{\rm{H}}_2}{\rm{O}}:{\rm{E}}{{\rm{u}}^{3 + }},{\rm{T}}{{\rm{b}}^{3 + }}\buildrel {700-900\,{\rm{^\circ C}}} \over \longrightarrow {\rm{Zn}}{{\rm{B}}_2}{{\rm{O}}_4}:{\rm{E}}{{\rm{u}}^{3 + }},{\rm{T}}{{\rm{b}}^{3 + }} + 3.5{{\rm{H}}_2}{\rm{O}} + 0.5{{\rm{B}}_2}{{\rm{O}}_3}\quad .$$
For comparison, polycrystalline samples of ZnB2O4:Eu3+ phosphor and ZnB2O4:Eu3+, Tb3+ (B-900) powder were also synthesized by conventional high temperature solid state reaction. The mixture of all materials for ZnO, H3BO3, Eu2O3, and Tb4O7 in stoichiometric proportion was ground in an agate mortar and then transferred to platinum crucibles, which was heated at 900 °C for 6 h in a furnace under ambient atmosphere, followed by cooling to room temperature. The cooled sample was ground again and washed with distilled water and absolute alcohol several times, and then dried at 50 °C for several hours for further characterization.
The doping amount of Tb3+ in ZnB2O4:Eu3+, Tb3+ (A) and ZnB2O4: Eu3+, Tb3+ (B-900) was 3 mol% of Zn2+, Eu3+, and Tb3+, while the Eu3+ doped concentration was fixed 6 mol% of Zn2+, Eu3+, and Tb3+. The doping amount of Eu3+ in ZnB2O4: Eu3+ is 6 mol% of Zn2+ and Eu3+.
C. Characterization
The phase composition, purity, and crystallinity of the samples were characterized by Fourier transform infrared (FT-IR) spectroscopy (recorded over the 400–4000 cm−1 region on a Nicolet NEXUS 670 spectrometer [Nicolet Corporation, Madison, Wisconsin] with KBr pellets at room temperature), X-ray powder diffraction (XRD, Rigaku D/MAX-C, Cu Kα radiation at 40 kV and 40 mA [Rigaku Corporation, Tokyo, Japan]), and energy dispersive x-ray spectrometer (EDS, JEOL-6700F, Hitachi Limited, Tokyo, Japan). The morphologies and sizes of the products were investigated by scanning electron microscopy (SEM, Philips-FEI, Quanta 200, FEI Corporation, Hillsboro, Oregon). The PL spectra were recorded on a molecular fluorescence spectrometer (FL-4600, Hitachi Limited) equipped with a 150 W xenon lamp as the excitation source at room temperature.
III. RESULTS AND DISCUSSION
A. Phase identification and morphology
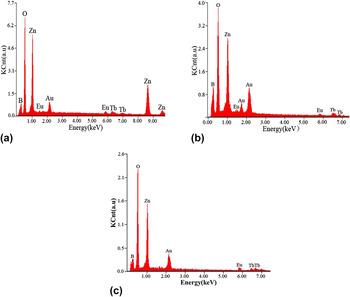
The EDS patterns of Zn[B3O3(OH)5]·H2O: Eu3+, Tb3+, ZnB2O4: Eu3+, Tb3+ (A-900), and ZnB2O4: Eu3+, Tb3+ (B-900) are shown in Fig. 1. The elements of Zn, B, O, Eu, and Tb existed in these samples, and no other elements were found except Au which was from the process of pretreatment. From these results, we can conclude that the Eu3+ ions and Tb3+ ions doped phosphors were prepared successfully.
EDS of samples: (a) Zn[B3O3(OH)5]·H2O: Eu3+, Tb3+; (b) ZnB2O4: Eu3+, Tb3+ (A-900); (c) ZnB2O4: Eu3+, Tb3+ (B-900).

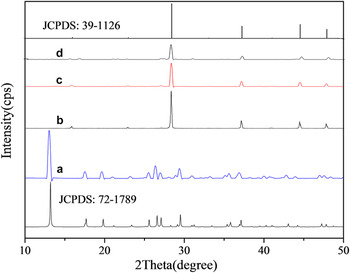
Figure 2 shows the XRD patterns of all the synthesized samples. It can be seen that all the diffraction peaks and data in Fig. 2 are in good agreement with those in JCPDS file No.72-1789 for Zn[B3O3(OH)5]·H2O and JCPDS file No.39-1126 for ZnB2O4, respectively. There are no peaks of impurities being observed. From these results, we can conclude that the Eu3+ and Tb3+ co-doped phosphors were prepared successfully by calcining the precursors, and the doping of Eu3+ and Tb3+ did not change the structures of the products.
XRD patterns of samples: (a) Zn[B3O3(OH)5]·H2O: Eu3+, Tb3+; (b) ZnB2O4: Eu3+, Tb3+ (A-900); (c) ZnB2O4: Eu3+, Tb3+ (B-900); (d) ZnB2O4: Eu3+.

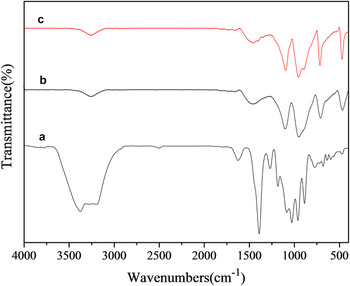
Figure 3 shows the FT-IR spectra of all the synthesized samples. Their absorption bands are assigned referring to literature. Reference Li, Xia and Gao8 In Fig. 3(a) for Zn[B3O3(OH)5]·H2O: Eu3+, Tb3+, the band at 3200 cm−1 is the stretching of O–H. The band at 2496 cm−1 is attributed to the O–H stretching because of hydrogen bonding. The band at 1625 cm−1 is the H–O–H bending of lattice water. The peaks at 1391, 1263, and 880 cm−1 might be asymmetric and symmetric stretching of B(3)–O, respectively. The peaks at 1175, 1030, and 768 cm−1 are the asymmetric and symmetric stretching of B (4)–O, respectively. The peak at 768 cm−1 is the out-of-plane bending of B (3)–O. The peak at 582 cm−1 is the bending of B (3)–O and B(4)–O. In Figs. 3(b) and 3(c) for samples ZnB2O4: Eu3+, Tb3+ (A-900), and ZnB2O4: Eu3+, Tb3+ (B-900), their FT-IR spectra are almost the same. The very strong bands at 1384 and 930 cm−1 might be asymmetric and symmetric stretching of B (3)–O, respectively. The band at 1092 cm−1 is related to B–O chain stretching. The band at 696 cm−1 is the out-of-plane bending of B (3)–O. The band at 470 cm−1 is attributed to the stretching mode of Zn–O.
The FT-IR spectra of samples: (a) Zn[B3O3(OH)5]·H2O: Eu3+, Tb3+; (b) ZnB2O4: Eu3+, Tb3+(A-900); (c) ZnB2O4: Eu3+, Tb3+ (B-900).

B. The excitation and emission spectra of ZnB2O4: Eu3+, Tb3+
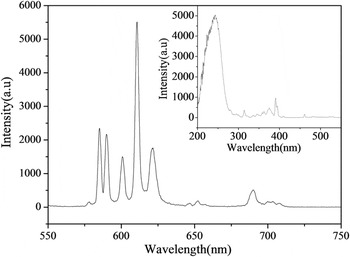
Figure 4 shows the excitation (insert) and emission spectra of ZnB2O4: Eu3+, Tb3+ phosphor. The broad and strongest excitation band at 243 nm can be attributed to the O2− → Eu3+ charge transfer transition, which corresponds to the electronic transitions from the 2p orbital of O2− to the 4f orbital of Eu3+. The sharp excitation peaks between 300 and 500 nm are due to the typical f–f transition of Eu3+. Reference Parchur and Ningthoujam9 Upon excitation samples at 243 nm, the emission spectrum involves the characteristic emission lines originating from 5D0 low energy transfer of Eu3+, corresponding to 5D0 → 7F1 (590, 601 nm), 5D0 → 7F2 (611 nm i.e., the strongest emission peak) and 5D0 → 7F4 (691 nm), respectively. Reference Parchur and Ningthoujam9 Meanwhile, the emission spectrum also involves the characteristic emission lines of Tb3+, corresponding to the 5D4 → 7F4 (585 nm) and 5D4 → 7F3 (621 nm) transitions, respectively. Reference Som and Sharma10
The excitation (insert) and emission spectra of ZnB2O4: Eu3+, Tb3+.

The intensity of red emission, centering around 611 nm, is enhanced remarkably, which may be ascribed to the increase of defect concentration. In addition, it also shows that the PL intensity of Eu3+(5D0 → 7F2, 611 nm) is higher than that of Tb3+(5D4 → 7F5, 585 nm), which may be explained to Tb3+ → Eu3+ energy transfer, namely Tb3+ ions transfer the absorption of energy to Eu3+ ions effectively, making the intensity of Eu3+ ions enhanced. Reference Som and Sharma10
C. The effect of doped concentration on the PL intensity of ZnB2O4: Eu3+, Tb3+
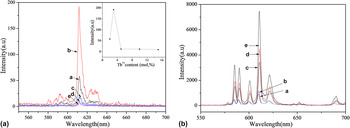
To understand the effect of doped concentration on the PL intensity of ZnB2O4:Eu3+, Tb3+ phosphor, the emission spectra of the Tb3+ and Eu3+ co-doped Zn[B3O3(OH)5]·H2O samples with various Eu3+/Tb3+ molar ratios were recorded on excitation at 260 nm, as shown in Fig. 5(a). It can be found that the emission intensities increase up to 3 mol% and then decreases. The decrease in the emission intensity occurs as a result of the nonradiative energy transfer between the Tb3+ ions due to the electric multiple–multiple interactions, which is distance-dependent according to Dexter's theory, Reference Liu, Lin and Lin11 thus the quenching concentration of Tb3+ was found to be 3 mol%. So, the PL spectra of ZnB2O4: Eu3+, Tb3+ phosphors with Eu3+/Tb3+ molar ratios for 6:1, 6:1.5, 6:2, 6:2.5, and 6:3 on excitation at 243 nm were investigated, as shown in Fig. 5(b).
(A) The PL spectra of Zn[B3O3(OH)5]·H2O: 0.06Eu3+, yTb3+ samples: (a) 2%, (b) 3%, (c) 5%, (d) 10%, (e) 15%; (B) The PL spectra of ZnB2O4: 6%Eu3+, yTb3+ samples: (a) 1%, (b) 1.5%, (c) 2%, (d) 2.5%, (e) 3%.

It can be found from Fig. 5(b) that the emission peak positions of all these samples are almost the same, but the emission intensities are varied. The intensity of red emission centering around 611 nm is enhanced remarkably, and the emission intensities and the red to orange intensity ratio of 5D0 → 7F2 (611 nm)/5D0 → 7F1(590, 601 nm) are enhanced with the increase of Tb3+ doped concentrations, which may be explained by energy transfer between Tb3+ and Eu3+. Reference Som and Sharma10 Here, Tb3+ acts as a sensitizer and Eu3+ as an activator.
So we chose the optimum doping amount of Tb3+ was 3 mol%, while the Eu3+ doped concentration was fixed 6 mol%.
D. Effect of the calcination temperature on the PL properties of ZnB2O4: Eu3+, Tb3+
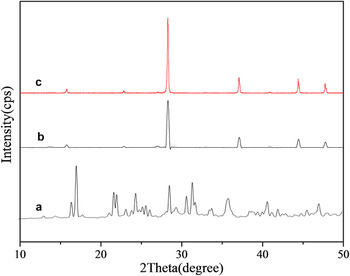
Figure 6 shows the XRD patterns of samples prepared by calcining precursor Zn[B3O3(OH)5]·H2O: Eu3+, Tb3+ at 700, 800, and 900 °C, respectively. From Fig. 6, it can be seen that the ZnB2O4: Eu3+, Tb3+ phosphors were obtained at 800 °C and 900 °C, and another phosphor ZnB4O7: Eu3+, Tb3+ was obtained at 700 °C. It needs to indicate that the glassy state sample was obtained at 1000 °C.
XRD patterns of samples prepared by calcining the precursor at various temperatures:(a) A-700, (b) A-800, (c) A-900.

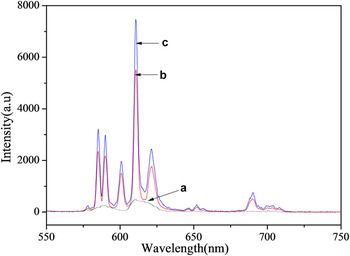
Figure 7 shows the emission spectra of phosphors named A-700, A-800, and A-900. It can be seen that the ZnB4O7: Eu3+, Tb3+ only has weak emission, but the ZnB2O4: Eu3+, Tb3+ phosphors have strong emission, and the maximum emission intensity is observed at 900 °C, which is in good agreement with the results of the XRD analysis (Fig. 6), as optimum crystallinity is presented at 900 °C.
Emission spectra of samples prepared by calcining the precursor at various temperatures:(a) A-700, (b) A-800, (c) A-900.

E. Effect of the calcination time on the PL properties of ZnB2O4: Eu3+, Tb3+
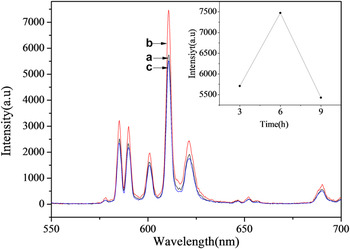
It can be seen from Fig. 8 that the PL intensity of ZnB2O4: Eu3+, Tb3+ enhances with the increase in the calcination time and reaches a maximum at 6 h because of the better crystallization, however the intensity decreases dramatically when the calcination time prolong to 9 h. It may be the agglomeration and larger particle size of ZnB2O4: Eu3+, Tb3+ phosphors that lead to the increasing of surface defects and decreasing of exciting surface area. Reference Huang and Liu12
Emission spectra of the ZnB2O4: Eu3+, Tb3+ (A-900) prepared by calcining the precursor at 900 °C for various times: (a)3 h, (b)6 h, (c)9 h.

F. Comparing study of ZnB2O4: Eu3+, Tb3+ prepared by precursor method and solid-state reaction method
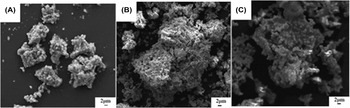
Figures 2 and 9 show the XRD patterns and the SEM images of ZnB2O4: Eu3+, Tb3+, and ZnB2O4: Eu3+ phosphors prepared by present precursor method and conventional solid-state reaction method at 900 °C, respectively.
SEM image of samples: (A) ZnB2O4: Eu3+, Tb3+ (A-900), (B) ZnB2O4: Eu3+, Tb3+(B-900), (C) ZnB2O4: Eu3+.

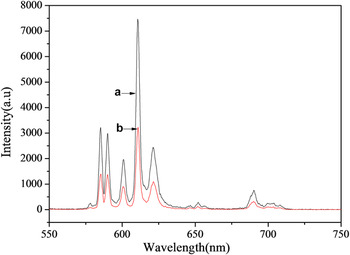
As shown in Fig. 10, the emission peak positions of the ZnB2O4: Eu3+, Tb3+ samples are almost the same, but the emission intensities are varied with different synthesis method. For the same reaction temperature and time, the emission intensity of ZnB2O4: Eu3+, Tb3+ phosphor prepared by the present precursor method is much higher than that of ZnB2O4: Eu3+, Tb3+ prepared by solid-state reaction method. The improvement of emission intensity is ascribed to the relatively larger particle size and smoother particle surface when using the precursor method as shown in Fig. 9(a). Reference Huang and Liu12
Emission spectra of ZnB2O4: Eu3+, Tb3+ (A-900) and ZnB2O4: Eu3+, Tb3+ (B-900) prepared through two different approaches: (a) precursor method, (b) solid-state reaction method.

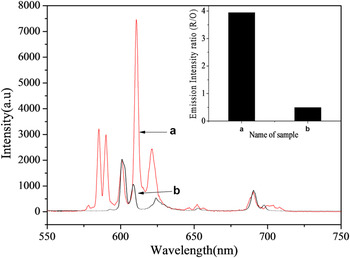
As shown in Fig. 11, ZnB2O4: Eu3+, Tb3+ phosphor prepared by the present precursor method not only has stronger emission intensity but also exhibits higher red to orange intensity ratio (R/O) than those of ZnB2O4: Eu3+ phosphor, which may be explained by energy transfer between Tb3+ and Eu3+. Reference Som and Sharma10
Emission spectra of (a) ZnB2O4: Eu3+, Tb3+(A-900) and (b)ZnB2O4: Eu3+.

All these results indicate that the PL intensity and color purity of ZnB2O4: Eu3+, Tb3+ could be enhanced largely by the present precursor method.
IV. CONCLUSIONS
ZnB2O4: Eu3+, Tb3+ phosphors were successfully obtained by calcining of Zn[B3O3(OH)5]·H2O: Eu3+, Tb3+ precursor for the first time. The ZnB2O4: Eu3+, Tb3+ phosphor with maximum luminescent intensity was obtained by calcining Zn[B3O3(OH)5]·H2O: Eu3+, Tb3+ precursor at 900 °C for 6 h. The ZnB2O4: Eu3+, Tb3+ phosphor prepared by this method exhibits much stronger emission intensity than that synthesized by conventional high temperature solid-state method. Moreover, the introduction of Tb3+ ions successfully enhanced largely not only the emission intensity but also the color purity.
ACKNOWLEDGMENT
Project supported by National Natural Science Foundation of China (Nos. 21173143 and 21573142).