Introduction
Phospholipase C-ζ (PLC-ζ or PLCz) is expressed specifically in sperm and testis in many species (Young et al., Reference Young, Grasa, Coward, Davis and Parrington2009). Sperm penetration triggers a response in the oocyte that is mediated by a ‘spermatozoidal oocyte-activating factor’ (SOAF). PLC-ζ has been tentatively identified as SOAF (Saunders et al., Reference Saunders, Larman, Parrington, Cox, Royse, Blayney, Swann and Lai2002; Swann et al., Reference Swann, Larman, Saunders and Lai2004; Yoneda et al., Reference Yoneda, Kashima, Yoshida, Terada, Nakagawa, Sakamoto, Hayakawa, Suzuki, Ueda and Watanabe2006) as the absence of PLC-ζ or PLC-ζ mutation results in lack of oocyte activation (Yoon et al., Reference Yoon, Jellerette, Salicioni, Lee, Yoo, Coward, Parrington, Grow, Cibelli, Visconti, Mager and Fissore2008; Nomikos et al., Reference Nomikos, Elgmati, Theodoridou, Calver, Cumbes, Nounesis, Swann and Lai2011). PLC-ζ hydrolyzes phosphatidyl inositol 4,5-bisphosphate (PIP2) to generate two products: inositol 1,4,5-trisphosphate (IP3) that increases cytoplasmic calcium; and diacylglycerol (DAG), an activator of protein kinase C (PKC) (Yeste et al., Reference Yeste, Jones, Amdani, Patel and Coward2016). In addition, PLC-ζ coordinates oocyte movement shortly after gamete fusion (Swann et al., Reference Swann, Windsor, Campbell, Elgmati, Nomikos, Zernicka-Goetz, Amso, Lai, Thomas and Graham2012). Despite these processes, the exact process by which PLC-ζ is prepared for its role as SOAF is still unknown. (Nomikos et al., Reference Nomikos, Blayney, Larman, Campbell, Rossbach, Saunders, Swann and Lai2005).
In hamster and mouse sperm undergoing capacitation and the acrosome reaction, PLC-ζ migrates while undergoing post-translational modifications (Young et al., Reference Young, Grasa, Coward, Davis and Parrington2009). As capacitation advances, actin concentrates several proteins within the perinuclear theca (PT) (Howes et al., Reference Howes, Hurst and Jones2001). In addition, actin is involved in trafficking during the AR (Howes et al., Reference Howes, Hurst and Jones2001), therefore it was decided to determine whether, during bull sperm capacitation, actin cytoskeleton dynamics lead to PLC-ζ migration. PLC-ζ was relocated during capacitation, in addition PLC-ζ exhibited a higher affinity for monomeric actin than for filamentous, polymeric actin. Most importantly, PLC-ζ was partially liberated from capacitated or AR sperm, possibly to interact with the oocyte. Therefore, it is suggested that during capacitation changes in PLC-ζ–actin interactions are important for egg release and egg activation promoted by this phospholipase.
Materials and methods
Sperm preparation and sample collection
Fresh semen samples were obtained from three healthy bulls (Bos taurus, Jersey) from the Center for Practical Learning and Research on Animal Production and Health (CEPIPSA, UNAM). Three semen ejaculates from each bull were collected using an artificial vagina and kept at 35°C in triladyl-20% egg yolk. Sperm cells were washed three times at 3500 g for 8 min in NKM buffer (110 mM NaCl, 5 mM KCl, and 20 mM 3-N-morpholino propanesulfonic acid, pH 7.4). Only ejaculates that were determined to have normal semen parameters (80% viable and motile) were selected for the study.
Sperm capacitation and acrosome reaction
Spermatozoa (100 million/ml) were centrifuged at 800 g for 10 min at room temperature. The pellet was resuspended in TALP modified capacitation medium (TMCM: 100 mM NaCl, 3.1 mM KCl, 1.5 mM MgCl2, 0.92 mM KH2PO4, 25 mM NaHCO3, 20 mM HEPES, 0.1 mM sodium pyruvate, 6.21 mM sodium lactate, 50 mg/ml gentamycin, 1 mg/ml BSA, 20 µg/ml heparin and 2 mM CaCl2, pH 7.4), and then incubated for 4 h at 39°C in a 5% CO2 atmosphere and 100% relative humidity. The sample was divided into three groups: non-capacitated (NC), capacitated (C) and capacitated with AR (AR). The NC spermatozoa were taken at time 0, C spermatozoa were taken at 4 h and AR spermatozoa were taken at 4 h and incubated for 1 h with 1 µM calcium ionophore (Sigma, A23187). When indicated, actin polymerization was inhibited with 25 μM cytochalasin-D (CD) (Chiquete-Félix et al., Reference Chiquete-Felix, Hernández, Mendez, Zepeda-Bastida, Chagolla-López and Mujica2009) or 1 μM latrunculin (Azamar et al., Reference Azamar, Uribe and Mujica2007). Capacitation was evaluated by CTC-Hoechst 33258 staining (Fraser et al., Reference Fraser, Abeydeera and Niwa1995). All the experiments were made in triplicate.
Antibody specificity and validation
The specificity of the anti-PLC-ζ antibody was tested by immunoblotting against PLC-ζ, molecular weight (MW) 73.7 kDa (UniProt, 2016) (see later Fig. 3 A) and the antibody against actin was tested against actin (MW 43 kDa; Flaherty et al. Reference Flaherty, Winfrey and Olso1988) (see Fig. 3 A). The PVDF membranes were incubated overnight at 4°C with anti-PLC-ζ (1:500) diluted in blocking solution. Samples were incubated for 1 h with horseradish peroxidase (HRP) secondary antibody (Jackson ImmunoResearch, West Grove, PA, USA).
Immunocytochemistry
Sperm samples were spread on microscope slides, dried and fixed with 4% paraformaldehyde in phosphate-buffered saline (PBS) and incubated in Universal Blocking BioGenex HK085–5K (Milmont Drive, Fremont, CA, USA). The slides were washed with PBS. Endogenous peroxidase was inactivated (DakoCytomation, Glostrup, Denmark). Samples were incubated overnight at 4°C with primary antibodies: PLC-ζ (C-12) or Actin (H-6) (Santa Cruz Biotechnol, Inc.). Antigen–antibody complexes were detected using the avidin–biotin peroxidase method with 3,3-diaminobenzidine tetrahydrochloride as a chromogenic substrate and a Dako kit (cat. no. KO679 LSAB+Sys/HRP, DakoCytomation). Parallel samples were processed similarly without the primary antibody. Immunocytochemistry was conducted using an Olympus BX51 microscope.
Sperm protein extracts
To solubilize membranes and obtain sperm protein, we used protocols reported by Takiguchi et al. (Reference Takiguchi, Murayama, Kaneko, Kurio, Toshimori and Iida2011), Felipe-Perez et al. (Reference Felipe-Perez, Valencia, Juárez-Mosqueda, Pescador, Roa-Espitia and Hernández-Gonzalez2012) and de Lourdes Juárez-Mosqueda & Mujica (Reference de Lourdes Juárez-Mosqueda and Mujica1999). Briefly, sperm were resuspended in PBS at 100 × 106 cells/500 µl. Then, 3.75 mM dithiothreitol (DTT) was added and incubated on ice for 15 min. Next, an extraction buffer (50 mM Tris–HCl, pH 7.4, 1% NP-40, 0.75% SDS and 0.1 mM EDTA), plus protease inhibitor (Complete®) and phosphatase inhibitor (Phosphostop®) was added to the sperm suspension and then the mix was further incubated on ice for 5 min. The sample was adjusted to 1 ml and centrifuged at 11,140 g for 5 min, the supernatant was recovered and Phosphostop® and Complet® were added. Supernatants were concentrated in Amicon Ultra-10K Centrifugal filter units, Millipore™ and centrifuged at 4°C at 2264 g for 30 min. The protein concentration was determined (Bradford, Reference Bradford1976) and run by SDS-PAGE and western blotting (Oko & Maravei, Reference Oko and Maravei1994).
Immunoprecipitation
Protein A agarose (10 µl) was incubated with 10 µl anti-PLC-ζ (E-13; Santa Cruz Biotechnol, Inc.) 15 min at 4°C and 300 µg sperm protein extract was added. The mixture was agitated overnight at 4°C. Then, samples were washed twice at 1940 g for 6 min in PBS plus 1 mM PMSF and 0.1% Tween-20. Pellets were resuspended and boiled in 50 µl Laemmli's buffer (Laemmli, Reference Laemmli1970) and used for SDS-PAGE or western blots.
SDS-PAGE and western blotting
Samples were subjected to SDS-PAGE in 8% polyacrylamide (Moreno-Fierros et al., Reference Moreno-Fierros, Hernández, Salgado and Mujica1992). Samples were incubated overnight at 4°C with anti-PLC-ζ (1:500) diluted in blocking solution. Samples were incubated 1 h with HRP secondary antibody (Jackson Immuno Research, West Grove, PA, USA). Membranes were stripped for 20 min in (15 g glycine, 1 g SDS, 10 ml Tween-20/l, pH 2.2) and subjected to western blotting using anti-actin antibody (JLA20, Millipore, Billerica, MA, USA). HRP was revealed with an ECL kit from Amersham (Arlington Heights, IL, USA) (Chiquete-Felix et al., Reference Chiquete-Felix, Hernández, Mendez, Zepeda-Bastida, Chagolla-López and Mujica2009). Brain extract was used as a positive control (Katan & Parker, Reference Katan and Parker1987).
Quantification of F-actin
Samples were fixed in 1% paraformaldehyde for 30 min, washed twice by centrifugation at 2040 g for 5 min and resuspended in PBS. Five million cells were stained with 1.5 μM rhodaminated phalloidin. Fluorescence was measured at 540–590 nm in a BMG LABTECH POLARstar Omega spectrometer.
Far-western blotting
A Far-western blot assay was used to determine the interaction between PLC-ζ and actin. PLC-ζ peptide (sc-131 753-Pz; Santa Cruz Biotechnology; product now discontinued) was used as prey, F/G-actin as bait (Saba et al., Reference Sato, Kameya, Arai, Ishii and Igarashi2011) and controls were testicle extract and sperm extract. F/G-actin was obtained (Pardee & Spudich Reference Pardee and Spudich1982; Sato et al., Reference Sato, Kameya, Arai, Ishii and Igarashi2011). Samples were run on SDS-PAGE 8% and transferred to PVDF membranes. PVDF membranes were processed as described previously (Moreno-Fierros et al., Reference Moreno-Fierros, Hernández, Salgado and Mujica1992). Membranes were incubated for 12 h in blocking solution. The membrane was washed twice with TBS-T for 5 min, and was incubated for 3 h with 200 µg of F-actin or actin-G respectively. Washing was repeated and samples were incubated for 3 h with the appropriate primary antibody (actin or PLC-ζ) in 1% skimmed milk in TBS-T and then with the HRP-labeled appropriate secondary antibody. The interaction was revealed using a chemiluminescence ECL kit. The intensity of the obtained bands was analysed by densitometry.
Affinity chromatography for PLC-ζ
Cyanogen bromide-activated Sepharose beads was used following standard procedures. F-actin 6.9 mg was dissolved in coupling buffer (0.1 M NaHCO3 and 0.5 M NaCl, pH 8.3–8.5) and covalently attached to a cyanogen bromide-activated Sepharose column. Eluted proteins were pooled and concentrated in Amicon Ultra centrifugal filter units and centrifuged at 2264 g at 4°C, for 30 min. PLC-ζ was detected by western blot, and a silver-stained gel was used as loading control. Band intensity was analysed by densitometry. This procedure was realized for each experimental group.
Densitometry
Band intensity was quantified using a scanner and the Image J software version 1.46 (NIH, Bethesda, MD, USA) was performed to compare the differences between the bands for NC, C or AR; non-treated (NT) or treated with CD, F-actin and actin-G, as indicated, Differences were evaluated using GraphPad Prism Version 5 (GraphPad Software, Inc., La Jolla, CA, USA) using one-way analysis of variance (ANOVA) and Dunnett multiple comparison test.
Statistics
Data are the mean ± standard error of the mean (SEM) of at least three independent experiments. One-way ANOVA (multiple comparison test Dunnett) using GraphPad Prism Version 5 (GraphPad software, Inc., La Jolla, CA, USA) was used to compare the localization pattern of PLC-ζ/actin and the differences in PLC-ζ–actin concentrations at NC, C and RA and also in non-treated (NT) samples versus samples treated with CD.
Results and Discussion
PLC-ζ and actin localization in NC, C and AR sperm
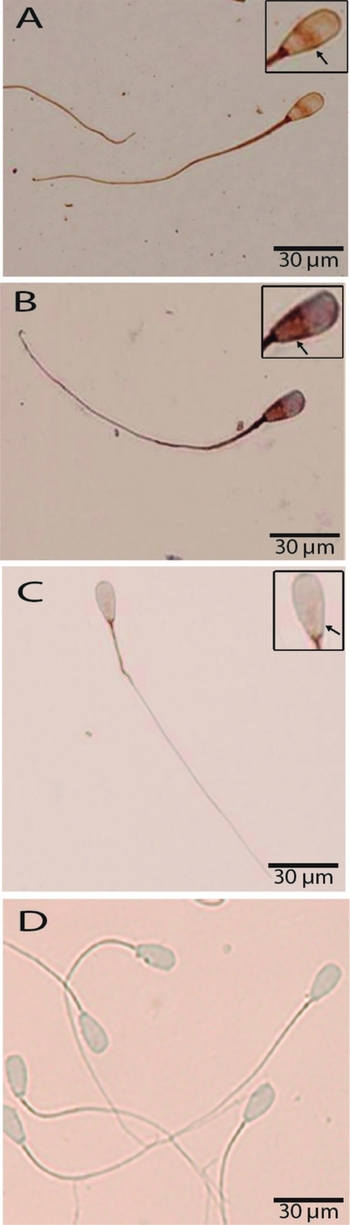
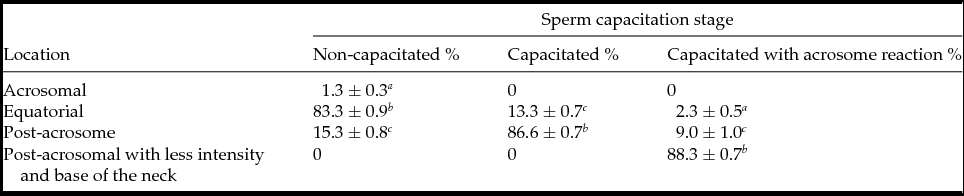
In NC sperm PLC-ζ was detected in the equatorial region (83.3 ± 0.9%) (Fig. 1 A and Table 1); while in C sperm PLC-ζ migrated to the post-acrosomal region (86.6 ± 0.7%) (Fig. 1 B and Table 1) and in the AR sperm PLC-ζ remained in the final region and was also detected at the base of the neck (88.3 ± 0.7%) (Fig. 1 C and Table 1). In addition, in all three stages PLC-ζ was present in the middle piece of the tail (Fig. 1 A–C). The negative control for anti-PLC-ζ is shown in Fig. 1 D. These results agree with those reported by Young et al. (Reference Young, Grasa, Coward, Davis and Parrington2009), who observed the migration of PLC-ζ in both mouse and hamster sperm during sperm capacitation and AR.
PLC-ζ migration in bull sperm in non-capacitated (NC), capacitated (C), and capacitated with acrosome reaction (AR). Immunocytochemistry showing the localization pattern of PLC-ζ (arrow in insets) during capacitation. (A) Non-capacitated spermatozoa (NC), PLC-ζ is found in the equatorial region. (B) Capacitated spermatozoa (C), PLC-ζ is found in the post-acrosomal region. (C) Capacitated with acrosome reaction spermatozoa (AR), PLC-ζ levels are decreased in the post-acrosomal region, increasing at the base of the neck. In all three states PLC-ζ exhibited an intense mark in the middle piece of the tail. (D) Negative control samples were processed without the primary antibody.

PLC-ζ distribution in non-capacitated, capacitated and capacitated with acrosome reaction bull sperm
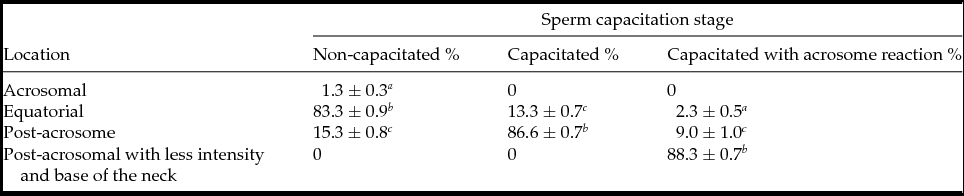
Values are the mean ± standard error of the mean (SEM) (n = 9).
a–c Means with different superscripts indicate significant difference with P ˂ 0.001.
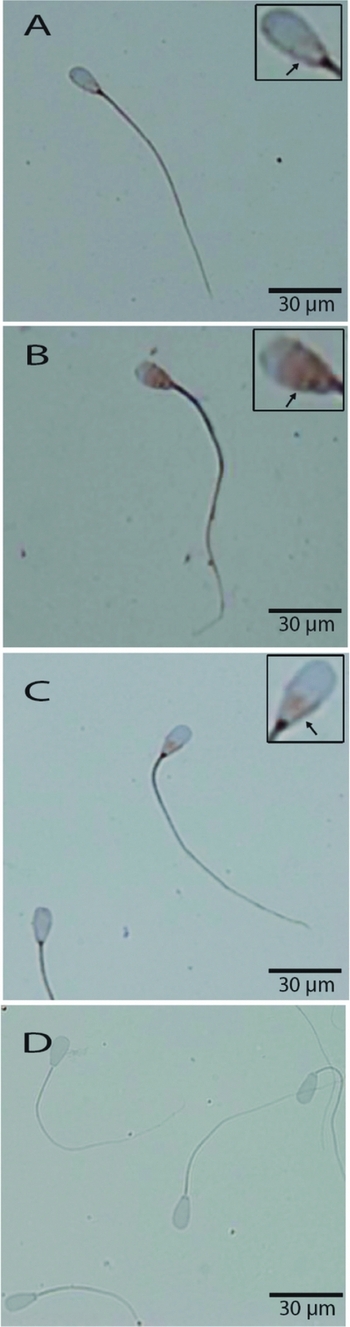
Actin migration occurs during capacitation and AR as a result of cytoskeletal dynamics (Breitbart et al., Reference Breitbart, Cohen and Rubinstein2005; Kierszenbaum et al., Reference Kierszenbaum, Rivkin and Tres2007; Jagan Mohanarao & Atreja, Reference Jagan Mohanarao and Atreja2011). In different species, in parallel to sperm capacitation, there is an increase in formation of F-actin, first in the mid-piece and later in the sperm head (Brener et al., Reference Brener, Rubinstein, Cohen, Shternall, Rivlin and Breitbart2003). We observed that actin migrated as follows: NC sperm exhibited labeling at the post-acrosomal region, in the base of the neck and middle piece of the tail (89 ± 0.6%) (Fig. 2 A and Table 2), in C sperm a more intense mark on the post-acrosomal region and middle piece of the tail was observed (90 ± 0.1%) (Fig. 2 B and Table 2). Nonetheless, in AR sperm a faint mark was observed at the base of the neck, in the middle piece of the tail and in the head (90 ± 0.7%) (Fig. 2 C). As the negative control, samples were processed in parallel without the primary antibody versus actin (Fig. 2 D). Thus, during capacitation both PLC-ζ and actin were localized in the middle piece of the tail, while in C sperm both proteins were found in the post-acrosomal region.
Actin localization in non-capacitated (NC), capacitated (C), and capacitated with acrosome reaction (AR) bull sperm. Using immunocytochemistry it was detected that actin migrated as follows. (A) NC, actin was detected at the post-acrosomal region (arrow in insert), the base of the neck and the middle piece of the tail. (B) C, actin was in the post-acrosome (arrow in insert) and middle piece of the tail. (C) AR, actin decreased in the post-acrosomal region and increased at the base of the neck (arrow in insets) and the middle piece of the tail. (D) As negative control, samples are processed without the primary antibody versus actin.

Actin distribution in non-capacitated, capacitated and capacitated with acrosome reaction bull sperm

Pal, less intense mark in post-acrosome; PAm, more intense mark in post-acrosome.
Values are the mean ± standard error of the mean (SEM) (n = 9).
a–c Means with different superscript indicates significant difference with P ˂ 0.001.
Actin dynamics and PLC-ζ interactions
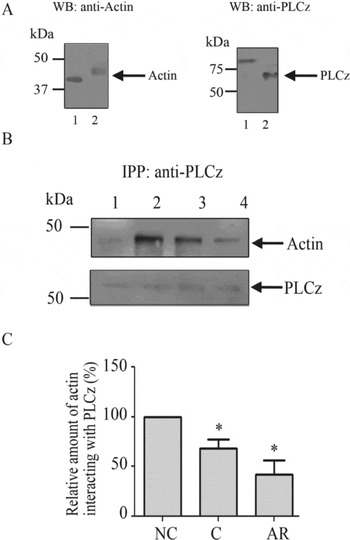
Immunocytochemistry data suggested that PLC-ζ and actin migrate together during capacitation, therefore it was decided to determine by immunoprecipitation if there was a physical interaction between PLC-ζ and actin in NC, C and AR spermatozoa. As seen in Fig. 3, PLC-ζ interacts with actin in all three capacitation stages. By densitometry it was determined that in NC PLC-ζ–actin interaction was high (100%), reaching only 68% in C spermatozoa and gradually decreasing as capacitation progressed, reaching 42% at AR spermatozoa.
Antibody specificity and validation, immunoprecipitation and densitometry of PLC-ζ–actin. (A) Antibody specificity by western blot identifying actin and PLC-ζ. In both blots, lane 1 shows testis extract and lane 2 is sperm extract. (B) Samples were immunoprecipitated using PLC-ζ antibodies. Lanes: (1) control sperm extract (100 µg); (2) non-capacitated (NC), (3) capacitated (C); and (4) capaciated with acrosome reaction (AR) spermatozoa. As indicated, blotting was made with actin and PLCz antibodies. (C) Densitometric analysis of the bands in (B). *Significant difference with P < 0.001.

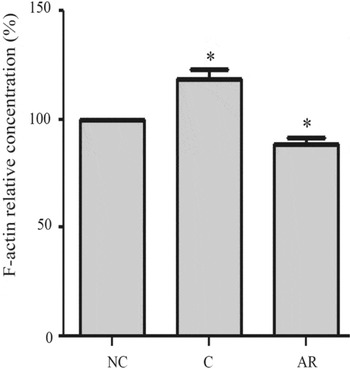
Once the actin/PLC-ζ interaction was demonstrated, we decided to determine the percentages of F-actin in the different physiological states of the sperm and then whether actin dynamics affects PLC-ζ association. We found that in capacitation F-actin increased to 18.25%, while in AR it decreased to 11.5% in comparison with NC (Fig. 4). These results suggest that PLC-ζ has less affinity for F-actin.
Percentage of relative concentration of F-actin in non-capacitated (NC), capacitated (C), and capaciated with acrosome reaction (AR) sperm. Experimental conditions as in Fig. 2. *Significant difference with P < 0.001.

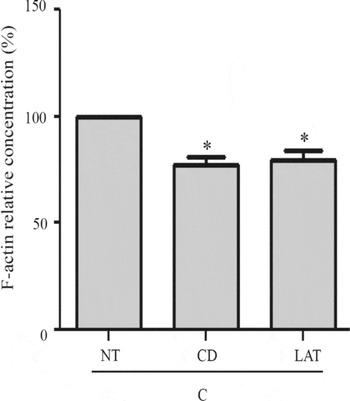
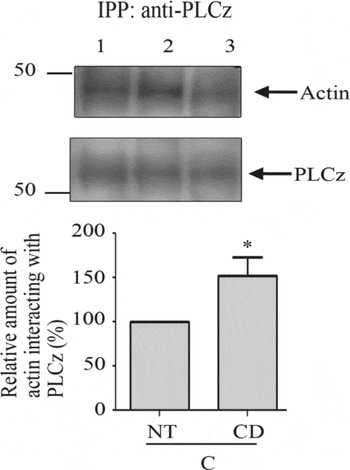
To demonstrate whether actin dynamics affect PLC-ζ association, we used actin depolymerizing agents such as CD or latrunculin during capacitation. First we measured F-actin concentrations (Fig. 5), which decreased to 23% when treated with CD and to 20.25% with latrunculin. In regard to the actin/PLC-ζ, association, it increased to 52.33% in CD-treated samples (Fig. 6). These results suggest that PLC-ζ interacts with G-actin rather that F-actin.
Percentage of F-actin concentration in C sperm. NT, untreated sperm; CD, sperm treated with cytochalasin-D; and LAT, sperm treated with latrunculin. *Significant difference with P < 0.001.

Detection of actin in the sperm extracts that were immunoprecipitated with anti-PLC-ζ antibody. Extracts obtained from capacitated (C) sperm with or without treatment with cytochalasin-D. (Top) Lane 1: C without cytochalasin-D; lane 2: C with cytochalasin-D; and lane 3: sperm extract. (Bottom) Densitometry showing the relative concentration of actin interacting with PLC-ζ with actin in C sperm. NT, non-treated control group; CD, treated with cytochalasin-D. *Significant difference with P < 0.001.

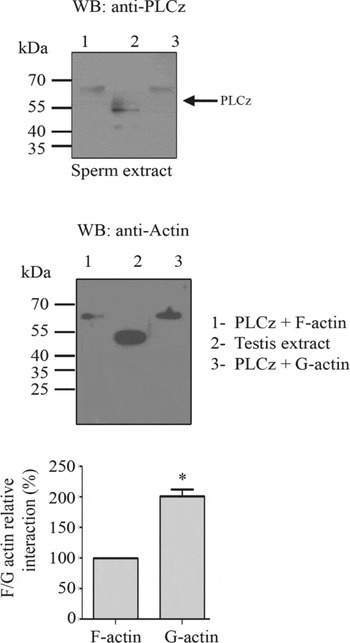
In order to further confirm that PLC-ζ has a high affinity for G-actin, globular or filamentous actin and PLC-ζ peptide were subjected to a far-western assay. The PLC-ζ interaction was twice as high with G-actin (201.66%) than with F-actin (100%) (Fig. 7). Before capacitation, different proteins co-localize with G-actin (Breitbart & Finkelstein, Reference Breitbart and Finkelstein2015) and relocation is necessary for capacitation. The high PLC-ζ/G-actin affinity we observed indicated that PLC-ζ is among these proteins and this interaction may be important for capacitation and the AR.
Far-western blot of PLC-ζ revealed with PLCz and actin. (Top/Middle) Western blot shows the sperm extract control used for PLC-ζ. Lane 1: peptide of PLC-ζ with F-actin; lane 2: control extract; and lane 3: PLC-ζ peptide with G-actin. (Bottom) Graph depicts densitometry showing the relative interaction of PLC-ζ with F-actin or G-actin. *Significant difference with P < 0.001.

Release of PLC-ζ to the supernatant
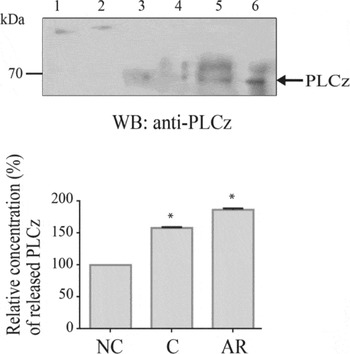
If PLC-ζ is SOAF, then it would have to exit sperm in order to interact with the egg. In this regard, the existence of two populations of PLC-ζ has been proposed, in which one might be released during capacitation and AR (Fujimoto et al., Reference Fujimoto, Yoshida, Fukui, Amanai, Isobe, Itagaki, Izumi and Perry2004). Furthermore, PLC-ζ is found in both soluble and insoluble fractions in the sperm head of hamster and mouse, in which the ability to induce Ca2+ oscillations in the oocyte depends on solubility (Kashir et al., Reference Kashir, Nomikos, Lai and Swann2014). It was observed that G-actin decreased during capacitation, so it was decided to test whether PLC-ζ exits the cell at any capacitation stage. As capacitation progressed, extracellular PLC-ζ increased in the supernatant (Fig. 8), as follows: in NC it was 100% and then in C it was 158%, and in AR it was 186.5%. In Fig. 8, most lanes show the band at the expected weight for PLCz plus a slightly heavier band that may be a phosphorylation product as suggested previously by others (Bernabó et al., Reference Bernabó, Berardinelli, Mauro, Russo, Lucidi, Mattioli and Barboni2011). Thus, upon capacitation and AR it was demonstrated that while PLCz decreases in the pellet (Fig. 3) it increases in the supernatant (Fig. 8).
Western blot identifying PLC-ζ in the supernatants after the isolation procedure by affinity chromatography. (Top) Western blot shows the different controls for PLC-ζ: (1) brain extract, (2) testis extract, (3) supernatant non-capacitated sperm, (4) supernatant capacitated sperm, (5) supernatant capacitated sperm with acrosome reaction, and (6) sperm extract. (Bottom) Densitometry showing the percentage of relative PLC-ζ released. Lane 3 was defined as 100% and thus lane 4 was 154% and lane 5 was 186%. *Significant difference with P < 0.001.

Co-migration of PLC-ζ and actin during capacitation was demonstrated. In NC sperm, the affinity is the highest, although each protein seems to be in a different compartment, except for the middle piece of the flagellum, in which both proteins remain at all times. Then, in C sperm both proteins are found in the post-acrosomal region and then they decrease in affinity as AR is reached. Furthermore, in this late capacitation stage, PLC-ζ is liberated from sperm, probably as a strategy to reach the egg. In regard to the identity of SOAF, we cannot discard other proteins such as the post-acrosomal-WWP-domain-binding protein (PAWP), which participates in the interaction between sperm and the oocyte (Aarabi et al., Reference Aarabi, Blakier, Bashar, Moskovtsev, Sutovsky, Librach and Oko2014). PAWP injection to oocytes from different species activates meiosis (Aarabi et al., Reference Aarabi, Qin, Xu, Mewburn and Oko2010, Reference Aarabi, Blakier, Bashar, Moskovtsev, Sutovsky, Librach and Oko2014; Kennedy et al., Reference Kennedy, Krieger, Sutovsky, Xu, Vargovič, Didion, Ellersieck, Hennessy, Verstegen and Oko2014).
Acknowledgements
We thank Javier Hernández Ignacio for providing the biological samples and for his technical assistance, Emilio Francisco López for his collaboration in the histological preparations, Rosa María Vigueras Villaseñor for her assistance in microscopy techniques.
Financial support
IMF is a PhD student at Facultad de Medicina Veterinaria y Zootecnia (FMVZ) and a recipient of a fellowship from CONACYT (298283): partially funded by CONACYT (239487) and UNAM-DGAPA-PAPIIT (IN204015 and IN219717).
Statement of interest
The authors declare that there is no conflict of interest that could be perceived as prejudicing the impartiality of the research reported.
Ethical standards
The authors assert that all procedures handling animals in this study comply with the ethical standards of the ‘Committee for Care and Use of Experimental Animals’ at FMVZ/UNAM (CICUAE), based on NOM-062-ZOO-1999.