Implications
The results of the present study showed that although there was an acutely stressful effect of fostering piglets onto nurse sows none of the nurse sow strategies investigated had a long-term detrimental effect on sow stress, lesions or body condition. This implies that when nurse sows are selected in good body condition, with a proven rearing ability, they can be used as part of a strategy to optimise the number of piglets weaned. Further studies using larger sample sizes and investigating other aspects of animal welfare (e.g. affective states) are needed to conclude on sow welfare.
Introduction
Genetic selection for large litters has resulted in large numbers of piglets being born alive; the European average increased by 18% between 2006 and 2016 (i.e. from 11.7 to 13.8 piglets born alive; data provided by Agricultural and Horticultural Development Board (AHDB) Pork’s InterPIG reports (BPEX, Reference Amdi, Moustsen, Oxholm, Baxter, Sørensen, Eriksson, Diness, Nielsen and Hansen2007; AHDB Pork, 2017). However, large litters (⩾14 piglets) represent potential challenges to the welfare of both piglets and sows (Rutherford et al., Reference Rutherford, Baxter, Ask, Berg, D’Eath, Jarvis, Jensen, Lawrence, Moutsen, Robson, Thorup, Turner and Sandoe2013). One of the first consequences is that the number of piglets born alive may outnumber the number of functional teats. This can lead to a high level of fighting at the udder, reduced milk intake for the piglets, and sows being exposed to greater levels of teat fights and being more at risk of getting udder injuries (Rutherford et al., Reference Rutherford, Baxter, Ask, Berg, D’Eath, Jarvis, Jensen, Lawrence, Moutsen, Robson, Thorup, Turner and Sandoe2013). Therefore, management strategies to deal with large litters are needed to optimise survival and growth of all the piglets born into large litters and to reduce the risk of injury and stress for the sow. Cross-fostering is a commonly used management procedure which involves homogenising litters of sows that farrowed in the same period of time (i.e. batch farrowing) by fostering extra piglets from large litters (i.e. over 14 piglets born alive) to smaller litters (i.e. up to 12 piglets born alive), where functional teats are available (e.g. Milligan et al., Reference Milligan, Fraser and Kramer2001; Heim et al., Reference Heim, Mellagi, Bierhals, de Souza, de Fries, Piuco, Seidel, Bernardi, Wentz and Bortolozzo2012). However, the ability to cross-foster can be limited when most of the sows in a batch give birth to large litters as there are fewer sows available onto which supernumerary piglets from large litters can be fostered. An alternative method to deal with large and very large litters involves fostering supernumerary piglets from several sows to a single ‘nurse sow’ that has just weaned her piglets (Baxter et al., Reference Bonde, Rousing, Badsberg and Sørensen2013).
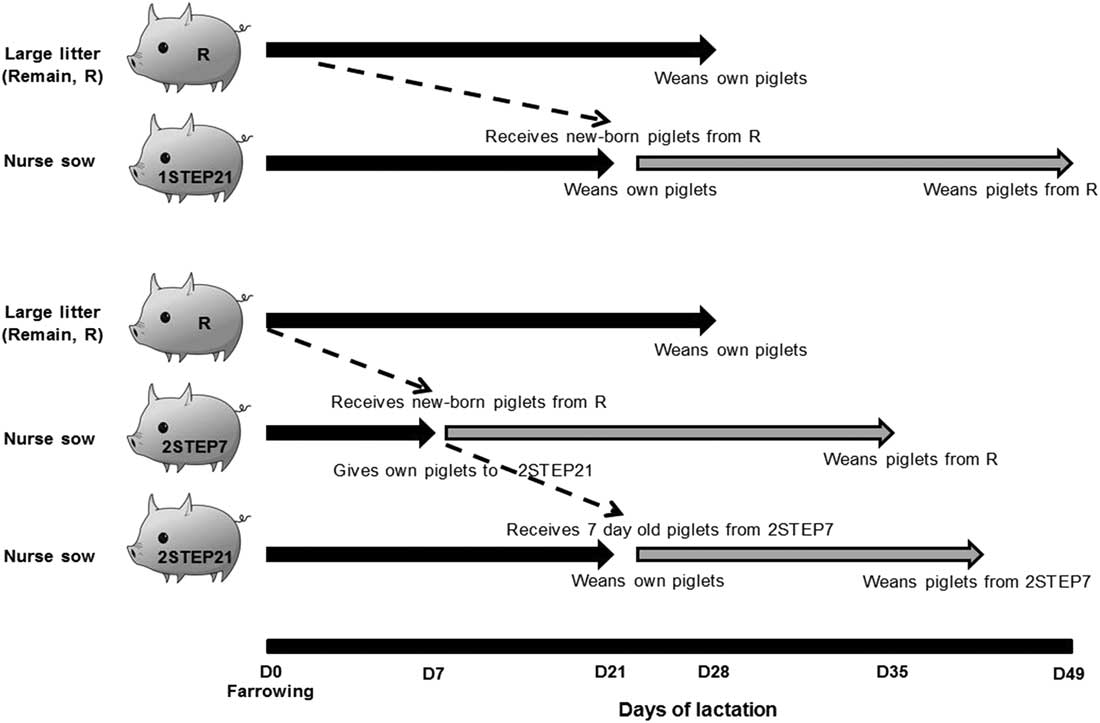
There are a variety of strategies (reviewed by Baxter et al., Reference Bonde, Rousing, Badsberg and Sørensen2013). One is called the ‘one-step nurse sow strategy’ (one-step strategy), whereby a nurse sow receives supernumerary new-born (i.e. approximately 24 h-old) piglets (foster piglets) from large litters on the day she weans her biological piglets, which are usually 21-days-old. In this case, the nurse sow remains in the farrowing crate for an additional 3 to 4 weeks to feed the foster piglets. Another strategy is called the ‘two-step nurse sow strategy’ (two-step strategy) or ‘cascade fostering’ (Baxter et al., Reference Bonde, Rousing, Badsberg and Sørensen2013). This involves moving new-born piglets from large litters to a sow whose 4- to 7-day-old piglets are fostered to another, second, nurse sow which weaned her own piglets at 21-days-old. In this strategy, both of the nurse sows remain in the farrowing crate for an additional 3 to 4 weeks to nurse their new litters.
The use of nurse sows is a promising management strategy because the absence of the sows’ biological piglets means there is likely to be reduced competition and aggression at the udder, as well as possibly reduced aggression of the sow towards alien piglets; these are the main problems reported with standard cross-fostering strategies (Reese and Straw, Reference Reese and Straw2006). However, because nurse sows are confined in the farrowing crate for a longer period of time (i.e. up to 7 weeks in the one-step strategy (not including the pre-farrow period; Baxter et al., Reference Bonde, Rousing, Badsberg and Sørensen2013)) than the standard (4 weeks post-farrowing), this may represent a negative experience for the sow, and result in health and welfare impairments (Sørensen et al., Reference Sørensen, Rousing, Kudahl, Hansted and Pedersen2016). For instance, rearing an additional litter could increase the loss of body condition (as measured by back fat thickness) in nurse sows, and thus compromise their subsequent reproductive abilities (De Rensis et al., Reference DeBoer, Garner, McCain, Lay, Eicher and Marchant-Forde2005). In addition, claw, shoulder and leg problems can arise from long-term confinement; in particular, shoulder sores can develop as a result of poor body condition and long or repeated lying periods (Jensen, Reference Jensen2009). Furthermore, there is the possibility of psychological stress associated with repeated separations from the piglets that the sow has reared, and with extended period of confinement in the farrowing crate. However, although early work by Cronin et al. (Reference Cronin, Barnett, Hodge, Smith and McCallum1991) showed increased levels of cortisol, that is stress, levels in sows confined in crates for longer than 28 days, Amdi et al. (Reference Anil, Anil and Deen2017) found no evidence of long-term stress, that is no elevation in cortisol levels, in nurse sows. Salivary cortisol is a validated measure of stress in animals but its collection implies that animals have to be habituated to the procedure beforehand to minimise stress or arousal from the close presence of humans. Thus, non-invasive techniques such as tear staining are of interest for the evaluation of stress (DeBoer et al., Reference De Rensis, Gherpelli, Superchi and Kirkwood2015). As well as impairing welfare, these problems may reduce the sows’ productive life (e.g. culled for lameness or decreased reproductive performance) and should thus be taken into account when evaluating the costs and benefits of nurse sow strategies. These welfare issues are of concern for the economics of pig production and were listed in the report by Rutherford et al. (Reference Rutherford, Baxter, D’Eath, Turner, Arnott, Roehe, Ask, Sandøe, Moustsen, Thorup, Edwards, Berg and Lawrence2011), which evaluated the ethical and welfare implications of large litter size on sows and piglets.
This study aimed to assess the effects of two nurse sow strategies (one-step v. two-step strategy) on selected measures of sow welfare. These strategies were compared with the effects of cross-fostering and keeping a litter intact for the whole lactation. The main hypothesis was that both nurse sow strategies would decrease sow health and increase cortisol levels, compared with sows with a normal lactation length.
Material and methods
Animals and experimental design
This experiment was conducted on a commercial farm in Co. Cork, Ireland, with a herd size of 300 sows, from June to December 2015; and involved a total of 47 sows and 596 piglets. Sample size was based on power calculation (SAS 9.4) as well as using guidance from previous work with similar aims to measure nurse sow welfare (e.g. Amdi et al., Reference Anil, Anil and Deen2017). The genetic background of the sows was Large White × Landrace. The parity of experimental sows was 4.2 (±0.58).
Over a 19-week period 14 sows (c. day 110 of gestation) were moved from the gestation housing to the farrowing rooms on each Wednesday. Throughout gestation, sows were loose-housed in groups of six on concrete slatted floors, with feed administered once a day in a voluntary sow stalls system. Farrowing was not induced and occurred the following week between Monday and Friday. Piglets were born in conventional farrowing pens (2.7×1.7 m; sow crate: 2.25×0.64 m) equipped with a heated mat on each side of the pen (1.55×0.37 m; maintained at 30°C). No straw or bedding was provided to the sows or piglets. Farrowing rooms were ventilated through fan chimneys (negative pressure principle) and temperature was maintained at 23°C until the last farrowing and then lowered to 20°C until weaning. Each week, a single large litter (14 or more piglets born alive) was selected for the experiment. Litter size was the only selection criterion, although lame sows or sows with a poor body condition were not selected. Only one gilt was recruited in the trial. The heaviest (1.8±0.04 kg) piglets from this litter were fostered at 1 day of age onto a nurse sow so that 12 piglets remained in the litter. Selection of foster piglets was balanced for sex. On average, 4.1 (±0.60) piglets per large litter were fostered (Figure 1). The sows from which the piglets were removed (R) were either left with the remainder of the litter intact (I) (remain intact (RI) sows, n=10), or had their litters equalised (E) for birth weight using piglets of the same age from non-experimental sows (remain equalised (RE) sows, n=9). Approximately two (1.9±1.10) piglets were removed/added to these litters, with the final number remaining with all R sows being 12 piglets. This treatment represents typical cross-fostering practice whereby litter sizes are standardised to ensure weight homogeneity during lactation with the aim of lowering the risk of small piglets dying. Fostering took place at 1400 h. Nurse sows were recruited on the criteria of their rearing capacity (i.e. at least 12 healthy piglets alive at the moment of selection) and for being in good body condition, which was visually appraised by farm staff based on standard body condition score with 1 to 5 scale of increasing condition (Muirhead and Alexander, Reference Muirhead and Alexander1997). Gilts were not considered in the selection. At fostering, nurse sows were moved from their original crate to a crate in the room where the piglets to be fostered had been born. Every 2nd week either a ‘one-step’ or a ‘two-step’ nurse sow strategy was applied to the piglets that were removed, and either the intact or equalised strategy was applied to the sows from which they were removed (i.e. R sows). Thus, there were five treatments in the study: RI, RE, one-step nurse sow strategy (1STEP21), and two-step nurse sow strategy (2STEP7 and 2STEP21).
Schematic representation of the ‘one-step’ and ‘two-step’ nurse sow strategies as used in the present study.

One-step nurse sow strategy
Piglets were weaned from a sow which was 21 days into lactation (1STEP21, n=10) at 1200 h. Following weaning, the sow was moved to an empty crate in the farrowing house of R sows. After 2 h (1400 h), a total of 12 1-day-old piglets were introduced to the pen. Approximately four of these piglets (4.3±0.50) were obtained from either RI or RE sows, depending on the strategy being applied that week. Additional piglets were obtained from non-experimental sows (Figure 1).
Two-step nurse sow strategy
At 1200 h, a sow which was 7 days into lactation (2STEP7, n=9) was moved to an empty crate in the farrowing house of R sows. After 2 h without any piglets (1400 h) a total of 12 1-day-old piglets were introduced to the pen. Approximately four piglets (3.8±0.67) were obtained from either RI or RE sows, as before, and additional piglets were obtained from non-experimental sows (Figure 1). Following the moving of 2STEP7 sow (i.e. 1200 h), a nurse sow 21 days into lactation (2STEP21, n=9) was immediately moved from her crate to the crate of 2STEP7 sow. Thus, 2STEP21 immediately received the 12 piglets from 2STEP7 sow (Figure 1). Piglets from 2STEP21 were weaned.
Nutrition
All diets used were formulated and milled on the commercial farm. During lactation sows were fed twice a day (0920 and 1640 h) with a diet containing 18.18% protein, 14.16 MJ/kg digestible energy (DE) and 10.05 MJ/kg net energy (NE). Sows had access to water through nipple drinkers placed in their feeder. The amount of feed received gradually increased from 35 MJ/day (2.5 kg) on the day of farrowing to 112 MJ/day (7.9 kg) at day 30 of lactation (+400 g/day between days 0 and 12; +300 g/day between days 12 and 14; +100 g/day between days 14 and 18; stable until day 30). Nurse sow diets were not re-adjusted, thus they kept receiving the same amount of feed as before fostering. Sows were also supplemented with calcium and magnesium in their feed once a day from 110 days of gestation until farrowing.
Piglets received creep feed in their pen from 16 days of age, which contained 17.64% protein, 14.65 MJ/kg DE and 10.30 MJ/kg NE.
Measurements
Back-fat thickness
Sow back-fat thickness was measured at entry to the farrowing house, the day of fostering (for nurse sows) and weaning (i.e. removal from the farrowing house), using the Piglog 015 (version 3.1; Carometec®, Soeberg, Denmark) back-fat scanner. Back-fat thickness was measured at two locations on both sides of the body: the P2 spot (last rib, 6.5 cm down the dorsal middle line) and 10 cm from last rib, 7 cm down the dorsal line.
Lesions
All sows were scored for body, claw, udder, shoulder and limb lesions when they entered the farrowing house, on the day of fostering (nurse sows) and at weaning. Details of each scoring scale used can be found in Supplementary Material Tables S1, S2, S3, S4 and Figure S1. Body lesions were scored on the flanks and hind quarters as per Calderón Díaz et al. (Reference Calderón Díaz, Fahey and Boyle2014), based on the size and deepness of lesions, on a scale ranging from 0 (i.e. no lesion on the sow’s body) to 5 (i.e. presence of ‘many very big, deep, red lesions’). Overall body score was calculated by summing all scores (i.e. range 0 to 20). Both claws on each hind hoof were scored for six different types of lesion (score of 0 to 4 for each), using a scale developed by FeetFirst™ (Zinpro Corp., Eden Prairie, MN, USA) as modified by Calderón Díaz et al. (Reference Calderón Díaz, Fahey and Boyle2014) (see Table 1) and the overall claw score was considered the sum of all scores from both feet (range 0 to 144). Both sides of the udder was scored for presence (score 1) or absence (score 0) of scratches (i.e. superficial skin lesion) and wounds (i.e. deep circular opening of the skin, with presence of fresh or dry blood), and, again, the overall score was considered the sum of all scores (range 0 to 4). Limb lesions were scored for each limb of the sow following the modified scale of de Koning (1985) (Boyle et al., 2000), which ranged from 0 (normal) to 5 (severe wounds plus severe swellings). The presence of alopecia, swellings, wounds and severe wounds on sows’ legs represented intermediate scores (1 to 4, respectively; overall limb score had a range of 0 to 20). Finally, the 6-point scale graduating the development of shoulder sores (0=healthy skin to 5=very serious lesion involving the scapula bone) from Ocepek et al. (Reference Ocepek, Andersen-Ranberg, Edwards, Fredriksen, Framstad and Andersen2016) and Fredriksen et al. (Reference Fredriksen, Benan and Karlsen2015) was used to assess each of the sows shoulders, and the overall shoulder score calculated as the sum of both sides (range 0 to 10).
Scoring system and description of the six different sow claw lesion scores developed by FeetFirst™ as modified by Calderón Díaz et al. (Reference Calderón Díaz, Fahey and Boyle2014)

Lameness
Lameness was assessed by scoring the gait (0=even steps to 5=does not move) of each sow as they walked along a solid concrete passageway on her way to (entry) or from (weaning) the farrowing rooms using a 6-point scale (as per Calderón Díaz et al., Reference Calderón Díaz, Fahey and Boyle2014). Nurse sows were also scored when they were moved between crates on the day of fostering.
Salivary cortisol
Saliva samples were collected from all sows at 0900 h, 36 to 48 h after confinement in the farrowing crates (i.e. on Friday) and every subsequent Friday at 0900 h (weekly measurements) until removal from the farrowing house. This was to assess cortisol levels relative to duration of confinement in the farrowing crate. In addition, to assess the immediate effects of fostering, saliva was collected on the day preceding fostering (at 0900, 1200 and 1400 h), on the day of fostering at 0900 h, immediately before and after fostering (1400 h for 1STEP21 and 2STEP7, 1200 h for 2STEP21), and 1, 2, 4 h after fostering. Saliva was also collected 24 h, 7, 14, 21 and 28 days after fostering, and at weaning, to assess longer term effects of fostering. Saliva was collected by allowing sows to chew on a large cotton bud (Salivette, Sarstedt, Wexford, Ireland) until it was thoroughly moistened (30 to 60 s/sample). Buds were placed in a tube and centrifuged for 5 min at 3000×g, then stored at −20°C until analysis. Saliva samples were analysed using ELISA (Salivary Cortisol Kit; Salimetrics Europe Ltd, Suffolk, UK). The minimum detectable concentration of cortisol that could be distinguished from 0 was<0.003 µg/dl. The intra-assay %CV was 21.4±3.80 and the inter-assay %CV was 20.7±8.8.
Tear staining
Tear staining (i.e. chromodacryorrhoea) is the amount of porphyrin secreted by the eyes. The extent of staining around the sows’ left and right eyes was scored using a similar method of scoring to DeBoer et al. (Reference De Rensis, Gherpelli, Superchi and Kirkwood2015) (Table 2). However, sows’ eyes were not washed before scoring. Scoring of tear staining was done at the same time that saliva was collected at 24 h after assignment to the farrowing house, and thereafter every Friday. As there was no difference between sides, scores of both eyes were averaged for analysis.
DeBoer–Marchant–Forde descriptive scale used for scoring the tear staining of sows (DeBoer et al., Reference De Rensis, Gherpelli, Superchi and Kirkwood2015)

Statistical analyses
Statistical analysis was performed using SAS 9.4 (SAS Institute Inc., Cary, NC, USA). The experimental unit for the analysis was the individual sow. General linear models and generalised linear mixed models were fitted by Residual Pseudo Likelihood approximation method for models of non-normal data, with appropriate link functions and error structures depending on the nature of the response variable. Statistically significant terms were determined when α level was below 0.05, tendencies were considered when α level was between 0.05 and 0.1. Results are presented as means±standard error.
Back-fat thickness data were considered normally distributed with regards to the distribution of their residuals. They were analysed using GLM (PROC MIXED) which accounted for the repeated effect of time within sow (autoregressive structure). Lesion scores were analysed using Kruskal–Wallis non-parametric test (PROC NPAR1WAY). Dwass, Steel, Critchlow-Fligner method was used to perform pair-wise comparisons between treatments. Effects of time and treatment on the lesion scores were investigated separately.
Salivary cortisol concentration data were considered normally distributed with regards to the distribution of their residuals. Data were analysed in three separate ways using GLMs (PROC MIXED) and the random effect of plate (i.e. each Elisa plate) and the repeated effect of time within sow were taken into account. The first analysis aimed to investigate cortisol levels over time relative to duration in the farrowing crate (weekly analysis) using the samples collected each Friday for every sow. In this model, parity was included as a covariate. The second analysis compared the acute effects of fostering between nurse sows using data collected at different time points on the day of fostering. To account for individual differences, the salivary cortisol concentrations measured on the day before fostering were averaged per sow and included as a covariate in the analysis. The final analysis considered the longer-term effects of fostering on nurse sows, using the samples collected at 0900 h on the day before fostering, the day of fostering, then 24 h, 7, 14, 21 and 28 days after fostering.
Tear staining scores of each eye were analysed, as well as the average score for both eyes. Data were normally distributed, with regards to the residuals, therefore analysis was performed using GLM (PROC MIXED) which accounted for the random effect of replicate and the repeated effect of time within sow. Correlation between tear staining and salivary cortisol was investigated using Spearman rank-order correlation coefficient (PROC CORR).
In all analyses, the effect of parity was also investigated. Parity influenced salivary cortisol data collected weekly from entry to the farrowing house (P<0.05) and strongly tended to influence back-fat thickness data (P<0.06). Thus, it was kept in these models but not in others.
Results
Treatment was associated with different times spent in the farrowing crate post-parturition (Table 3). Remain intact and RE sows spent a similar duration of time in the crates, approximately 4.6 weeks, whereas 2STEP7, 2STEP21 and 1STEP21 spent more time in the crate (approximately 5.4, 7 and 8 weeks, respectively). Although sows were not selected on the criterion of parity number, the average parity did not differ between treatments (Table 3). One gilt (parity 1) was included in the study (RI sow), two sows were of parity 7 (RI sows) and two sows were of parity 8 (one 2STEP7 sow and one 2STEP21 sow).
Number of individuals, average parity and average lactation length of sows which reared one litter (remain intact (RI) and remain equalise (RE)) and of nurse sows which reared their own litter for 1 week (2STEP7) or for 3 weeks (1STEP21 and 2STEP21) before they reared a foster litter for a further 4 weeks

RI sows were left with their own (biological) litter throughout lactation and RE were left with a mixture of their own and fostered piglets for lactation.
a,b,c,dDifferent superscript letters indicate differences between the treatment groups at a confidence level of 95% (P<0.05).
1 This does not include the pre-farrow period in the crate which averaged 5 days.
2 RI sows farrowed large litters and remained with an intact litter of 12 piglets after transfer of heavier piglets to nurse sow 1STEP21 or 2STEP7.
3 RE sows farrowed large litters and remained with an equalised litter of 12 piglets (mixture of own and fostered piglets) after transfer of heavier piglets to nurse sow 1STEP21 or 2STEP7.
4 1STEP21 sows received 1-day-old piglets from large litters when they were 21 days into lactation.
5 2STEP7 sows received 1-day-old piglets from large litters when they were 7 days into lactation.
6 2STEP21 received 7-day old from 2STEP7 when they were 21 days into lactation.
Back-fat thickness
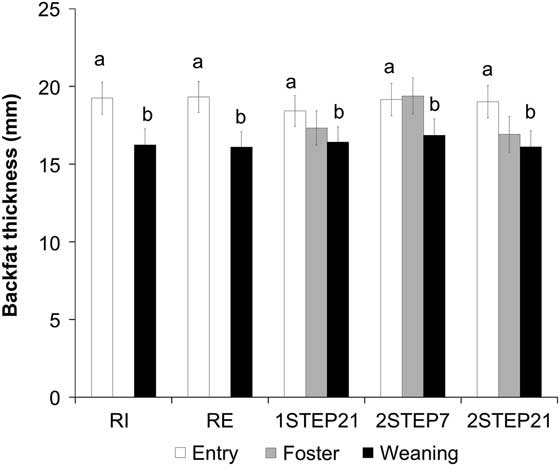
All sows lost back-fat thickness between entry to the farrowing house and weaning (on average 19.0±0.44 mm v. 16.3±0.44 mm; P<0.001; Figure 2). For all nurse sows (1STEP21, 2STEP7 and 2STEP21), the loss of back-fat thickness was significant between entry to the farrowing house and weaning of the fostered litter (P<0.05) but was only numerically different between entry to the farrowing house and fostering and between fostering and weaning (Figure 2).
Back-fat thickness (mm) at entry to the farrowing house, on the foster day and at weaning for sows that had a normal lactation length (4.6±1.30 weeks, remain intact (RI) and remain equalised (RE) sows), and nurse sows that had lactation lengths of 5.4±0.10 weeks (2STEP7), 7.0±0.10 weeks (2STEP21) and 7.9±0.10 weeks (1STEP21), respectively. a,bIndicate differences between bars at a confidence level of 95% (P<0.05).

Lesions and lameness
There were no effects of time or treatment on shoulder lesion scores (P>0.05, Table 4). There were no effects of treatment on lameness scores and body, claw and shoulder lesion scores at entry to the farrowing house (P>0.05, Table 4). At weaning, there was a treatment effect on limb lesion score (χ 2 4=10.8, P<0.05) and a tendency for an effect on udder lesion scores (χ 2 4=8.9, P=0.06; Table 4). Between entry to the farrowing house and weaning, there was a decrease in body lesion scores for 2STEP7 sows (χ 2 1=4.3, P<0.05) and RE sows (χ 2 1=7.9, P<0.005), and in claw lesion scores for 2STEP21 sows (χ 2 1=4.7, P<0.05; Table 4). Inversely, there was an increase in limb lesion and lameness scores for 2STEP7 (χ 2 1=5.6 and χ 2 1=5.9, respectively; P<0.05) and a tendency for an increase in udder lesion score of RE sows (χ 2 1=3.3, P=0.07; Table 4).
Mean (±standard error of the mean) lesion (body (0=no lesion to 5=severe lesions), claw (0=no lesion to 3=severe lesion), shoulder (0=no lesion to 5=very serious lesion), limb (0=no lesion to 5=severe lesions), udder (0=no lesion to 2=lesions on both sides)) and shoulder (0=no lesion to 5=severe lesion), and lameness (0=not lame to 5=extremely lame) scores of sows at entry to the farrowing house (EntryFootnote 1 ) and at weaning

a,bSignificant difference at P<0.05 between treatment groups.
*Significant difference at P<0.05 between days within one treatment.
1 Entry to the farrowing house, sows were approximately at day 110 of gestation.
2 RI sows farrowed large litters and remained with an intact litter of 12 piglets after transfer of heavier piglets to nurse sow 1STEP21 or 2STEP7 (lactation length: 4.6 weeks).
3 RE sows farrowed large litters and remained with an equalised litter of 12 piglets (mixture of own and fostered piglets) after transfer of heavier piglets to nurse sow 1STEP21 or 2STEP7 (lactation length: 4.6 weeks).
4 1STEP21 sows received 1-day-old piglets from large litters when they were 21 days into lactation (lactation length: 8 weeks).
5 2STEP7 sows received 1-day-old piglets from large litters when they were 7 days into lactation (lactation length: 5.4 weeks).
6 2STEP21 received 7-day old from 2STEP7 when they were 21 days into lactation (lactation length: 7 weeks).
Salivary cortisol
Weekly cortisol level
Salivary cortisol concentration was affected by time (F 7,248=4.59, P<0.001) as it was higher on the farrowing week compared with all other lactation weeks (F 1,275=25.64, P<0.001). Over the entire time spent in the farrowing crates (i.e. different durations), 2STEP7 sows had a higher cortisol concentration than RE sows (0.12±0.100 v. 0.08±0.010, respectively; P<0.05). However, there was no difference between sows with a normal lactation length (i.e. RI and RE) and sows with almost twice the length of normal lactation (i.e. 1STEP21 and 2STEP21) (F 1,99.2=0.03; P>0.05). At weaning, there was no effect of treatment on salivary cortisol concentrations (F 4,48.2=0.12; P>0.05), which ranged from 0.21 (±0.050) µg/dl for 2STEP21 to 0.24 (±0.060) µg/dl for RE.
Acute effects of fostering
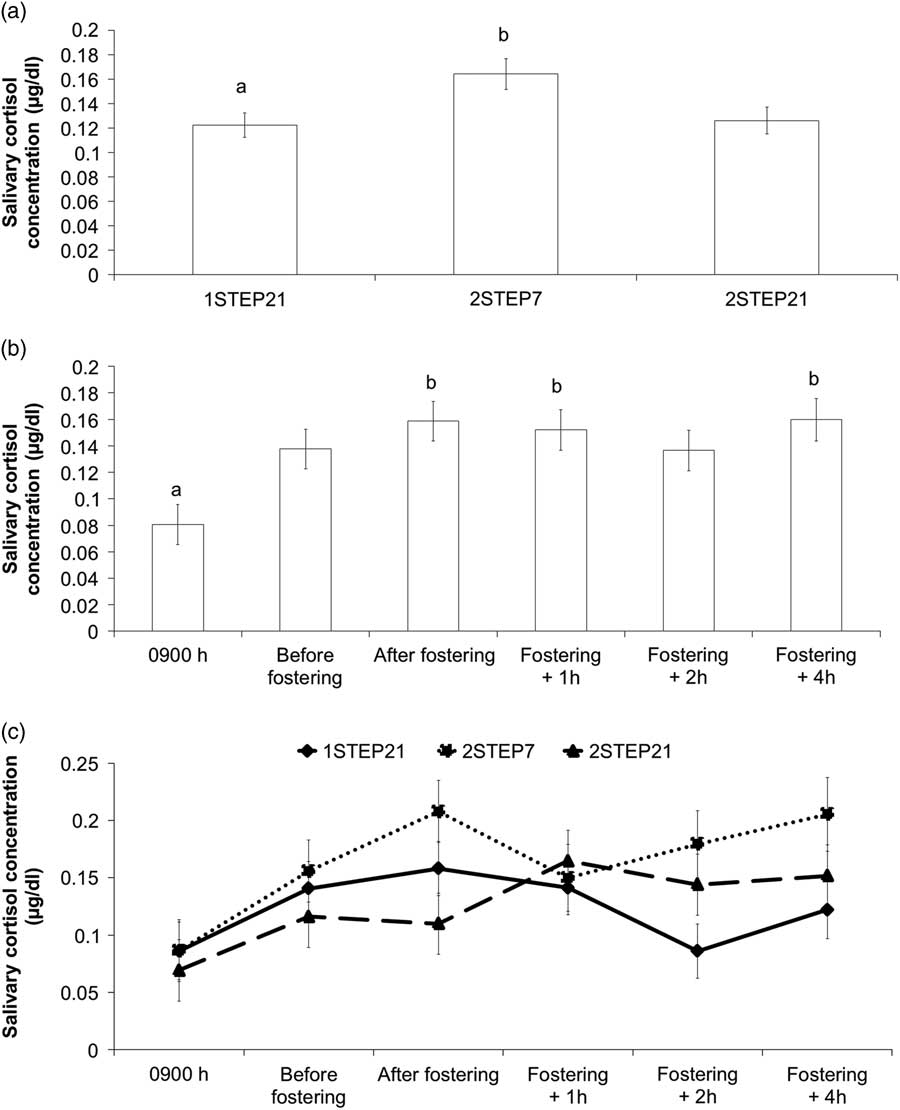
On the day of fostering, 2STEP7 had higher concentrations of salivary cortisol than 1STEP21 (P<0.05) and tended to have higher salivary cortisol concentrations than 2STEP21 (P=0.07, Figure 3a). Compared with the samples collected at 0900 h, the salivary cortisol concentration of all nurse sows was higher just after fostering, and 1 and 4 h post-fostering (P<0.005, Figure 3b). The interaction of treatment by time was not significant, although there was an effect of treatment at two time points: just after fostering and 2 h post-fostering (F 2,113=3.27; P<0.05) (Figure 3c).
Mean (±standard error) salivary cortisol concentration of nurse sows on the day of fostering. Samples were obtained from nurse sows in early lactation (7 days postpartum, 2STEP7) or in late lactation (21 days postpartum, 1STEP21 and 2STEP21); and collected at 0900 h, at fostering of supernumerary piglets (1200 h for 2STEP21, 1400 h for 1STEP21 and 2STEP7) and 1, 2 and 4 h post-fostering. (a) Data were pooled per treatment (all samples, overall effect of treatment: P<0.05). (b) Data were pooled per time point (all treatments, overall effect of time: P<0.005). (c) Data per treatment and per time point (effect of time×treatment: P=0.35). a,bIndicate differences between bars at a confidence level of 95% (P<0.05).

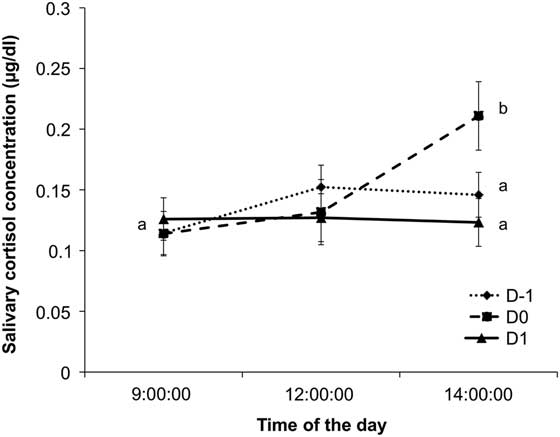
The comparison of samples collected at the same time (0900, 1200 and 1400 h) on the day before, the day of and the day after fostering revealed that there was a time by day effect (P<0.005, Figure 4), in addition to the treatment effect detected previously. Indeed, the samples collected at 1400 h had a higher cortisol concentration on the day of fostering, compared with samples collected the day before and the day after fostering (P<0.05). In addition, the sample collected at 1400 h was higher than the sample collected at 0900 h only on the fostering day (P<0.001).
Mean (±standard error) salivary cortisol concentration of all nurse sows collected at 0900, 1200 and 1400 h on the day before fostering (D-1), the day of fostering (D0), the day after fostering (D1). a,bIndicate differences at a level of confidence level of 95% (P<0.05).

Long-term effects of fostering
The salivary cortisol concentration of all nurse sows did not differ between days (P>0.05). Overall, 1STEP21 had the lowest salivary cortisol concentration, compared with 2STEP7 and 2STEP21 (1STEP21=0.08±0.010 µg/dl v. 2STEP7=0.10±0.010 µg/dl and 2STEP21 0.10±0.010 µg/dl; P<0.05).
Tear staining
There was no side difference on tear staining scores (data not presented). Average tear staining score was not influenced by treatment (F 4,40=0.74, P>0.05) or lactation length (F 8,186=0.98, P>0.05). The correlation between average tear staining scores and salivary cortisol concentration was weak but significant (ρ=0.17, P<0.01). This correlation was stronger in 2STEP21 sows (ρ=0.48, P<0.001) but the correlation was weak and non-significant for the other treatments.
Discussion
This study evaluated the effects of different nurse sow management strategies on some measures of sow welfare. Effects on back-fat thickness, skin and claw lesion scores, and gait scores as well as salivary cortisol concentration were evaluated. With increased hyper-prolificacy, it is likely that sows will have to rear larger litters (i.e. 14 to 15 per sow) which could have implications for sow welfare. The current study investigated a maximum of 12 piglets on the sows at any one time and therefore further investigations are warranted. There is a general agreement that best practice is to give the nurse sow as many (or less) piglets than she has reared before, in particular because the teats that were not used by the previous litter will have dried off.
Nurse sows (i.e. those with a prolonged lactation) lost the same amount of back-fat as control sows (i.e. with a normal lactation length) between entry and removal from the farrowing house. This suggests that their body condition was not overly compromised by fostering, even for the 1STEP21 and 2STEP21 sows which had a lactation period of almost twice the duration of the RI and RE sows. However, in the present study, sows were only selected as nurse sows if they were in good body condition. Hence, this may have mitigated the potential negative effect of a prolonged lactation on body condition.
Nurse sows and non-nurse sows did not differ in lesion scores in the present study. However, given the small sample size, and considering the variety of causal factors, it is not possible to conclusively evaluate the effects of nurse sow strategies on the development of lesions. Indeed, a larger scale study by Sørensen et al. (Reference Sørensen, Rousing, Kudahl, Hansted and Pedersen2016) showed that nurse sows were more prone to develop udder wounds and swollen bursae on legs, compared to non-nurse sows. In the current study body lesion scores decreased numerically between entry and exit from the farrowing house in all sows. This reflects the healing that occurs in the farrowing crate from injuries arising from aggression between sows while housed in groups during gestation. On the other hand, limb and udder lesion scores numerically increased (i.e. got worse), which is likely to be indicative of the well-documented effects of abrasive flooring, restrictions on movement and piglets fighting at the udder in confined farrowing systems (e.g. Bonde et al., Reference Boyle, Leonard, Lynch and Brophy2004; Verhovsek et al., Reference Verhovsek, Troxler and Baumgartner2007; KilBride et al., Reference KilBride, Gillman and Green2009). However, lameness and shoulder lesion scores did not change over time, except for 2STEP7 sows, for which lameness increased. Lameness is one of the main reasons for culling sows on commercial farms (Dagorn and Aumaitre, Reference Dagorn and Aumaitre1979; Anil et al., Reference Baxter, Rutherford, D’Eath, Arnott, Turner, Sandøe, Moustsen, Thorup, Edwards and Lawrence2009). Thus, it is important to consider whether nurse sow strategies affect the locomotion of sows. Remain intact sows had the lowest limb lesions, which could be due to their behaviour during nursing bouts. Indeed, RI sows had the longest nursing bouts and terminated fewer bouts than other sows (Schmitt et al., Reference Schmitt, Baxter, Boyle and O’Driscoll2018). Thus, RI sows may have been calmer and made fewer movements in the crate, which limited the extent of leg lesions, compared with other treatments.
The fostering procedure (i.e. removal of own and addition of alien piglets) seemed to affect 2STEP7 sows more than 2STEP21 and 1STEP21 sows as shown by (at least numerically) higher salivary cortisol concentrations just after fostering. This result should be treated with caution, as it is only a trend, though it might suggest that the physiological reaction of nurse sows to fostering depends on their lactation stage. It would make sense from an evolutionary point of view that sows in early lactation are more stressed by the removal of their own piglets, when piglet survival is more dependent on maternal investment, than later on in lactation when the piglets are less vulnerable and more independent (i.e. initiating weaning process) (Drake et al., Reference Drake, Fraser and Weary2008). However, as sows were moved to the crate where they received the fostered piglets, it can be hypothesised that the arousal of movement could participate in increasing cortisol level.
When considering results from the analysis of cortisol, it is important to take into account that there was rather high intra-assay variability, which is likely to be due to difference in the viscosity of some saliva samples. Indeed, duplicates of viscous samples may have reacted differently during the enzymatic assay and produced different results. It is also worth highlighting that samples collected at 0900 h on fostering day did not reflect the stress level of nurse sows relative to fostering, as this sample was collected before the fostering strategy was imposed after 1200 h. The high concentrations of salivary cortisol observed during the farrowing week for all sows was likely due to the farrowing process, which involves pain and stress (Lawrence et al., Reference Lawrence, McLean, Jarvis, Gilbert and Petherick1997). Prolonged lactation did not increase cortisol levels, which confirms the conclusions of Amdi et al. (Reference Anil, Anil and Deen2017) but contradicts those of Cronin et al. (Reference Cronin, Barnett, Hodge, Smith and McCallum1991) and Jarvis et al. (2006) who both showed increased blood plasma cortisol levels of sows confined in crates for longer than 28 days. However, both these studies measured cortisol in blood plasma and both conducted their studies on primiparous sows. It is possible that blood plasma is a more sensitive measure of circulating cortisol levels, or that primiparous sows are more likely to be affected by a prolonged period of confinement. In the present study there was only one primiparous sow, used as a control (i.e. RI treatment), thus comparison with other parities or with other primiparous sows in the other treatments is not possible. Mothering abilities of gilts are not fully developed (Thodberg et al., Reference Thodberg, Jensen and Herskin2002), thus farmers are reluctant to use them as nurse sows. In addition to physiological parameters (heart rate, salivary cortisol), Amdi et al. (Reference Anil, Anil and Deen2017) measured potential behavioural indicators of stress by comparing the number of milk let-downs per hour, but there was no difference between nurse sows and non-nurse sows throughout their lactation, which supports the hypothesis that the nurse sows were not overly stressed relative to non-nurse sows.
Tear stain scoring is a novel non-invasive technique that could be used to detect signs of chronic stress in sows (DeBoer et al., Reference De Rensis, Gherpelli, Superchi and Kirkwood2015; Telkänranta et al., Reference Telkänranta, Marchant-Forde and Valros2016). The correlation between tear staining scores and salivary cortisol levels was weak but significant, thus suggesting that this technique could complement other validated measures of stress in pigs. Obviously, the weak correlation also suggests that more validation work is needed, with a more rigorous methodology. For instance, in other studies where tear staining was significantly correlated with measures of stress, the eyes of the animals were cleaned before the treatments were applied (DeBoer et al., Reference De Rensis, Gherpelli, Superchi and Kirkwood2015; Telkänranta et al., Reference Telkänranta, Marchant-Forde and Valros2016). In the present study the sows eyes were not cleaned and thus the scores might also be related to past exposure to stressors (e.g. during gestation period, Quesnel et al., 2016), since tear staining can remain evident for longer until it is removed naturally.
It is also possible that all sows were in fact chronically stressed, which could have masked the effect of acute stress (i.e. fostering). Indeed, chronically stressed birds (Rich and Romero, Reference Rich and Romero2005) and pigs (Janssens et al., Reference Janssens, Helmond, Loyens, Schouten and Wiegant1995) had a lower response to ACTH challenge, compared with non-stressed counterparts. Both studies identified this phenomenon as an adaptive mechanism whereby the response of the pituitary–adrenocortical axis is inhibited by the opioid system to avoid excessive reactions to stressors. In the present study, it can be suspected that sows were chronically stressed as their saliva samples collected on the day before and the day following fostering did not reflect the expected diurnal pattern, where samples collected at 0900 h should have a lower cortisol concentration than samples collected at 1200 and 1400 h (Ruis et al., Reference Ruis, Te Brake, Engel, Ekkel, Buist, Blokhuis and Koolhaas1997). Since there is no gold standard or established threshold to determine if the animals are stressed, assessment of the stress level on an animal can only be made on the basis of changes from the animal’s baseline, that is, increases reflect worse situations and decreases reflect better situations. Detailed data on the level of cortisol and tear staining during the gestation period would improve the assessment of stress level of sows and the validity of the present results.
In conclusion, the present results suggest that, provided that nurse sows with good body condition and rearing capacity are selected, there are only minimal or no overtly deleterious physiological or physical effects of fostering. Therefore, from the sow’s point of view, the nurse sow strategies tested represent potential management tools for managing large litters on commercial farms. However these results must be considered carefully, given the small sample size of the study. Moreover, the two-step nurse sow strategy would deserve further attention as there seem to be negative effects on sow stress, although it seems to have a lower impact on piglets’ welfare (Schmitt et al., Reference Schmitt, Baxter, Boyle and O’Driscoll2018). Effects of these strategies on piglets’ survival, health and behaviour are being investigated in a companion paper (Schmitt et al., Reference Schmitt, Baxter, Boyle and O’Driscoll2018).
Acknowledgements
This research was funded by the Irish Department of Agriculture, Food and the Marine through the FIRM/RSF/CoFoRD 2013 Research Call (project no. 13S428). The authors would like to thank Sophie Verstraeten, Sebastien Laboute and David Clarke for helping with data collection, the farm for facilitating this study, and Jim Grant for statistical consultancy.
Declaration of interest
The authors declare that they did not have a conflict of interest in the conduction of this study.
Ethics statement
Ethical approval for this study was granted by Teagasc Animal Ethics Committee (approval no. TAEC90/2015). The experiment was carried out in accordance with Irish legislation (SI no. 543/2012) and the EU Directive 2010/63/EU for animal experimentation.
Software and data repository resources
None of the data were deposited in an official repository.
Supplementary materials
To view supplementary material for this article, please visit https://doi.org/10.1017/S175173111800160X