Implications
Considerable proportions of farm animal genetic resources in developing countries are experiencing degradation and are at risk of being lost. Adapted genetic material cannot be replaced and its loss will negatively affect the capacity of breeders to adapt to changes in production environments and breeding objectives. Application of genomic tools for genetic characterization can contribute to, and facilitate the design of, rational programs for breed improvement, utilization and conservation. In this study, we applied bovine 80K SNP BeadChips (derived from Bos indicus) to characterize Ethiopian cattle populations and compare them with Asian zebu and taurine breeds.
Introduction
Molecular evidence shows that modern world cattle breeds (Bos indicus and Bos taurus) were domesticated independently from two subspecies of aurochs (Loftus et al., Reference Loftus, MacHugh, Bradley, Sharp and Cunningham1994; Bradley et al., Reference Bradley, MacHugh, Cunningham and Loftus1996). Earlier views maintained that African cattle were derived from three major introductions from Asia through the Nile Valley or via the Horn of Africa (Epstein, Reference Epstein1957). It was assumed that the first cattle breed introduced into Africa was the humpless Hamitic longhorn (taurine), which occurred around 6000 bc, and that the second was the humpless shorthorn between 2750 and 2500 bc (Epstein, Reference Epstein1971). On the other hand, archaeological and molecular evidence argues for the independent domestication of cattle (B. taurus) in Africa (Grigson, Reference Grigson1991; Bradley et al., Reference Bradley, MacHugh, Cunningham and Loftus1996; Hanotte et al., Reference Hanotte, Bradley, Ochieng, Verjee, Hill and Rege2002). However, until recently, there has been controversy about the evidence for domestication of B. taurus in Africa (Decker et al., Reference Decker, McKay, Rolf, Kim, Alcalá, Sonstegard, Hanotte, Götherström, Seabury, Praharani, Babar, Regitano, Yildiz, Heaton, Liu, Lei, Reecy, Saif-Ur-Rehman, Schnabel and Taylor2014). Recent genome-wide analysis revealed that African taurine cattle were first domesticated in the Middle East and later hybridized with African aurochs (Decker et al., Reference Decker, McKay, Rolf, Kim, Alcalá, Sonstegard, Hanotte, Götherström, Seabury, Praharani, Babar, Regitano, Yildiz, Heaton, Liu, Lei, Reecy, Saif-Ur-Rehman, Schnabel and Taylor2014). The humped zebu (B. indicus) appears to have originated in Asia and dispersed into Africa mainly through the Horn and East Coast (Hanotte et al., Reference Hanotte, Bradley, Ochieng, Verjee, Hill and Rege2002). It is thought that B. indicus was first introduced into Africa around 1500 bc, with subsequent introductions in large numbers around 699 ad (Epstein, Reference Epstein1971). The most recent introduction of zebu into Africa might have been facilitated by epidemics of rinderpest (a viral disease) in the late 19th to early 20th centuries, which decimated indigenous populations of B. taurus (Epstein, Reference Epstein1971; Gifford-Gonzalez and Hanotte, Reference Gifford-Gonzalez and Hanotte2011). The first zebu bulls introduced to Africa were crossed with longhorn humpless cattle and produced cervico-thoracic sanga cattle, whereas the second wave of introductions resulted in the formation of zenga (sanga×zebu (Epstein, Reference Epstein1971; Grigson, Reference Grigson1991; Rege, Reference Rege1999).
Given Ethiopia’s geographical proximity to the main routes by which cattle entered Africa (the Horn and East Coast), and its diverse agro-ecology (ranging from extreme lowlands to Afro-alpine zones), this country is regarded as a secondary hybridization zone and as one of the original locations of Africa’s indigenous cattle. Ethiopia is home to 24 cattle breeds or strains (16% of Sub-Saharan breeds), comprising one taurine shorthorn, three sanga, three zenga and 18 zebu (Rege, Reference Rege1999). In Bangladesh, cattle are the zebu type (Bhuiyan et al., Reference Bhuiyan, Bhuiyan, Yoon, Jeon, Park and Lee2007). Most of these populations are adapted to harsh environments and show strong phenotypic variation; these breeds are often named after the locality they inhabit or the community that maintains (Hanotte et al., Reference Hanotte, Dessie and Kemp2010). Despite the large phenotypic diversity among indigenous cattle populations and the corresponding reservoir of unique genetic resources, the actual genetic diversity and relationships among many indigenous cattle populations have not been explored in depth.
An understanding of the genetic diversity and population structure is useful for designing effective strategies for improving, managing and conserving farm animal genetic resources (Reist-Marti et al., Reference Reist-Marti, Simianer, Gibson, Hanotte and Rege2004; Groeneveld et al., Reference Groeneveld, Lenstra, Eding, Toro, Scherf, Pilling, Negrini, Finlay, Jianlin, Groeneveld and Weigend2010). Recent molecular studies have characterized Ethiopian cattle breeds by using a limited number of low-density microsatellites, mitochondrial DNA (mtDNA) or Y-chromosome markers (Li et al., Reference Li, Zerabruk, Vangen, Olsaker and Kantanen2007; Dadi et al., Reference Dadi, Tibbo, Takahashi, Nomura, Hanada and Amano2008; Zerabruk et al., Reference Zerabruk, Li, Kantanen, Olsaker, Ibeagha-Awemu, Erhardt and Vangen2011). To date, Bangladeshi cattle populations have not been subjected to thorough molecular investigation; however, limited study of the Red Chittagong population has been conducted using mtDNA (Bhuiyan et al., Reference Bhuiyan, Bhuiyan, Yoon, Jeon, Park and Lee2007). With the development of next-generation sequencing technology, single-nucleotide polymorphisms (SNPs) are among the most important molecular markers and are now routinely employed for inference of population history and studies of genetic diversity and genome-wide association (Brumfield et al., Reference Brumfield, Beerli, Nickerson and Edwards2003; Gautier et al., Reference Gautier, Faraut, Moazami-Goudarzi, Navratil, Foglio, Grohs, Boland, Garnie, Boichard, Lathrop, Gut and Eggen2007). Genome-wide comparison of populations from different geographical regions can also detect potential candidate genes associated with ecological adaptations (Edea et al., Reference Edea, Dadi, Kim, Park, Shin, Dessie and Kim2014). Here, we present a comprehensive genome-wide analysis of genetic diversity, population structure and admixture of 10 cattle populations from Asia (Bangladesh and South Korea) and Africa (Ethiopia), which included 69 903 autosomal SNPs derived mainly from indicine cattle.
Material and methods
Cattle populations and collection of DNA samples
We sampled 244 animals from seven Ethiopian cattle populations, two Bangladeshi zebu and one South Korean taurine. The Ethiopian samples included five breed groups: sanga (Raya-Azebo, n=15); zenga (Fogera, n=36 and Arado, n=26); large East African zebu (Begait, n=36); small East African zebu (Guraghe, n=26 and Ogaden, n=21); and shorthorn taurine (Sheko, n=21) (DAGRIS, 2007). Red Chittagong (n=23) and a non-descript Deshi (n=22) were sampled from Bangladesh and represented Asian zebu. The Korean cattle (Hanwoo, n=18) were Asian taurine. Nasal swab samples were collected using Performagene LIVESTOCK nasal swabs (DNA Genotek, Kanata, ON, Canada). Care was taken to sample unrelated animals, based on information obtained from the animals’ owners or pedigree records. DNA was extracted from nasal samples according to the manufacturer’s recommendations (http://www.dnagenotek.com).
Genotyping, quality control and marker screening
All samples were genotyped using the GeneSeek Genomic Profiler HD BeadChip (GeneSeek, Lincoln, NE, USA), an Illumina Infinium array consisting of SNPs derived mainly from B. indicus according to Illumina’s standard protocols (http://www.illumina.com). Among 74 153 SNPs, we discarded 3924 on the X chromosome, 233 that were unmapped to the bovine genome, 13 on mtDNA and 80 on the Y-chromosome, leaving 69 903 autosomal SNPs mapped to the bovine genome that were used for analysis of minor allele frequency (MAF) and polymorphism. In each population, samples with a call rate <95% were excluded from further analysis.
Statistical analysis
Genetic diversity and relationships
The MAFs and proportion of polymorphic SNPs were estimated using SNP and Variation Suite version 7 (2014) (Golden Helix Inc., Bozeman, MT, USA, www.goldenhelix.com). To estimate within-population genetic diversity, we calculated observed heterozygosity (H O), expected heterozygosity (H E) and inbreeding for each population using PowerMarker software (Liu and Muse, Reference Liu and Muse2005). Pairwise distances (F ST ) (Weir, Reference Weir1996) and Reynolds’ genetic distances (Reynolds et al., Reference Reynolds, Weir and Cockerham1983) between all pairs of cattle populations were estimated in PowerMarker (Liu and Muse, Reference Liu and Muse2005). The unweighted pair group method with arithmetic mean (UPGMA) algorithm was used to construct a dendrogram from Reynolds’ matrices, and a neighbor-joining (NJ) tree was constructed from allele-sharing distances using PowerMarker (Liu and Muse, Reference Liu and Muse2005). The generated trees were visualized in MEGA version 4 (Tamura et al., Reference Tamura, Dudley, Nei and Kumar2007).
Heterozygosity estimates are sensitive to various ascertainment biases when SNPs discovered in one breed are used to genotype other breeds (Nielsen, Reference Nielsen2004). Exclusion of markers in high linkage disequilibrium (LD) has been shown to minimize the effects of these biases (Herráez et al., Reference Herráez, Bauchet, Tang, Theunert, Pugach, Li, Nandineni, Gross, Scholz and Stoneking2009; Kijas et al., Reference Kijas, Lenstra, Hayes, Boitard, Porto Neto, Cristobal, Servin, McCulloch, Whan, Gietzen, Paiva, Barendse, Ciani, Raadsma, McEwan and Dalrymple2012). To assess the effects of ascertainment bias on diversity indexes and genetic distances we used three SNP data sets: (a) 54 404 autosomal SNPs that remained after applying filtering criteria (call rate>98%, MAF>5% and Hardy–Weinberg equilibrium P-value>0.001) on 69 903 autosomal SNPs; (b) 12 290 SNPs obtained after pruning 54 404 SNPs for LD in each population using the parameter indep (50 5 0.5) in SNP and Variation Suite version 7 and (c) 4441 common SNPs for 50K and 80K platforms. Analysis of molecular variance (AMOVA) was estimated in Arlequin 3.5 (Excoffier et al., Reference Excoffier, Laval and Schneider2005) using the pruned SNP data set by assigning the populations into three groups: Ethiopian cattle, Bangladeshi zebu and Hanwoo.
Principal component (PC) and admixture analysis
Patterns of population genetic structure were assessed by principal component analysis (PCA) in SNP and Variation Suite version 7 using the 54 404 filtered for call rate >98% and MAF >5% and the data set pruned for LD (12 290 SNPs). PCA assigns individuals to their population of origin using a common clustering algorithm (Patterson et al., Reference Patterson, Price and Reich2006). Model-based clustering was carried out using STRUCTURE 2.3.4 (Prichard et al., Reference Pritchard, Stephens and Donnelly2000) following the admixture ancestry model and correlated allele frequencies using the pruned SNP data set. Model-based clustering partitions the genome of each animal into a predefined number of components (K) and models the allele frequency distribution of the ancestral parental population, allowing admixed animals to be included in the characterization of the ancestral population (Pritchard et al., Reference Pritchard, Stephens and Donnelly2000). We ran STRUCTURE for LD-pruned SNPs using the admixture ancestry model and correlated allele frequency with K values ranging from 2 to 4, with a burn-in period of 20 000 generations and Markov chain Monte Carlo simulation (100 000 iterations). STRUCTURE output is used to produce population structure barplots using the barplot function in the R Language and Environment for Statistical Computing (R Development Core Team, 2009). We performed further STRUCTURE analysis at the chromosomal level to investigate genome-wide distribution of the indicine and taurine backgrounds among the populations.
Results
Within-breed genetic diversity, polymorphism and ascertainment bias
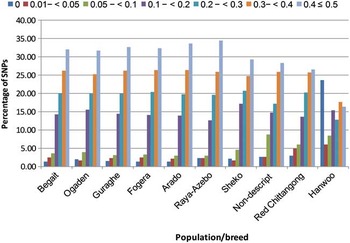
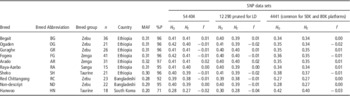
Genetic diversity within each population was assessed by estimating MAF, the percentage of polymorphic SNPs, heterozygosity and inbreeding. The overall mean MAF across all loci was 0.31, 0.29 and 0.20 for Ethiopian, Bangladeshi and Hanwoo cattle populations/breeds, respectively. The percentage of SNPs was plotted for each frequency bin (Figure 1). Approximately 32% and 27% of SNPs in the Ethiopian cattle populations and Bangladeshi zebu, respectively, had MAF values ⩾0.40, whereas only 16% of SNPs in Hanwoo had MAF values ⩾0.40. Approximately 95% (on average) of the markers in Ethiopian and Bangladeshi cattle displayed polymorphism (MAF⩾5%). Hanwoo had the lowest levels of polymorphisms, and ~24% of Hanwoo SNP loci displayed one-allele SNPs (MAF=0). In contrast, <3% of loci were fixed in Ethiopian cattle and Bangladeshi zebus. Genetic diversity indexes as measured by H O and H E, inbreeding coefficients, and percentage of polymorphic SNPs are indicated in Table 1. Using 54 404 SNPs, the average H O was lowest in Hanwoo and highest in Fogera and Ogaden cattle.
Frequency distribution of minor alleles within the sampled populations.

Sample size and indexes of genetic diversity in the studied cattle populations, from three single-nucleotide polymorphism (SNP) data sets

LD=linkage disequilibrium; %P=percent of polymorphic SNPs in the 69 903 SNP data set; MAF=minor allele frequency; HO=observed heterozygosity; HE=expected heterozygosity; f=inbreeding coefficient.
Ascertainment biases can be minimized by LD-pruning of closely associated SNPs and by analyzing haplotypes instead of individual SNPs (Herráez et al., Reference Herráez, Bauchet, Tang, Theunert, Pugach, Li, Nandineni, Gross, Scholz and Stoneking2009). We used different SNP data sets to assess the effects of ascertainment biases on population diversity indexes and differentiation. LD-based pruning slightly increased the estimated within-breed genetic diversity (H O and H E) in Hanwoo and slightly reduced the estimated diversity in Ethiopian cattle populations (Table 1). For SNPs overlapping between the 50K and 80K arrays, mean estimates of population genetic diversity were highest in Hanwoo and lowest in Bangladeshi zebu. Among Ethiopian cattle, Sheko displayed the highest diversity for overlapping SNPs. These results most likely reflect the effects of biases that distort population diversity parameters when data are not corrected. Inbreeding coefficients estimated for the three SNP data sets revealed the most inbreeding in Arado (0.02) and the least in Hanwoo (Table 1). Global AMOVA performed on 12 290 SNPs for all breeds structured by group (Ethiopian cattle, Bangladeshi zebu and Hanwoo) showed that 10% of the total genetic variation resulted from differences among populations (P<0.0001) and 89% of the variance was at the within-individual level. When we ran AMOVA separately for Ethiopian cattle populations, among-population variation was only 2% (98% was within-individual variation).
Genetic differentiation, distance and phylogeny
F ST values and Reynolds genetic distances computed on the basis of 54 404 SNPs for each population pair are presented in Supplementary Table S1. Pairwise F ST estimates showed the lowest level of genetic differentiation between Arado and Guraghe cattle and, as expected, the greatest divergence between Bangladeshi zebu (B. indicus) and Hanwoo (B. taurus) (F ST =0.33). Similarly, the lowest Reynolds distance occurred between Arado and Guraghe cattle, and the largest Reynolds distance was found between B. indicus and B. taurus. The two Bangladeshi zebu populations had an F ST value of 0.006, showing their close genetic relationship. Sheko showed less genetic differentiation (F ST =0.18) than did others from Hanwoo, which was further supported by STRUCTURE results that showed that Sheko shared a greater proportion of Hanwoo ancestry.
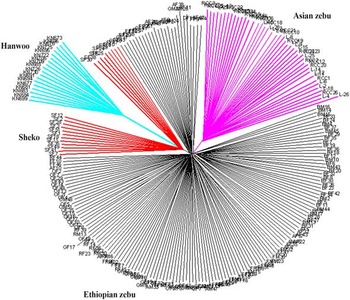
Correction of ascertainment bias by pruning SNPs for LD showed that the degree of differentiation (F ST ) and Reynolds distances among populations were reduced for SNPs subjected to pruning (Supplementary Figure S1). For example, estimated F ST values between Hanwoo and Asian zebu fell from 0.33 for the unpruned SNP data set to 0.27 for the pruned SNPs; similarly, the average Reynolds genetic distance was reduced from 0.35 to 0.29. NJ trees that separated the animals according to their geographical origin were constructed from shared allelic distances for each individual. The NJ trees showed that, with the exception of Sheko, animals from Ethiopian cattle populations were closely clustered (Figure 2), as supported by PCA. Phylogenetic analysis revealed that Hanwoo was located in a clade with Sheko, which indicated that these breeds share common ancestry. The Bangladeshi zebu (non-descript Deshi and Red Chittangong) were clustered in one branch of the clade (Supplementary Figure S2). UPGMA also revealed a distinct separation between B. taurus (Hanwoo) and B. indicus (Supplementary Figure S3). Among Ethiopian cattle, Sheko was the first to split, followed by Begait. Interestingly, the two zenga populations (Fogera and Arado) were closely clustered, as were Red Chittangong and non-descript Deshi. Ascertainment bias did not affect the topology of the phylogenetic trees constructed from genetic distances, or its interpretation (data not shown), which was consistent with a previous study in sheep (Kijas et al., Reference Kijas, Lenstra, Hayes, Boitard, Porto Neto, Cristobal, Servin, McCulloch, Whan, Gietzen, Paiva, Barendse, Ciani, Raadsma, McEwan and Dalrymple2012).
Genetic relationships among 10 cattle breeds constructed using a neighbor-joining tree from shared allele distance, based on 12 290 single-nucleotide polymorphisms (SNPs) obtained after linkage disequilibrium (LD) pruning on 54 404 SNPs.

PCA and evidence of admixtures
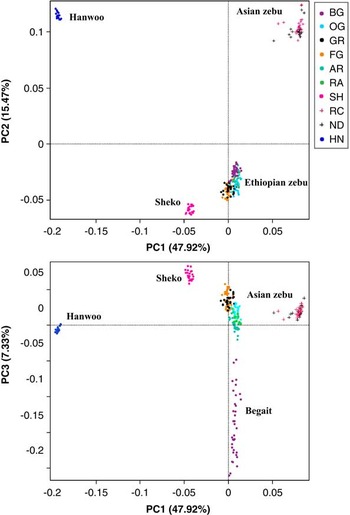
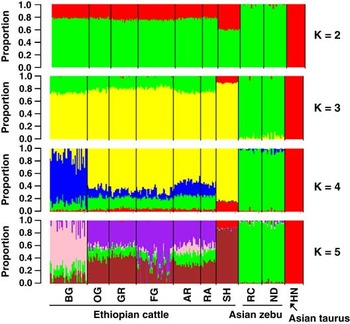
Results of the PCA of the three SNP data sets clearly separated the populations by geographic origin (Figure 3). For 54 404 autosomal SNPs, PC1 and PC2 accounted for ~48% and 15% of the total variation, respectively, and clearly separated the individuals into Bangladeshi zebu, admixed (Ethiopian cattle) and taurine (Hanwoo). PC3 accounted for ~7% of the total variation and tended to separate Begait from other Ethiopian cattle populations, which was also captured by STRUCTURE analysis (K=4). In general, PCA results based on different SNP data sets revealed similar patterns of relationships between populations and were not significantly influenced by ascertainment bias. We also used model-based clustering implemented in STRUCTURE (Prichard et al., Reference Pritchard, Stephens and Donnelly2000) to partition the genome of each animal into a predefined number of clusters. As shown in Figure 4, for predefined K=2, populations (breeds) were clearly clustered into B. indicus and B. taurus (Hanwoo), which corresponded to the independent domestication of the bovine species, whereas all Ethiopian cattle populations were traced to shared indicine and taurine ancestry, which supported their hybrid origin. With the exception of Sheko, 76% (on average) of the genome of Ethiopian cattle populations shared an Asian zebu background, whereas ~41% and 59% of Sheko samples appeared to share taurine and indicine ancestry, respectively. Bangladeshi zebu showed only 1% introgression from Asian taurine (Hanwoo), which was in good agreement with the PCA and phylogenetic tree results. At K=3, population clustering was consistent with grouping of the populations into taurine, zebu and admixed (Ethiopian cattle), where Ethiopian zebu, sanga and zenga populations shared 23% of their ancestry with Asian zebu and 0.2% with Hanwoo. For K=3, Sheko shared ~89% of its genetic material with Ethiopian zebu, sanga and zenga. At assumed K=4, 72% (on average) of Begait genomes were assigned to cluster 3, but only 16% of the genomes of other Ethiopian cattle (except Sheko) shared this cluster. We extended the STRUCTURE analysis by individual chromosomes (results are described in Supplementary Tables S1 and S2). Highly significant variation (P<0.0001) in the level of Asian indicine ancestry among chromosomes was detected in six Ethiopian zebu, sanga and zenga populations.
Principal component analysis (PCA) of 10 cattle populations/breeds based on 54 404 autosomal single-nucleotide polymorphisms (SNPs).

Clustering assignments of 10 cattle populations based on STRUCTURE analysis (Prichard et al., Reference Pritchard, Stephens and Donnelly2000) at inferred K values ranging from 2 to 5. Each individual is represented by a single vertical line divided into K colored segments, where K is the number of the cluster assumed to have length proportional to each of the K inferred clusters. Black color separates the populations.

Discussion
Patterns of genetic diversity, differentiation and ascertainment bias
Most studies of population diversity and structure in cattle have applied Illumina 50K SNP BeadChips (GeneSeek, Lincoln, NE, USA), which are primarily derived from European cattle breeds. Here, for the first time, we used indicine-derived SNPs to investigate genome-wide diversity, relationships and admixture in cattle originating from Africa and Asia. The observed levels of polymorphism were higher than those reported for Ethiopian cattle populations (83.96%) (Edea et al., Reference Edea, Dadi, Kim, Dessie, Lee, Kim, Kim and Kim2013) and those from a low-density bovine SNP chip assay (47.4% in Lagune and 71.0% in Borgou) (Gautier et al., Reference Gautier, Faraut, Moazami-Goudarzi, Navratil, Foglio, Grohs, Boland, Garnie, Boichard, Lathrop, Gut and Eggen2007). The higher levels of polymorphism, MAF and heterozygosity in Ethiopian cattle and Asian zebu populations compared with Hanwoo (taurine) could be related to ascertainment biases, as we demonstrated here and as noted in previous reports (Gauiter et al., Reference Gautier, Laloe and Moazami-Goudarzi2010). Analyses of population diversity and relationships based on ascertained SNP data produced incorrect results (Lachance and Tishkoff, Reference Lachance and Tishkoff2013). LD-pruning (by removing closely associated SNPs) and analysis of haplotypes rather than individual SNPs could minimize ascertainment biases (Herráez et al., Reference Herráez, Bauchet, Tang, Theunert, Pugach, Li, Nandineni, Gross, Scholz and Stoneking2009). To determine the effects of ascertainment bias on indexes of population diversity and differentiation, we used different SNP data sets: pruned for LD (v. unpruned) and common to 50K and 80K platforms. As expected, correction for LD led to a slight increase in the level of within-breed diversity in Hanwoo compared with an unpruned data set. The higher diversity indexes in Ethiopian cattle compared with Asian zebu support the understanding that extensive diversity is conserved in Ethiopian cattle. For example, Zarebruk et al. (Reference Zerabruk, Li, Kantanen, Olsaker, Ibeagha-Awemu, Erhardt and Vangen2011) used microsatellite markers and identified higher within-population diversity in Northern Ethiopian cattle compared with Asian zebu and European taurine. We also showed that measures of population differentiation such as F ST are subject to SNP ascertainment bias, which is in agreement with previous studies of human populations (Lachance and Tishkoff, Reference Lachance and Tishkoff2013).
On the basis of genetic distance, PCA and STRUCTURE results, Begait showed greater genetic differentiation and more unique patterns of admixtures among Ethiopian zebu, sanga and zenga. These different patterns might have been related to patterns of zebu introgression into Africa. Begait cattle are thought to have descended from the first wave of zebu introgression, whereas small East African zebu such as Ogaden and Gurgahe introgressed during the second wave following the rinderpest epidemic of the early 20th century (Epstein, Reference Epstein1971; DAGRIS, 2007).
Similar to our results, F ST values of 1.2% (Dadi et al., Reference Dadi, Tibbo, Takahashi, Nomura, Hanada and Amano2008) and 1.1% (Zerabruk et al., Reference Zerabruk, Li, Kantanen, Olsaker, Ibeagha-Awemu, Erhardt and Vangen2011) from microsatellite markers, and 1.2% from a low-density taurine-derived chip (Edea et al., Reference Edea, Dadi, Kim, Dessie, Lee, Kim, Kim and Kim2013), were reported among Ethiopian cattle populations. However, our F ST values were lower than those from previous studies of West African cattle breeds (6%; Ibeagha-Awemu and Erhardt, Reference Ibeagha-Awemu and Erhardt2005) and six African cattle breeds (4%; Gautier et al., Reference Gautier, Faraut, Moazami-Goudarzi, Navratil, Foglio, Grohs, Boland, Garnie, Boichard, Lathrop, Gut and Eggen2007). A higher average F ST value (0.09) between Nellore and Northern Ethiopian cattle breeds was also observed (Zerabruk et al., Reference Zerabruk, Li, Kantanen, Olsaker, Ibeagha-Awemu, Erhardt and Vangen2011), compared with our finding of 0.07 for Ethiopian and Asian zebu. The lowest genetic differentiation and genetic distance observed among the Ethiopian cattle populations might be a result of their common ancestral origin and strong gene flow (Dadi et al., Reference Dadi, Tibbo, Takahashi, Nomura, Hanada and Amano2008; Zerabruk et al., Reference Zerabruk, Li, Kantanen, Olsaker, Ibeagha-Awemu, Erhardt and Vangen2011; Edea et al., Reference Edea, Dadi, Kim, Dessie, Lee, Kim, Kim and Kim2013), a conclusion that is supported by our PCA and STRUCTURE analysis. The F ST estimates between Bangladeshi zebus and Ethiopian cattle were considered moderate (0.05 to 0.15), whereas estimates for Asian zebu and Hanwoo were very large (>0.25) (Wright, Reference Wright1978). The moderate F ST value noted between African and Bangladeshi zebu breeds was related to their common genetic background, as the paternal origin of Ethiopian zebu is traced to the Indian subcontinent (Dadi et al., Reference Dadi, Tibbo, Takahashi, Nomura, Hanada and Amano2009). The F ST value observed here for Red Chittangong and non-descript Deshi was far lower than that reported between Ongole and Deoni zebu from India (0.117) (Metta et al., Reference Metta, Kanginakudru, Gudiseva and Nagaraju2004) and 0.26667 for the Khillar–Kenkatha breeds of west-central India, although closer to the value (0.0126) reported for Kankrej-Malvi (Shah et al., Reference Shah, Patel, Bhong, Doiphode, Umrikar, Parmar, Rank, Solanki and Joshi2012). Within populations, the genetic variability estimated for Bangladeshi zebu was higher than the reported average for Indian zebu (Shah et al., Reference Shah, Patel, Bhong, Doiphode, Umrikar, Parmar, Rank, Solanki and Joshi2012).
On the basis of phenotypic characteristics, Ethiopian cattle are classified into zebu, sanga (zebu×B. taurus), zenga (sanga×zebu) and shorthorn taurine (Rege, Reference Rege1999; DAGRIS, 2007). The lack of clear genetic differentiation and differences in the proportion of Asian zebu ancestry in Ethiopian zebu, sanga and zenga does not support their phenotype-based classification and reveals high gene flow and introgression among these breeds. Despite the small amount of genetic differentiation among Ethiopian indigenous cattle populations, these populations vary in body size and coat color pattern and are known to adapt to a wider range of environmental conditions. Populations such as Begait and Ogaden are known to adapt to extensive heat stress, whereas Sheko has some degree of tolerance to trypanosomiasis (DAGRIS, 2007).
Population structure and evidence of admixture
Different statistical approaches have been developed to assess the relationships among populations and to allocate individuals to their respective populations. The NETVIEW approach has recently been demonstrated to correctly assign individuals to their respective breeds and to detect a fine-scale population structure (Neuditschko et al., Reference Neuditschko, Khatkar and Raadsma2012). The haplotype-based approach implemented in ChromoPainter has also been shown to the capture population structure at a much finer level (Lawson et al., Reference Lawson, Hellenthal, Myers and Falush2012). PCA and model-based approaches such as STRUCTURE are popular, widely used methods for analyzing the population structure (Pritchard et al., Reference Pritchard, Stephens and Donnelly2000; Patterson et al., Reference Patterson, Price and Reich2006). The population structure and phylogenic trees analyses performed here clearly showed the largest divergence between B. taurus (Hanwoo) and B. indicus (Asian zebu), which is consistent with previous studies and supports independent domestication of the two bovine species (Loftus et al., Reference Loftus, MacHugh, Bradley, Sharp and Cunningham1994; Gautier et al., Reference Gautier, Laloe and Moazami-Goudarzi2010; Decker et al., Reference Decker, McKay, Rolf, Kim, Alcalá, Sonstegard, Hanotte, Götherström, Seabury, Praharani, Babar, Regitano, Yildiz, Heaton, Liu, Lei, Reecy, Saif-Ur-Rehman, Schnabel and Taylor2014). Previous SNP-based studies in cattle, sheep and humans demonstrated that PC1 and PC2 primarily clustered breeds or populations according to their geographic origin (Herráez et al., Reference Herráez, Bauchet, Tang, Theunert, Pugach, Li, Nandineni, Gross, Scholz and Stoneking2009; Gauiter et al., Reference Gautier, Laloe and Moazami-Goudarzi2010; Kijas et al., Reference Kijas, Lenstra, Hayes, Boitard, Porto Neto, Cristobal, Servin, McCulloch, Whan, Gietzen, Paiva, Barendse, Ciani, Raadsma, McEwan and Dalrymple2012). Similarly, our PCA analysis separated individual animals according to their geographic origin and domestication history. As was well shown in our analysis of ascertainment bias, in which we removed SNPs in high LD, the higher divergence between Hanwoo and other populations could be a result of bias and uneven sample size (McVean, Reference McVean2009).
The most recent mtDNA survey on the geographical origin of zebu revealed that, among three hypothesized domestication centers (the Indus Valley, Ganges and South India) for zebu, the Indus Valley is the primary center of zebu domestication (Chen et al., Reference Chen, Lin, Baig, Mitra, Lopes, Santos, Magee, Azevedo, Tarroso, Sasazaki, Ostrowski, Mahgoub, Chaudhuri, Zhang, Costa, Royo, Goyache, Luikart, Boivin, Fulle, Mannen, Bradley and Beja-Pereira2010). Bangladeshi zebu (Red Chittagong) are distributed in the Ganges region, which is speculated to be one of the potential centers of domestication for zebu, or a secondary recruitment center for local wild female aurochs into domestic cattle (Chen et al., Reference Chen, Lin, Baig, Mitra, Lopes, Santos, Magee, Azevedo, Tarroso, Sasazaki, Ostrowski, Mahgoub, Chaudhuri, Zhang, Costa, Royo, Goyache, Luikart, Boivin, Fulle, Mannen, Bradley and Beja-Pereira2010). Previously, the level of genetic introgression of Indian zebu (Nellore) and European and Near East taurine breeds into Ethiopian cattle was reported from low-density microsatellite markers (Zerabruk et al., Reference Zerabruk, Li, Kantanen, Olsaker, Ibeagha-Awemu, Erhardt and Vangen2011). Here, we investigated the previously non-quantified influence of Bangladeshi zebu and Asian taurine (Hanwoo) in African cattle populations using high-density genome-wide SNP markers. Our STRUCTURE analysis showed that all Ethiopian cattle populations included ancestry from both indicine and taurine cattle, which is consistent with earlier results (Hanotte et al., Reference Hanotte, Bradley, Ochieng, Verjee, Hill and Rege2002; Freeman et al., Reference Freeman, Meghen, MacHugh, Loftus, Achukwi, Bado, Sauveroche and Bradley2004). This is further supported by PCA results that revealed close clustering of the populations. Model-based clustering showed considerable influence of Asian zebu in Ethiopian cattle populations. However, compared with our results, Zerabruk et al. (Reference Zerabruk, Li, Kantanen, Olsaker, Ibeagha-Awemu, Erhardt and Vangen2011) examined 20 microsatellites and traced a higher proportion (>90%) of Indian zebu (Nellore) influence in northern Ethiopian cattle populations. Ibeagha-Awemu et al. (Reference Ibeagha-Awemu and Erhardt2005) also detected genetic introgression (58% to 74%) of Indian zebu in African zebu. In addition, analyses of recent and worldwide admixture, divergence and ancestry in cattle revealed that indicine ancestry in African cattle is higher in East Africa (74%) (Decker et al., Reference Decker, McKay, Rolf, Kim, Alcalá, Sonstegard, Hanotte, Götherström, Seabury, Praharani, Babar, Regitano, Yildiz, Heaton, Liu, Lei, Reecy, Saif-Ur-Rehman, Schnabel and Taylor2014). The level of South Asian zebu genetic influence was traced in all Ethiopian cattle populations, with less difference seen among the three cattle groups (zebu, sanga and zenga). The stronger influence of zebu ancestry in Ethiopian cattle can be attributed to the replacement of taurine by B. indicus because of adaptation of zebu to harsh environments (tolerance for heat, ticks, drought and poor forage) (Hanotte et al., Reference Hanotte, Bradley, Ochieng, Verjee, Hill and Rege2002; DAGRIS, 2007). Similarly, Hanotte et al. (Reference Hanotte, Tawah, Bradley, Okomo, Verjee, Ochieng and Rege2000) found that the indicine allele dominates in zebu, zenga and sanga populations in the Abyssinian region, whereas the taurine allele is most frequent only among sanga breeds of South Africa and trypanotolerant taurine breeds of West Africa.
We detected substantial taurine introgression in Ethiopian zebu, sanga and zenga cattle. This is explained by the fact that the original African cattle were taurine type and subsequent introgression of zebu into the continent resulted in the creation of populations with different proportions of taurine and indicine backgrounds (Loftus et al., Reference Loftus, MacHugh, Bradley, Sharp and Cunningham1994; Hanotte et al., Reference Hanotte, Bradley, Ochieng, Verjee, Hill and Rege2002). Furthermore, taurine introgression is supported by evidence that no B. indicus mtDNA haplotypes were detected in African cattle breeds; rather, all corresponded to taurine breeds (Loftus et al., Reference Loftus, MacHugh, Bradley, Sharp and Cunningham1994; Bradley et al., Reference Bradley, MacHugh, Cunningham and Loftus1996; Dadi et al., Reference Dadi, Tibbo, Takahashi, Nomura, Hanada and Amano2009). Compared with our results, a weaker European and Near East taurine influence was detected in seven northern Ethiopian cattle populations (Zerabruk et al., Reference Zerabruk, Li, Kantanen, Olsaker, Ibeagha-Awemu, Erhardt and Vangen2011). The influence of taurine introgression in Bangladeshi Red Chittangong and non-descript Deshi zebu was low (estimated as 1%). At all assumed K values, Hanwoo was consistently maintained in a separate cluster, revealing that, for this data set, Hanwoo was the purest taurine. In addition, the genetic influence of Asian zebu on Korean Hanwoo was minimal, which concurs with a previous mtDNA study (Mannen et al., Reference Mannen, Kohno, Nagata, Tsuji, Bradley, Yeo, Nyamsamba, Zagdsuren, Yokohama, Nomura and Amano2004) in which <1% of Hanwoo shared an indicine background. The high zebu introgression into the Sheko population provided evidence that Sheko is undergoing genetic absorption by local cattle populations. The proportion of zebu background detected in Sheko was higher than that observed in West African taurine breeds (Loftus et al., Reference Loftus, Ertugrul, Harba, El-Barodys, Machugh, Park and Bradley1999; Decker et al., Reference Decker, McKay, Rolf, Kim, Alcalá, Sonstegard, Hanotte, Götherström, Seabury, Praharani, Babar, Regitano, Yildiz, Heaton, Liu, Lei, Reecy, Saif-Ur-Rehman, Schnabel and Taylor2014). Previously, a very high frequency of indicine alleles was observed in Sheko cattle (Hanotte et al., Reference Hanotte, Tawah, Bradley, Okomo, Verjee, Ochieng and Rege2000). We detected significant differences in levels of indicine admixture among chromosomes in Ethiopian cattle. This aligns with a recent study by Mbole-Kariuki et al. (Reference Mbole-Kariuki, Sonstegard, Orth, Thumbi, Bronsvoort, Kiara, Toye, Conradie, Jennings, Coetzer, Woolhouse, Hanotte and Tapio2014) who detected significant differences in African taurine and Asian zebu backgrounds among chromosomes, but little variation among animals in East African shorthorn zebu populations that contained the ancient zebu and African taurine admixture. The relatively low level of variability in indicine ancestry among the Ethiopian populations supports the ancient zebu introgression into African cattle breeds.
In summary, this study provides insight into genome-wide genetic diversity, structure and admixture of cattle resources from Africa (Ethiopia) and Asia. Our results clearly revealed that the largest genetic difference occurred between taurine and indicine cattle, whereas Ethiopian cattle populations represent a mosaic of the humped zebu and taurine. The relationships among Ethiopian cattle populations reflect their history of origin and admixture rather than their phenotype-based categorization as zebu, sanga and zenga. Genetic variability is a key component enabling adaptation of natural populations to changing environments (Vali et al., Reference Vali, Einarsson, Waits and Ellegren2008). The unique genetic composition and higher genetic variation observed in Ethiopian cattle populations may provide a valuable resource in the future for adaptation to changing local environments and for implementing population-improvement schemes. Adaptation of these populations to harsh environments is a legacy of natural and human selection. The genome-wide SNP data generated for these populations will facilitate subsequent scanning of genomic regions under selection, and will enable a better understanding of the evolutionary forces that shape the genetic constitution of populations. Sheko cattle, which are the only remnants of East African shorthorn taurine (Rege, Reference Rege1999) populations, are known to adapt to humid climatic conditions and have some level of tolerance for trypanosomiasis (Stein et al., Reference Stein, Ayalew, Rege, Mulatu, Lemecha, Tadesse, Tekle and Philipsson2011). However, as was clearly portrayed in our study, Sheko cattle are undergoing strong genetic admixture with local cattle populations. The loss of this genetic reserve will potentially limit the household well-being of present and future generations of smallholder farmers; therefore, the breed is a valuable genetic resource and deserves urgent action for its conservation. The higher levels of polymorphism in African hybrid populations and Asian zebu suggest that indicine-derived SNPs are more informative for genome-wide and other SNP-based studies.
Acknowledgments
This study was supported by grants from the Africa and International Organization Programs under the National Research Foundation of Korea, from the agenda research grant (PJ009153) and Next-Generation BioGreen 21 Program under the Rural Development Administration. We would like to express our gratitude to International Livestock Research (ILRI), Addis Ababa (Ethiopia), for providing logistical support. Support for M.F.R. provided by the Ensminger Endowment, College of Agriculture and Life Sciences and the Hatch Act of Iowa, is appreciated.
Supplementary material
To view supplementary material for this article, please visit http://dx.doi.org/10.1017/S1751731114002560