Antimicrobial stewardship programs (ASPs) are recommended to promote judicious antibiotic use and minimize development of antimicrobial resistance.Reference Hyun, Hersh and Namtu 1 Maintaining a pediatric ASP, however, requires financial investment in the setting of strained healthcare budgets and competing priorities.Reference Owens, Shorr and Deschambeault 2
Published ASP cost evaluations have been performed in adult healthcare settings. 3 Cost assessments in pediatric populations have estimated savings solely from antimicrobial use,Reference Agwu, Lee and Jain 4 , Reference Metjian, Prasad, Kogon, Coffin and Zaoutis 5 have used estimates from single centers,Reference Sick, Lehmann, Tamma, Lee and Agwu 6 or have only analyzed the cost of salary support for ASP personnel.Reference Sick, Lehmann, Tamma, Lee and Agwu 6 Our estimation of annual investments across ASPs in multiple children’s hospitals establishes a baseline for cost–benefit studies that can be used in budgeting for new ASPs in children’s hospitals. In addition, because ASPs are now included in surveys measuring hospital quality,Reference Olmsted, Geisen and Murphy 7 describing the range of ASP financial support can help frame more precise metrics with which to compare hospitals.
In this study, we surveyed ASP leaders to estimate the annual ASP costs at children’s hospitals in the United States to describe the variation of annual costs incurred from pediatric ASPs.
METHODS
Study Design and Participating Hospitals
We used a cross-sectional survey study design. Study hospitals were recruited from an ongoing quality improvement collaborative, the Sharing Antimicrobial Reports for Pediatric Stewardship (SHARPS), which focuses on establishing best practices for the use of antimicrobials among hospitalized children.Reference Newland, Hersh and Gerber 8
An Internet-based survey was sent to the ASP director or a designated representative at each participating hospital. From November 2014 through February 2015, an initial e-mail was sent to recruit participants, followed by biweekly reminders to nonrespondents. The study team contacted respondents to clarify responses as needed. The Institutional Review Board at Columbia University Medical Center approved this study.
Survey
The survey queried hospital demographic data and current hospital ASP investment in 4 categories: personnel, equipment, software, and other. The personnel section assessed annual support for ASP personnel (ie, physicians, pharmacists, data analysts, and administrative staff) expressed as a percentage of full-time equivalent (FTE). The equipment section inquired about the number and type of equipment purchased for use by ASP personnel (eg, computers) and those purchased to assist stewardship activities (eg, multiplex PCR testing). The software section assessed annual costs for commercially or internally developed software currently being used for the ASP. The last section assessed costs budgeted for travel and education and inquired as to whether the ASP had a formal business plan.
Cost Estimates
To estimate the annual cost of ASP personnel FTE support, we used salary and fringe data estimates from the 2014 American Association of Medical Colleges Faculty survey (ie, for physician salaries) and National Bureau of Labor Statistics (ie, for data regarding pharmacists, data analysts, and administrative support staff). The FTE value from the survey was multiplied by the 50th percentile salary estimate to calculate base salary, and the fringe percentage was subsequently added to this amount to calculate the total salary. To estimate equipment and software costs, we used vendor prices for ancillary equipment (eg, computers) as well as costs directly provided by respondents for software and equipment purchases. All costs are expressed in 2014 US dollars. Aggregated annual costs of maintaining ASPs were calculated by excluding singular “one-time” costs (eg, initial cost of purchasing software).
Statistical Analysis
We described hospital characteristics of respondents (ie, number of beds, region, and years since the initiation of the ASP program). To focus on hospitals with formal ASP leadership, only hospitals providing salary support as percent FTE for a physician and/or pharmacist were included in the final analyses. Costs (median and range) were assessed for each survey category, and aggregate costs were calculated. In exploratory analysis, we calculated Pearson’s correlation coefficient between aggregated annual ASP costs and hospital size.
RESULTS
Study Participants
Of 32 hospitals participating in the SHARPS collaborative at the time of the survey, surveys were completed for 29 hospitals (91%). Respondents were physician leaders (n=14) or pharmacists in consultation with the physician leader (n=15).
Respondents represented hospitals with a median size of 302 beds (interquartile range [IQR], 258–595 beds), and a median ASP duration of 2 years (IQR, 0–10 years). Respondent hospitals were located in the northeastern (n=5), midwestern (n=11), southern (n=8), or western (n=5) regions of the United States. Overall, 3 ASPs that did not provide physician or pharmacy FTE salary support were excluded, leaving 26 hospitals for analysis.
Estimated Costs for ASP Personnel
All 26 ASPs provided salary and fringe support data for physicians (FTE range, 0.1–0.8; median, 0.3), with annual estimated costs ranging from $17,000 to $134,100 (median, $50,700). In total, 22 ASPs (85%) provided support for pharmacists (FTE range, 0.3–1.0; median, 0.5), with cost estimates ranging from $45,700 to $152,300 annually (median, $76,100). In addition, 5 ASPs (19%) provided support for data analysts (FTE range, 0.2–0.5; median, 0.2), costing between $29,100 and $72,800 annually (median, $36,400). No ASPs had dedicated salary support for administrative staff. Total FTE support was more strongly correlated with increasing pharmacist versus physician FTE (correlation coefficient, 0.9 vs 0.6). The distribution of physician versus pharmacist FTE support did not vary significantly with hospital size.
Costs of Software and Equipment
Overall, 5 ASP budgets (19%) included the cost of commercial ASP software between $58,300 and $145,000 (median: $70,000), and 6 ASP budgets (23.1%) included equipment purchased for use by ASP personnel at a median cost of $900 (range, $800–$1,500). No ASPs budgets included the cost of laboratory equipment.
Other Annual Costs
In addition, 4 ASPs (15%) supported education or training for hospital personnel, 7 ASPs (27%) provided travel funds for ASP-related activities, and 1 ASP funded personnel recruitment. Only 10 ASPs (38%) had formal business plans.
Overall Costs and Correlation With Hospital Size
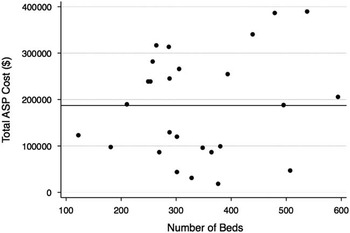
Overall ASP budgeted costs, excluding singular costs, varied from $17,000 to $388,500 (median, $187,400) annually. In our exploratory analysis, there was no significant correlation between hospital size and institutional ASP cost (Pearson correlation coefficient, 0.2) (Figure 1).
Distribution of ASP costs in US dollars and number of hospital beds. The median cost is shown.

DISCUSSION
In this study, we estimated the median annual cost for a pediatric ASP to be $187,400. However, there was substantial variability in institutional financial support among large children’s hospitals with formal stewardship programs, ranging from $17,000 to nearly $400,000 annually. Institutional commitment to an ASP is now included in quality measures used to rank children’s hospitals.Reference Olmsted, Geisen and Murphy 7 However, measures that rely on binary responses lack precision and may not capture potentially significant differences in financial support for ASPs revealed in this study.
The bulk of ASP budgets were dedicated to salary support for core ASP personnel: physicians and pharmacists. While this finding corroborates prior data on investments for pediatric ASPs,Reference Newland, Gerber and Weissman 9 it is unknown whether this allocation of resources remains adequate or whether this investment is balanced against the value derived from ASP activities. However, pediatric ASPs that dedicate financial resources have shown greater reductions in antibiotic use.Reference Hersh, De Lurgio and Thurm 10 Few surveyed ASPs included a written business plan, which is an indicator of institutional financial oversight and sensitivity to cost concerns.
The observed variation in ASP costs was not correlated with hospital size, a potential surrogate for the number of antibiotic stewardship interventions required. This finding may indicate that financial support reflects institutional commitment rather than perceived need based on hospital characteristics. This finding also suggests that ASPs might vary in cost effectiveness, which should be studied further.
This study has limitations. Study participants were mostly freestanding children’s hospitals with relatively recently formed ASPs; therefore, our results may not be generalizable to smaller centers or programs that have been sustained for a longer period.
In addition, our study may not reflect pediatric ASP costs in community hospitals or pediatric centers that are part of larger adult facilities. Because we only included hospitals with FTE support for physicians or pharmacists, these estimates do not reflect ASP costs for hospitals that support stewardship activities without formal programs. Also, personnel costs were estimated indirectly, though we used current regional salary and fringe estimates. We did not include “one-time” implementation costs because most hospitals were unable to provide the costs of ASP initiation.
In conclusion, we observed substantial variation in financial support for ASP across children’s hospitals. Further studies should link ASP costs to reductions in antibiotic use as well as patient outcomes.
ACKNOWLEDGMENTS
Financial support: The SHARPS project is supported by Pfizer and the Joint Commission.
Potential conflicts of interest: All authors report no conflicts of interest relevant to this article.
SUPPLEMENTARY MATERIAL
To view supplementary material for this article (including a list of participants in SHARPS collaborative), please visit http://dx.doi.org/doi:10.1017/ice.2016.62.