



1. Introduction
Adhesion of thin elastic films to substrates occurs in a range of problems in physical chemistry (Bell Reference Bell1978), biology (Bongrand Reference Bongrand1988; Dirks Reference Dirks2014; Butler et al. Reference Butler, Box, Robert and Vella2019), geophysics (Michaut Reference Michaut2011; Kavanagh, Engwell & Martin Reference Kavanagh, Engwell and Martin2018) and engineering situations such as soft robotics (Salem et al. Reference Salem, Gamus, Or and Gat2020) and wafer bonding (Bengtsson, Ljungberg & Vedde Reference Bengtsson, Ljungberg and Vedde1996; Tong & Gösele Reference Tong and Gösele1999; Han, Yu & Wang Reference Han, Yu and Wang2000; Pocius & Dillard Reference Pocius and Dillard2002; Turner, Thouless & Spearing Reference Turner, Thouless and Spearing2004; Rieutord, Bataillou & Moriceau Reference Rieutord, Bataillou and Moriceau2005; Moriceau et al. Reference Moriceau, Rieutord, Fournel, Le Tiec, Di Cioccio, Morales, Charvet and Deguet2011; Navarro et al. Reference Navarro, Bréchet, Moreau, Pardoen, Raskin, Barthelemy and Radu2013; Radisson, Fournel & Charlaix Reference Radisson, Fournel and Charlaix2015). Experimental and theoretical studies of adhesion focus on the microscale physical chemistry of bond formation (Bell Reference Bell1978; Bell, Dembo & Bongrand Reference Bell, Dembo and Bongrand1984), on the mesoscale mechanics of elastic deformation of the film and on the squeeze flow in the gap (Cantat & Misbah Reference Cantat and Misbah1999; Hosoi & Mahadevan Reference Hosoi and Mahadevan2004; Flitton & King Reference Flitton and King2004; Leong & Chiam Reference Leong and Chiam2010; Michaut Reference Michaut2011; Mani, Gopinath & Mahadevan Reference Mani, Gopinath and Mahadevan2012; Pihler-Puzović et al. Reference Pihler-Puzović, Illien, Heil and Juel2012; Longley, Mahadevan & Chaudhury Reference Longley, Mahadevan and Chaudhury2013; Lister, Peng & Neufeld Reference Lister, Peng and Neufeld2013; Hewitt, Balmforth & De Bruyn Reference Hewitt, Balmforth and De Bruyn2015; Ball & Neufeld Reference Ball and Neufeld2018; Juel, Pihler-Puzović & Heil Reference Juel, Pihler-Puzović and Heil2018; Peng & Lister Reference Peng and Lister2020; Wang & Detournay Reference Wang and Detournay2021), all of which are possibly affected by the presence of pre-wetted films, gravity or thermal fluctuations (Carlson Reference Carlson2018; Pedersen et al. Reference Pedersen, Niven, Salez, Dalnoki-Veress and Carlson2019).
In the neighbourhood of the contact line between the elastic film and the substrate, the short-range adhesive interactions can lead to a high pressure that deforms the film and thence a squeeze flow, that in return affects the dynamics of adhesion. Theoretical models of soft adhesion usually focus only on the elastic and adhesive aspects of the process, typically neglecting the hydrodynamics (Springman & Bassani Reference Springman and Bassani2008, Reference Springman and Bassani2009; Rieutord, Rauer & Moriceau Reference Rieutord, Rauer and Moriceau2014). An early notable exception is the experimental and theoretical study of Rieutord et al. (Reference Rieutord, Bataillou and Moriceau2005) that used energetic arguments to determine the steady bonding speed of a silicon wafer as it comes into contact with a substrate, while also providing a scaling law for the local self-similar shape of the contact zone.
Here, we build on these previous works by completely characterizing the transient elastohydrodynamics of a soft adherent sheet. This problem has some similarities to the well studied problem of capillary interfaces seen in moving liquid–vapour contact lines and the dewetting of liquid films influenced by surface tension, which have a rich associated literature (de Gennes Reference de Gennes1985; Eggers Reference Eggers2005; Bonn et al. Reference Bonn, Eggers, Indekeu, Meunier and Rolley2009; Snoeijer & Eggers Reference Snoeijer and Eggers2010; Snoeijer & Andreotti Reference Snoeijer and Andreotti2013). For example, in both the capillary and elastohydrodynamic cases, there is a near-singular behaviour at the contact line that is regularized by short-range effects which takes different forms: e.g. the presence of a pre-wetted layer between the elastic sheet and the substrate (Lister et al. Reference Lister, Peng and Neufeld2013; Hewitt et al. Reference Hewitt, Balmforth and De Bruyn2015; Peng & Lister Reference Peng and Lister2020), a vapour front (Hewitt et al. Reference Hewitt, Balmforth and De Bruyn2015; Ball & Neufeld Reference Ball and Neufeld2018; Wang & Detournay Reference Wang and Detournay2018), elastic fracture (Lister, Skinner & Large Reference Lister, Skinner and Large2019), etc. In the elastohydrodynamic case treated here, we model the microscale physics of adhesion using a van der Waals interaction potential driving the adhesion process between the elastic sheet and the substrate. As we will see, this allows us to characterize the multi-scale dynamics of the onset of adhesion, the steady motion of the moving contact zone and eventually to describe the dynamic shape of the propagating bulge ahead of the contact zone.
2. Mathematical model
2.1. Thin-film elastohydrodynamics
We begin with a description of the dynamics of a long and very wide elastic sheet of length  $\ell$, thickness
 $b$
 $\ll \ell$, separated from a solid substrate by a viscous thin film of density
 $\rho$, viscosity
 $\mu$ and thickness
 $h=h(x,t)$, where the sheet is initially flat with
 $h(x,t=0)\equiv h_{\infty }$ and
 $h_\infty \ll \ell$ (figure 1a). The elastic sheet is attracted to a substrate by an intermolecular adhesion potential
 $\varPhi$ defined between two flat surfaces and consisting of a van der Waals attraction and a strong short-range repulsion given by (Israelachvili Reference Israelachvili2011)
 \begin{equation} \varPhi(h)=\frac A{6{\rm \pi}} \left(\frac{1}{2h^2}-\frac{\sigma^6}{8h^8}\right), \end{equation}
with  $A$ the Hamaker constant, positive because we consider adhesion, and
 $\sigma$ the equilibrium height at which the attractive and the repulsive parts of the resulting disjoining pressure balance each other. Evaluating the energy at this height yields the work of adhesion
 $W=\varPhi (\sigma )=A/16{\rm \pi} \sigma ^2$. We note that altering the form of the Lennard-Jones potential in (2.1) does not change the physical picture as long as the balance leads to a stable static equilibrium, and is discussed further in § 4.2.
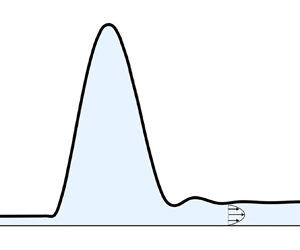
(a) Sketch showing the situation we study (not to scale): an elastic sheet is separated from a solid substrate by a thin viscous film of height  $h=h(x,t)$, initially with uniform height
 $h_\infty$. The disjoining pressure
 $-\varPhi _h$, originating from an intermolecular interaction potential, brings the sheet towards the substrate at an equilibrium distance
 $h_0$ close to
 $\sigma$ (left). This leads to the formation of an adhesion front of length
 $R(t)$ that grows in time. The fluid-filled blister ahead of the adhesion front moves with a constant speed
 $c={\rm d}R/{\rm d}t$. As the adhesion front grows it displaces the viscous fluid into the blister, making its horizontal extent
 $L(t)$ and height
 $H(t)$ grow in time. The dotted rectangle denotes the adhesion front, the small inner region where viscous, elastic and adhesive forces are all comparable in magnitude. (b) Results from a numerical simulation of (2.5) with
 $\hat \sigma = 0.12$ at different times. The sheet is brought into contact with the substrate first at
 $\hat x = 0$ because of the initial profile
 $\hat h(\hat x,\hat t=0)=1-0.1(1-\tanh ^2(\hat x/5))$ that induces a perturbation. After a short transient phase associated with the formation of a contact zone characterized by the waiting time
 $\hat T$, see § 3.1 and (3.1), the adhesion front propagates in time, displacing the fluid into a growing and translating blister.

The adhesive interactions cause the elastic sheet to deform; the balance of transverse forces for long-wavelength deformations of the sheet yields the equation (Landau & Lifshitz Reference Landau and Lifshitz1986)
 \begin{equation} p=Bh_{xxxx}- \varPhi_h, \end{equation}
where  $({\cdot } )_x\equiv \partial ({\cdot } )/\partial x$. Here,
 $p$ is the local pressure along the sheet,
 $-\varPhi _h$ is the disjoining pressure and
 $Bh_{xxxx}$ is the contribution from elasticity for a plate with a bending stiffness
 $B=Eb^3/12(1-\nu ^2)$ (with
 $E$ its Young's modulus and
 $\nu$ its Poisson's ratio). Equation (2.2) is only valid under the assumptions that slopes are small, i.e.
 $h_x^2\ll 1$, and that the deformations of the sheet remain comparable to its thickness, allowing us to neglect geometrical nonlinearities in the shape of the sheet. We further note that we have also neglected stretching effects that are expected to be negligible for cylindrical deformations of elastic sheets that are unconstrained and free at one end; experimental results in elastohydrodynamics with unconstrained sheets show that the theory neglecting stretching is reasonable (Berhanu et al. Reference Berhanu, Guérin, Courrech du Pont, Raoult, Perrier and Michaut2019; Pedersen et al. Reference Pedersen, Niven, Salez, Dalnoki-Veress and Carlson2019).
When the sheet evolves in response to the attractive adhesive interaction which brings it in proximity to the substrate, the interstitial fluid is squeezed out. If the aspect ratio of the gap is small, i.e.  $\epsilon = h_{\infty }/\ell \ll 1$, and the Reynolds number of the flow based on the speed of the adhesion front
 $c$ (discussed next in § 3.2) is small, i.e.
 ${Re}= \epsilon \rho h_{\infty } c/\mu \ll 1$, then the flow in the interstitial gap can be described via lubrication theory and yields the equation (Batchelor Reference Batchelor1967; Oron, Davis & Bankoff Reference Oron, Davis and Bankoff1997)
 $h_t-(h^3p_x/12\mu )_x=0$, which, using (2.2), reads
 \begin{equation} h_t-\left(\frac{h^3}{12\mu}\left(Bh_{xxxx}+\frac{A}{6{\rm \pi}}\left(\frac{1}{h^3}-\frac{\sigma^6}{h^9}\right)\right)_x \right)_x=0, \end{equation}
where we have assumed the no-slip boundary condition for the fluid along the two solid surfaces.
2.2. Scaling and boundary conditions
To scale the variables and reduce the parameters in the system we define the following quantities:
 \begin{align} \hat h= \frac{h}{h_{\infty}}, \quad \hat x= \frac{x}{x_\infty},\quad x_\infty= h_\infty\left(\frac{6 {\rm \pi}B}{A}\right)^{1/4}, \quad \hat t= \frac{t}{\tau_\mu},\quad \tau_{\mu}=\frac{12\mu h_\infty^3B^{1/2}}{\left(A/6{\rm \pi}\right)^{3/2}}. \end{align}
Here, the length scale  $x_\infty$ arises from the balance between the attractive part of the disjoining pressure and the bending pressure at the far-field height
 $h_\infty$. Then the problem is characterized by the single dimensionless number
 $\hat \sigma \equiv \sigma /h_\infty$, the ratio between the equilibrium height
 $\sigma$ and the far-field height
 $h_\infty$, and (2.3) can be rewritten as
 \begin{equation} \hat h_{\hat t}-\left(\hat h^3\left(\hat h_{\hat x \hat x \hat x \hat x}+\left(\frac{1}{\hat h^3}-\frac{\hat \sigma^6}{\hat h^9}\right)\right)_{\hat x} \right)_{\hat x}=0. \end{equation}
In the rest of the paper, we will present results in the text in both dimensional and scaled form, but all figures will be based solely on scaled quantities. While the characteristic longitudinal scale is expected to be  $x_\infty$, near the effective contact line, i.e. the zone where the sheet deforms substantially from its flat state owing to fluid pressure, we expect the adhesive equilibrium height
 $\sigma$ to be relevant. As we will see later, this leads to another natural lateral scale
 $l_c=\hat \sigma x_\infty = \sigma (6{\rm \pi} B/A)^{1/4}$, so that the extent of the adhesion front scales as
 $\sigma (B/A)^{1/4}$. As
 $\hat \sigma \rightarrow 0$, the zone becomes very narrow with an accompanying singular behaviour in the dynamics of the contact line. We note, however, that the slope of the sheet at the apparent contact line scales as
 $h_x \sim \sigma /l_c \sim (A/B)^{1/4}\ll 1$, and is thus consistent with the long-wavelength approximation used to derive the governing equation (2.3) and (2.5).
In order to complete the problem associated with (2.5), we need to prescribe a total of six boundary conditions. We assume symmetry at the centre of the sheet  $\hat {x}=0$, so that
 \begin{equation} {\hat h}_{{\hat x}}({\hat x}=0,{\hat t})= {\hat h}_{{\hat x}{\hat x}{\hat x}}({\hat x}=0,{\hat t})= {\hat p}_{{\hat x}}({\hat x}=0,{\hat t}) =0, \end{equation}
and that the right (and left) ends of the sheet are flat and consistent with the initial conditions, so that as  $\hat x\rightarrow \infty$
 $$\begin{gather} {\hat h}_{ \hat{x}}( \hat{x}\rightarrow\infty,{\hat t})={\hat h}_{{\hat x}}({\hat x}\rightarrow\infty,{\hat t}=0), \quad {\hat h}_{{\hat x}{\hat x}}({\hat x}\rightarrow\infty, {\hat t})={\hat h}_{{\hat x}{\hat x}}({\hat x}\rightarrow\infty,{\hat t}=0), \end{gather}$$
 $$\begin{gather}{\hat p}({\hat x}\rightarrow\infty,{\hat t}) = {\hat \varPhi}_{{\hat h}}({\hat h}({\hat x}\rightarrow\infty,{\hat t}=0)). \end{gather}$$
The mathematical model (2.5)–(2.7) provides a compact formulation of the elastohydrodynamics coupling the microscopic physics of adhesion to elastic film deformations and interstitial fluid flow.
2.3. Numerical implementation
To characterize the adhesion dynamics we solve numerically (2.5) with boundary conditions (2.6) and (2.7). We use a finite element method with linear elements for  $\hat h$,
 $\hat h_{\hat x \hat x}$ and
 $\hat h_{\hat x \hat x \hat x \hat x}$ coupled with a first-order and implicit time integration scheme. The domain size (sheet length) is made large enough so that it does not affect the numerical results, i.e. we ensure that the boundary of the domain remains far enough away from the peeling front, at least 100 dimensionless units, so as to not affect its dynamics. The adhesion front is well resolved with
 $\Delta \hat x \lesssim \hat l_c/50$ there, and we use an adaptive mesh refinement method to limit the number of degrees of freedom in the other regions. We mainly focus on an initially flat sheet, starting with an initial condition
 $\hat h(\hat x,\hat t=0)=1-0.1(1-\tanh (\hat x/\beta )^2)$ in order to induce a perturbation as a small dip that triggers adhesion at
 $\hat {x}=0$. We verified that the results of the simulations are independent of the size of the perturbation
 $\beta$ once adhesion has been triggered, and unless otherwise noted we used
 $\beta =2$. We also considered two additional initial and far-field profiles, a linear one and a quadratic one, which we discuss further in § 4.3.
3. Analysis
In figure 1(b) we show that, following the onset of adhesion at short times, a fluid-filled blister forms and then propagates steadily as the adhesive front  $R(t)$ moves and the blister grows simultaneously. We now turn to discuss these different phenomena in turn.
3.1. Waiting time estimate
When the disjoining pressure  $-\varPhi _h$ brings the sheet closer to the substrate non-uniformly, the resulting pressure gradients cause fluid to be squeezed longitudinally, bringing the sheet even closer to the substrate until it locally reaches a height consistent with the equilibrium height
 $\sigma$. We define this as the time for the onset of adhesive contact
 $\tau _w$. Carlson & Mahadevan (Reference Carlson and Mahadevan2016) showed that if there were no repulsive part to the intermolecular potential, i.e. in the limit
 $\hat \sigma \rightarrow 0$, the flat state is linearly unstable to long-wavelength perturbations, and further that contact would occur as a finite-time singularity with
 $h(x=0,t)\sim h_\infty (1-t/\tau _w)^{1/3}$, with
 $\tau _w \sim \tau _\mu$ the viscous time scale defined in (2.4a–e). In the present situation, a linear stability analysis of (2.5) with a perturbation
 $\hat h(\hat x, \hat t)=1+\hat \varepsilon \exp (i\hat k\hat x+ \hat \omega \hat t),~|\hat \varepsilon |\ll 1$, yields the dispersion relation
 ${\hat \omega =-\hat k^2 (\hat k^4-3+9\hat \sigma ^{6})}$, and we expect the repulsive part of the disjoining pressure to only play a role very close to the substrate, with the adhesion time following the scaling law
 $\tau _w\sim \tau _\mu$ independently of
 $\hat \sigma$:
 \begin{equation} \tau_w = \hat T \frac{12 \mu h_{\infty}^3 B^{1/2}}{(A/6{\rm \pi})^{3/2}}, \end{equation}
where the dimensionless adhesion time  $\hat T$ is a constant. In figure 2, we show that our numerical simulations follow this scaling relation. While the value of
 $\hat T$ depends on the initial perturbation to the flat sheet, for
 $\hat t \gg \hat T$, the evolution of the system is independent of initial conditions. It may be useful to compare (3.1) with the capillary time for the rupture of a thin liquid film. In this situation, the rupture time scales as
 $\mu h_{\infty }^5 \gamma _{LV} /A^2$ (Zhang & Lister Reference Zhang and Lister1999; Carlson et al. Reference Carlson, Kim, Amberg and Stone2013), where
 $\gamma _{LV}$ is the liquid–vapour surface tension, and shows a stronger dependence on both the Hamaker constant
 $A$ and the far-field height
 $h_{\infty }$, reflecting the intuition that elastohydrodynamic touchdown is slowed down by the effectively larger ‘stiffness’ (at short length scales) of an elastic sheet relative to a capillary interface.
(a) Evolution of the height of the elastic sheet at  $\hat x=0$ obtained by solving (2.5) with an initial perturbation
 $\hat h(\hat x,\hat t=0)=1-0.1(1-\tanh (\hat x/\beta )^2)$, with
 $\beta =5$, and for three values of
 $\hat \sigma$. For
 $\hat {t}<\hat {T}=2.03$ the different curves cannot be distinguished. The solid line represents the scaling
 $\hat h(\hat x=0,\hat t)\sim (1-\hat t/\hat T)^{1/3}$ expected for
 $\hat {\sigma }\ll 1$, with a fitted prefactor. (b) Waiting time for onset of adhesion for two values of the size
 $\beta$ of the initial perturbation. The markers represent numerical simulations (squares:
 $\beta =2$; circles:
 $\beta =5$), and the solid lines represent constant values of
 $\hat T$. We extract the waiting time from the numerical simulations by defining it as the time it takes for
 $\hat {h}(\hat {x}=0,\hat {t})$ to go from the initial condition down to
 $1.1 \hat {\sigma }$.

3.2. Scale and speed of the adhesion front
After first contact, once  $h(x=0,t) \simeq \sigma$, the adhesion front grows longitudinally and a localized fluid-filled blister starts to move rightwards (a symmetric one grows leftwards as well). Defining the apparent contact line as the point of maximum curvature, i.e.
 $R(t)= \arg \max _x(h_{xx}(x,t))$, in figure 3(a) we show our numerical simulations that are consistent with
 $R(t)$ moving at a constant speed
 $c={\rm d}R/{\rm d}t$. To characterize the speed of the contact line, we first consider the integrated viscous dissipation rate. In figure 3(b), we show that the viscous power per unit width
 $\int _0^{+\infty } \int _0^h \mu u_y^2\,{\rm d}y\,{\rm d} x = \int _0^{+\infty } h^3(x,t)p_x^2(x,t)\,{\rm d} x/12\mu$ becomes time independent at long times, where
 $u(x,y)$ is the Poiseuille velocity profile (Batchelor Reference Batchelor1967; Oron et al. Reference Oron, Davis and Bankoff1997) used to derive (2.3). At a scaling level, the viscous dissipation scales as
 $\mu (c/\sigma )^2 \varOmega$, where
 $\varOmega \sim \sigma l_c$. Balancing the driving adhesive power per unit width
 $cA/\sigma ^2$ with the viscous power
 $\mu c^2 l_c/\sigma$ then yields
 $c\sim A^{5/4}/\mu \sigma ^2 B^{1/4}$. We note that this last scaling is the same as the one given by Rieutord et al. (Reference Rieutord, Bataillou and Moriceau2005) and Navarro et al. (Reference Navarro, Bréchet, Moreau, Pardoen, Raskin, Barthelemy and Radu2013), but with
 $\sigma$ replaced by a molecular mean free path used as an arbitrary cutoff length, unlike in our case, where it is the equilibrium height arising naturally from the intermolecular potential
 $\varPhi$. Following the brief discussion in § 2.2, if we use the relevant height scale in the adhesion front
 $\sigma$ and the relevant length scale
 $l_c$, this leads to the following dimensionless quantities:
 \begin{equation} \tilde h = \frac{h}{\sigma}, \quad \tilde \eta = \frac{\eta}{l_c},\quad l_c=\sigma \left(\frac{B}{A/6{\rm \pi}}\right)^{1/4}, \quad \tilde t = \frac t{\hat \sigma^3 \tau_\mu }, \end{equation}
it follows that the speed of the adhesion front is
 \begin{equation} c= \tilde{C} \frac{(A/6{\rm \pi})^{5/4}}{12 \mu \sigma^2 B^{1/4}}, \quad \hat{c}=\tilde{C} {\hat{\sigma}^{{-}2}}, \end{equation}
where the dimensionless constant  $\tilde C$ is yet to be determined.
Data from a numerical simulation of (2.5) with  $~\hat \sigma =0.12$. (a) Growth of the adhesion front
 $\hat R(\hat t)$. For
 $\hat {t}>\hat T$,
 $\hat {R}(\hat {t})$ becomes linear. The inset shows the behaviour for
 $\hat {t}\approx \hat {T}$, highlighting the fact that the constant speed (dashed line) is quickly reached. (b) The instantaneous viscous dissipation power,
 $\int _0^{+\infty } \hat {h}^3(\hat x,\hat t)\hat {p}_{\hat x}^2(\hat x, \hat t)\,{\rm d}\hat x$, shows a sharp increase at the onset of adhesion and then evolves towards a constant value.

Figure 4(a) shows that our simulations indeed follow (3.3a,b). To go beyond this scaling analysis and predict the value of the constant  $\tilde C$, we look for a travelling wave solution as in related problems (Lister et al. Reference Lister, Peng and Neufeld2013; Wang & Detournay Reference Wang and Detournay2021). Letting
 $h(x,t)=f(\eta )$ with
 $\eta =x-ct$ transforms the governing partial differential equation (2.3) into an ordinary differential equation, which we make dimensionless (3.2a–d) and integrate once by introducing the constant
 $h_0=\sigma \tilde {h}_0$ such that
 $h\rightarrow h_0$ as
 $\eta \rightarrow -\infty$. We note that
 $h_0$ is not necessarily equal to
 $\sigma$, even though we expect the two values to be close, since the pressure gradient vanishes for any constant height profile. This leads to the nonlinear ordinary differential equation
 \begin{equation} \tilde{C}(\,\tilde{f}-\tilde{h}_0) + \tilde{f}^3\left(\tilde{f}^{\prime\prime\prime\prime}+\frac{1}{\tilde{f}^3}-\frac{1}{\tilde{f}^9}\right)'=0, \end{equation}
with  $(.)'={\rm d}(.)/{\rm d}\tilde \eta$. This fifth-order nonlinear ordinary differential equation with two unknown parameters,
 $\tilde h_0$ and
 $\tilde C$, is subject to a pair of constraints. The first is that as
 $\tilde \eta \rightarrow -\infty$,
 $\tilde f\rightarrow \tilde h_0$. The second is that, when
 $\tilde \eta \rightarrow +\infty$, (3.4) simplifies to
 $\tilde {C}\tilde {f} \!+ \tilde {f}^3\tilde {f}^{\prime \prime \prime \prime \prime }=0$ and we expect a self-similar solution of the form
 $\tilde f(\tilde \eta ) \sim (243/280)^{1/3} \tilde C^{1/3} \tilde \eta ^{5/3}$.
(a) Speed  $\hat c$ of the adhesion front for different initial conditions and far-field profiles (discussed in § 4.3), with
 $\hat \sigma =0.12, 0.09, 0.06, 0.03, 0.01$ and obtained by solving (2.5). The dashed line represents (3.3a,b), with the prefactor 0.281 obtained by solving (3.4). (b) Same data normalized according to (3.2a–d), highlighting the better agreement between numerical simulations and theory as
 $\hat \sigma$ decreases.

Using these conditions, we solve numerically (3.4) using the bvp4c routine implemented in MATLAB (see Appendix A for details) and find that  $\tilde C = 0.281$,
 $\tilde h_0=1.017$. The maximum curvature of the profile is
 $\tilde \kappa _{max}=0.551$ and is discussed further in § 6. Figure 4 shows that the value of
 $\tilde C$ is qualitatively consistent with our simulations; although there are deviations of up to
 $40\,\%$. This disagreement likely comes from the finite ratio between the size of the adhesion front and the domain size leading to a lack of scale separation; indeed, as
 $\hat \sigma$ becomes smaller, we see a tendency towards the asymptotic state consistent with the self-similar dynamics. In figure 5(a,b), we show the comparison of the height profile from the numerical simulation of the reduced equation (3.4) and the profile obtained from the full partial differential equation (2.5) with
 $\hat \sigma =0.12$. While the overall agreement is good, it may seem surprising that
 ${h}_0$ differs from
 $\sigma$, even if by only
 $2\,\%$. To understand this, we note that the dispersion relation discussed in § 3.1 shows that a profile with constant height
 $h_0$ is linearly stable if
 $h_0/\sigma <3^{1/6}\simeq 1.20$. As a point of comparison with the much better studied case of dewetting of liquid films, we note that there too the height ahead of the moving contact line differs slightly from the equilibrium height (Eggers Reference Eggers2005).
(a) Comparisons of the height profile between the asymptotic results (lines) and a numerical simulation of (2.5) with  $\hat \sigma = 0.12$ at time
 $\hat t-\hat T= 27.34$ (crosses). Markers are spaced to facilitate readability and do not correspond to the numerical grid. Other panels show details of each region in a travelling reference frame
 $\eta$, rescaled differently in each region according to the non-dimensionalizations discussed in the text. (b) Adhesion region. The line is the numerical solution of (3.4). (c) Blister. The line is (3.5), where
 $\hat H$ and
 $\hat L$ have been extracted from the numerical profile. (d) Peeling front. The line is the numerical solution of (3.9).

3.3. Shape, size and dynamics of fluid-filled blister
Having determined the waiting time  $\tau _w$, the speed
 $c$ of the apparent contact line and the shape of the adhesion front, we now turn to a description of the blister developing ahead of the adhesion front. We characterize the blister in terms of its maximum height
 $H(t)$ and width
 $L(t)$. We expect that once the blister has grown sufficiently with
 $H(t)\gg h_{\infty }$, its shape becomes independent of the local adhesion, even as it slowly spreads while gathering fluid. To describe the shape of the blister, we adapt the analysis of related problems by Peng et al. (Reference Peng, Pihler-Puzovic, Juel, Heil and Lister2015) and Wang & Detournay (Reference Wang and Detournay2021). In a moving frame with
 $\eta =x-ct$, the height profile of the blister
 $h_b(\eta )$ can be obtained by integrating (2.2) and considering a spatially invariant pressure profile
 $p\simeq B h_{\eta \eta \eta \eta }$, neglecting the van der Waals interaction. Using clamped boundary conditions, i.e.
 $h=0,h_\eta =0$ at the apparent contact line defined as
 $\eta =0$ and at the peeling front
 $\eta =L(t)$ then gives
 \begin{equation} h_b(\eta,t)=16\frac{H(t)}{L^4(t)}\eta^2\left(L(t)-\eta\right)^2. \end{equation}
To determine the height  $H(t)$ and width
 $L(t)$ of the blister we impose fluid mass conservation and a shape continuity condition at the peeling front. Assuming that most of the displaced fluid accumulates in the blister and that the volume of the remaining fluid between the sheet and the substrate after adhesion is negligible, i.e.
 $\sigma / h_0 \simeq \hat \sigma \ll 1$, we can write
 \begin{equation} \int_{0}^{L(t)} h_b(\eta,t)\,{\rm d}\eta = \int_0^{ct} h(x,0)\,{\rm d} x. \end{equation}
For an initially flat sheet,  $\int _0^{ct} h(x,0){\rm d}\kern 0.05em x=cth_\infty$. Then using (3.5), we find that (3.6) simplifies to
 $16 H(t)L(t) / 30 = cth_\infty$.
At  $\eta =L(t)$, the solution within the blister must be consistent with the dynamics of the peeling front that is observed numerically in figure 5(a,d). We assume that the speed
 $c$ of the adhesion (healing) front is the same as that of the peeling front, i.e. that the blister moves much faster than its lateral growth rate
 ${\rm d}L/{\rm d}t$. At the peeling front, the far-field height
 $h_\infty$ and the peeling length
 $L_p=(B h_\infty ^3/12\mu c)^{1/5}$ conspire to yield a local curvature that scales as
 $\kappa \sim h_\infty /L_p^2$, which then gives (up to a prefactor)
 \begin{equation} c=\frac{Bh^{\frac{1}{2}}_{\infty}}{12\mu}\left(\frac{\kappa}{1.35}\right)^{{5}/{2}}. \end{equation}
Here, the prefactor 1.35 comes from the matching procedure between the blister and the peeling front first carried out by Lister et al. (Reference Lister, Peng and Neufeld2013), and which we briefly discuss next in § 3.4.
Since the adhesion speed is determined by the behaviour in the adhesion zone outside of the blister, and is given by (3.3a,b), we interpret (3.7) as an expression that determines the curvature as a function of the speed. Using the blister profile (3.5) yields the curvature at the peeling front  $\kappa ={h_b}_{\eta \eta }(\eta =L(t))= 32 H(t) / L^2(t)$. Substituting this value in (3.7) gives a second relation between
 $H(t)$ and
 $L(t)$. Together with (3.6) these relations yield
 \begin{align} H(t)&=0.53\left(\frac{12\mu}{B}\right)^{2/15}h_{\infty}^{3/5}c^{4/5}t^{2/3}, \quad \hat H(\hat t)=0.53 \hat c^{4/5} \hat{t}^{2/3} \end{align}
 \begin{align} L(t)&=3.54\left(\frac{B}{12\mu}\right)^{2/15}h_\infty^{2/5}c^{1/5}t^{1/3}, \quad \hat L(\hat t)=3.54 \hat c^{1/5} \hat{t}^{1/3}. \end{align}
We note that the assumption that the healing and peeling fronts move at the same speed translates to the condition  ${\rm d}L/{\rm d}t \ll c$, and is consistent with (3.8b) that predicts
 ${\rm d}L/{\rm d}t\rightarrow 0$ at long times while
 $c$ remains constant. Figure 6 shows that the height
 $H(t)$ and lateral extent
 $L(t)$ obtained from numerical simulations are indeed close to (3.8), and figure 5(c) shows that the quartic profile (3.5) describes the blister well, validating the hypothesis of spatially invariant bending pressure within it (Flitton & King Reference Flitton and King2004; Lister et al. Reference Lister, Peng and Neufeld2013).
Characterization of the blister with  $\hat \sigma =0.12$, showing the time evolution of (a) its maximal height
 $\hat H$ and (b) its lateral extent
 $\hat L$. Solid lines represent numerical solutions of (2.5) and dotted lines are the predictions (3.8). Numerically, we define
 $\hat H$ as the maximal height of the sheet and
 $\hat L$ as the distance between the two local minima of
 $\hat {h}$ surrounding the point of maximal height. The time is shifted by the adhesion time because the analysis of the blister is only relevant once a blister is actually formed.

3.4. Peeling front mechanics
In the region ahead of the blister, the peeling front, following the analysis of Lister et al. (Reference Lister, Peng and Neufeld2013) for a similar problem, we neglect van der Waals forces ahead of the blister and look for a travelling wave solution  $h(x,t)=\psi (\eta )$ to (2.3). This leads to the ordinary differential equation
 $c\psi ^\prime + (B/12\mu )\psi ^3\psi ^{\prime \prime \prime \prime \prime }=0$. Ahead of the blister, the scale of the height is
 $h_\infty$ and we therefore introduce the non-dimensionalization
 $\psi ^\star =\psi /h_\infty =\hat \psi$ and
 $\eta ^\star =\eta /L_p$, with
 $L_p=(B h_\infty ^3/12\mu c)^{1/5}$ a peeling length scale. This simplifies the above equation to
 \begin{equation} \psi^\star{+}\psi^{{\star} 3} \psi^{{\star} \prime\prime\prime\prime\prime}=1 \end{equation}
for the height profile ahead of the blister and is supplemented with the boundary conditions discussed by Lister et al. (Reference Lister, Peng and Neufeld2013), namely, imposing a constant curvature as  $\eta ^\star \rightarrow -\infty$, towards the blister, and a flat profile
 $\psi ^\star \rightarrow 1$ as
 $\eta ^\star \rightarrow +\infty$. In figure 5(d), we show the results obtained by solving the (3.9) using the bvp4c routine implemented in MATLAB and the numerical solution of the complete partial differential equation (2.5) and see good agreement between the two.
4. Consistency and robustness of different regimes/regions in elastohydrodynamic adhesion
The analysis presented in § 3 describes the whole shape of the elastic sheet. It shows different regions where the relative balances between adhesion, elasticity and fluid-driven pressure are a function of the scale separation implied by the lubrication dynamics of the squeeze flows in the narrow gap between the sheet and the substrate. We now consider the robustness of our results to variations in the details of the balances.
4.1. Nature of the matching between the adhesion front and the blister
The solution in the adhesion front described in § 3.2 and that of the blister described in § 3.3 need to be consistent, and so must match in the intermediate region connecting them. We find that in the adhesion front, as  $\tilde \eta \rightarrow +\infty$ (going towards the blister), the curvature
 $\tilde \kappa \rightarrow 0$ since the height profile evolves as
 $\tilde \eta ^{5/3}$. In contrast, our analysis of the solution in the blister predicts that, as
 $\eta \rightarrow 0$ (going towards the adhesion front), the curvature is given by (3.7), i.e.
 $\kappa =1.35(12\mu c/Bh_\infty )^{2/5}$. In dimensionless units, the curvature in the blister zone is then
 $\tilde \kappa = 1.35(\sigma /h_\infty )^{1/5}=1.35\hat \sigma ^{1/5}$, and is therefore consistent with the curvature in the adhesion front when
 $1.35 \hat \sigma ^{1/5}\rightarrow 0.$ This very restrictive criterion explains why the value of the prefactor in the adhesion speed in (3.3a,b) differs from the one observed numerically for values of
 $\hat \sigma$ that are reasonable to allow for precise numerical simulations of (2.5). Indeed, we have presented results for
 $\hat \sigma \in [ 0.12 , 0.01]$, corresponding to
 $1.35 \hat \sigma ^{1/5} \in [0.88, 0.54]$, respectively. In Appendix B, we provide a brief discussion of the matching conditions connecting the adhesion front and the blister.
4.2. Role of intermolecular potential
While we have chosen the Lennard-Jones potential (2.1) for this study, this is but one choice of many potentials for intermolecular interactions. The physical picture we have described here is robust to alterations of the functional form of the potential, as long as it is a combination of a long-range adhesion and a short-range repulsion. None of the scaling analyses we have discussed depend on the functional form of the repulsion; only the prefactors of the quantities characterizing the adhesion front depend on it. We have verified (results not presented here) that performing simulations of (2.5) with the same attractive potential as in (2.1) but replacing the repulsive part by  $\sigma ^3/5h^5$ leads to the same behaviour, albeit with different prefactors for the adhesion speed, height at the tail and maximum curvature. These prefactors can be obtained in the limit
 $\hat {\sigma } \rightarrow 0$ by adapting the boundary value problem (3.4) appropriately. For example, going from a repulsion potential that scales as
 $1/h^8$ to a weaker one evolving as
 $1/h^5$ decreases the adhesion speed
 $\tilde C$ from
 $0.281$ to
 $0.212$, decreases the maximum curvature
 $\tilde \kappa _{\rm max}$ from
 $0.551$ to
 $0.478$ and increases the height at the adhesion tail
 $\tilde h_0$ from
 $1.017$ to
 $1.026$, but all our scaling results remain robust to this change.
4.3. Role of far-field conditions
The analysis of § 3.2 to characterize the adhesion front is independent of the far-field conditions and especially the height as long as  $1.35\hat \sigma ^{1/5} \ll 1$. Simulations of (2.5) with an initial condition for the height as a linear or parabolic profile,
 $\hat h(\hat x,\hat t=0)=0.9+\hat x/10$ and
 $\hat h(\hat x,\hat t=0)=0.9+\hat x^2/25$, respectively, indeed show a front that continues to propagate with a constant speed, with a value close to the one predicted (figure 4). However, the analysis of § 3.3 and § 3.4 for the blister shape, size and the dynamics of the peeling region needs to be adapted slightly. In particular, the relation (3.7) between the speed and curvature will be modified by the change in the far-field profile, and the assumption
 ${\rm d}L/{\rm d}t \ll c$ may not always hold anymore; we leave these studies for the future.
4.4. Role of substrate roughness
Our model of adhesion assumes a perfectly smooth substrate and sheet, and neglects the effects of surface roughness. At the scales involved in such instances as the adhesive bonding of silicone wafers, substrate roughness can lead to contact at asperities (Rieutord et al. Reference Rieutord, Moriceau, Beneyton, Capello, Morales and Charvet2006; Moriceau et al. Reference Moriceau, Rieutord, Fournel, Le Tiec, Di Cioccio, Morales, Charvet and Deguet2011) or can even induce capillary condensation due to the Kelvin effect (de Boer & de Boer Reference de Boer and de Boer2007; Fournel et al. Reference Fournel, Martin-Cocher, Radisson, Larrey, Beche, Morales, Delean, Rieutord and Moriceau2015). These effects are challenging to model in our lubrication model, which relies on a long-wavelength analysis. Nevertheless, the scaling result (3.3a,b) for the adhesion speed and the profile  $\tilde f(\tilde \eta )\sim \tilde \eta ^{5/3}$ discussed in § 3.2 are consistent with experimental results (Rieutord et al. Reference Rieutord, Bataillou and Moriceau2005; Navarro et al. Reference Navarro, Bréchet, Moreau, Pardoen, Raskin, Barthelemy and Radu2013), with the qualification that roughness leads to a modified value of the work of adhesion
 $W=A/16{\rm \pi} \sigma ^2$.
5. Effective contact line dynamics
The question of the singular nature of the deformations of the sheet in the adhesion front is similar to but different from that seen in dewetting fluid films. To characterize this, following (3.2a–d), the slope of the sheet scales as  $h_x\sim \sigma /l_c \sim (A/B)^{1/4} \sim \sigma ^{1/2} (W/B)^{1/4}$ and the curvature scales as
 $h_{xx} \sim \sigma /l_c^2\sim (A/B)^{1/2}\sigma ^{-1} \sim (W/B)^{1/2}$. We see that the curvature of the sheet diverges in the contact zone as
 $\hat \sigma \rightarrow 0$, but is suppressed over a region of size
 $l_c \sim \sigma (B/A)^{1/4} \sim \sigma ^{1/2} (B/W)^{1/4}$ determined by the balance elastic bending and the attractive part of the disjoining pressure. This scaling is consistent with the analysis of § 3.2 predicting the maximum curvature to be
 $\kappa _{\rm max}=0.551 (A/6{\rm \pi} B \sigma )^{1/2}$. Figure 7 shows good agreement between the numerical simulations and this prediction, and highlights the near-singular nature of the curvature.
Characterization of the elastohydrodynamic contact zone. The maximum curvature in the contact zone,  $\hat \kappa _{\rm max}$, is shown for different values of
 $\hat \sigma$ and different initial profiles, illustrating the singular nature of the curvature as
 $\hat \sigma \rightarrow 0$. Results are shown by extracting the maximum curvature of the different simulations of (2.5) at
 $\hat R=100$. The prefactor 0.551 is obtained by solving the boundary value problem (3.4) and matches well with numerical results. Inset: spatial profile of the curvature with
 $\hat \sigma =0.12$.

In the limit of contact,  $\hat \sigma = \sigma /h_\infty \rightarrow 0$ while keeping a fixed value of the work of adhesion
 $W=A/16{\rm \pi} \sigma ^2$, the slope
 $h_x$ and adhesion speed
 $c$ converge to zero while the curvature
 $h_{xx}$ scales as
 $(W/B)^{1/2}$. This is in agreement with the boundary conditions for an adherent sheet, where the following applies at the stationary elastic contact line (Obreimoff Reference Obreimoff1930; Landau & Lifshitz Reference Landau and Lifshitz1986; Majidi & Adams Reference Majidi and Adams2009):
 $h(R)=0$,
 $h_{x}(R)=0$,
 $h_{xx}(R)=({2W}/{B})^{1/2}$. However, in the dynamic case treated in this study, this condition is replaced by a condition on the speed of the apparent contact line (3.3a,b). These results might be contrasted with the analogous problem of describing static and dynamic contact lines in interfacial hydrodynamics where a static contact line has a constant contact angle, whereas a dynamic contact line has a contact angle that is a function of its speed (de Gennes Reference de Gennes1985; Bonn et al. Reference Bonn, Eggers, Indekeu, Meunier and Rolley2009; Snoeijer & Andreotti Reference Snoeijer and Andreotti2013).
6. Conclusions
Our theoretical study of the viscously limited elastohydrodynamics of adherent sheets captures a range of different processes of dynamical adhesion, from the short-time onset of adhesion to the long-time dynamics associated with a steadily propagating adhesion front. A simple mathematical model provides a compact formulation that naturally couples the microscopic physics at the apparent elastic contact line and the macroscopic physics associated with elastic deformation and fluid flow, complementing earlier analyses of the problem. Numerical simulations reveal different regions of the sheet: an adherent zone  $x< R(t)$ at constant height
 $h_0 \simeq \sigma$, an inner contact zone where viscous flow, elastic bending and microscale adhesion are all equally important and an outer region with
 $h\gg \sigma$ where the sheet is described by viscous flow and elastic bending. An asymptotic similarity analysis of the governing partial differential equation allows us to describe the full shape of the sheet and the speed of the adhesion front. In addition, we have derived the effective boundary conditions for the dynamic apparent elastic contact line, which highlights its singular nature and distinguishes it from analogous contact line conditions for a static sheet.
Just as high resolution total internal reflection fluorescence microscopy allowed for a more detailed view of the dynamics of liquid contact lines (Snoeijer & Andreotti Reference Snoeijer and Andreotti2013), we hope that our theoretical study might engender further experimental investigation of the nature of the elastohydrodynamic contact line that arises in a wide range of problems where elastic interfaces adhere to solid substrates in fluid environments, and for which the actual physical mechanisms that regularize the contact line singularity in experiments can be hard to discriminate (Berhanu et al. Reference Berhanu, Guérin, Courrech du Pont, Raoult, Perrier and Michaut2019).
Acknowledgements
We are grateful to anonymous reviewers who helped us improved the manuscript and in particular suggested the calculation sketched out in Appendix B.
Funding
A.C and S.P. acknowledge financial support from the Research Council of Norway through the program NANO2021, project number 301138, L.M. acknowledges partial financial support from the US NSF DMR 1922321 and MRSEC DMR 2011754.
Declaration of interests
The authors report no conflict of interest.
Appendix A. Solution in the adhesion front
The fifth-order differential equation (3.4) for the function  $\tilde f$ and the two unknowns
 $\tilde C$ and
 $\tilde h_0$ is well posed when subject to the boundary conditions discussed below, i.e. these boundary conditions correspond to seven constraints.
As  $\tilde \eta \rightarrow -\infty$,
 $\tilde f \rightarrow \tilde h_0$; by letting
 $\tilde f(\tilde \eta )=\tilde h_0 (1+\tilde g(\tilde \eta ))$ and substituting into (2.3) to perform a linear stability analysis of the flat state, we find that
 $\tilde g$ satisfies a linear differential equation whose solutions are linear combinations of the family of functions
 $\tilde \eta \rightarrow \exp (\omega _k \tilde \eta )$, where the
 $(\omega _k)_{k=1\ldots 5}$ are the roots of the polynomial equation
 ${\omega ^5+(9\tilde h_0^{-10}-3\tilde h_0^{-4})\omega + \tilde C \tilde h_0^{-3} = 0}$. We observe numerically that, for all positive
 $\tilde h_0$ and
 $\tilde C$, this equation always has exactly three solutions whose real parts are negative. The coefficients in
 $\tilde g$ associated with the latter must vanish; this shows that the asymptotic behaviour of
 $\tilde f$ as
 $\tilde \eta \rightarrow -\infty$ sets three constraints.
As  $\tilde \eta \rightarrow + \infty$, the height of the sheet grows and we expect that
 $\tilde f(\tilde \eta ) \gg \tilde h_0$ and that the contribution of the van der Waals potential becomes negligible. For large enough
 $\tilde \eta$, (3.4) then becomes approximately
 $\tilde f^3 \tilde f''''' + \tilde C \tilde f=0$. In the neighbourhood of the adhesion front, we expect to observe a self-similar, scale-invariant behaviour if there is a proper scale separation between the adhesion front and the rest of the sheet. The only power-law solution to
 $\tilde f^3 \tilde f''''' + \tilde C \tilde f=0$ is
 $\tilde F(\tilde \eta )=(243/280)^{1/3} \tilde C ^{1/3} \tilde \eta ^{5/3}$, previously discussed by Rieutord et al. (Reference Rieutord, Bataillou and Moriceau2005). Hence, we seek a solution to (3.4) whose asymptotic behaviour as
 $\tilde \eta \rightarrow +\infty$ is
 $\tilde f(\tilde \eta ) \sim \tilde F (\tilde \eta )$. Letting
 $\tilde f(\tilde \eta )= \tilde H(\tilde \eta ) + \tilde G(\tilde \eta )$ and neglecting second- and higher-order terms in
 $\tilde G$ gives the following differential equation:
 ${\tilde \eta ^5 \tilde G'''''-(560/243)\tilde G=0}.$ The solutions are linear combinations of the family of functions
 $\tilde \eta \rightarrow \tilde \eta ^{\xi _k}$, where the
 $(\xi _k)_{k=1\ldots 5}$ are the five roots of the polynomial equation
 $(3\xi -2)(81\xi ^4-756\xi ^3+2331\xi ^2-2496\xi +280)=0$. Three of these solutions have a real part
 ${\rm Re}(\xi _k)> 5/3$ so that the associated coefficients must vanish. This shows that the asymptotic behaviour of
 $\tilde f$ as
 $\tilde \eta \rightarrow +\infty$ sets three constraints.
We thus see that the asymptotic behaviour of  $\tilde f$ at
 $\pm \infty$ corresponds to six constraints. In addition, since we are looking for a travelling wave solution, the problem should be invariant by translation: this implies a seventh constraint and shows that solving (3.4) for
 $\tilde f,~\tilde C$ and
 $\tilde h_0$ with
 $\tilde f \rightarrow \tilde {h}_0$ as
 $\tilde \eta \rightarrow -\infty$ and
 $\tilde f(\tilde \eta ) \sim \tilde F(\tilde \eta )$ as
 $\tilde \eta \rightarrow +\infty$ is a well-posed problem. We solve (3.4) numerically using the boundary value problem solver bvp4c implemented in MATLAB, with the seven boundary conditions
 $\tilde f(-\tilde \eta _\infty )=\tilde h_0$,
 $\tilde f'(-\tilde \eta _\infty )=\tilde f ''(-\tilde \eta _\infty )=0$, and
 $\tilde f^{(n)}(\tilde \eta _\infty )=\tilde F^{(n)}(\tilde \eta _\infty )$ for
 $n=0\ldots 3$. We start with a small value of
 $\tilde \eta _\infty$ to facilitate convergence and iteratively increase the domain size, using solutions on smaller domains to construct an initial guess. We do so until the solution converges and does not depend significantly on the domain size. The solution is shown in figure 5(b), and we find that
 $\tilde C=0.281$ and
 $\tilde h_0=1.017$.
Appendix B. Matching between the adhesion front and the blister
We consider here the intermediate matching region between the adhesion front (§ 3.2) and the blister (§ 3.3). The scales of this region are found by estimating when the decreasing curvature of the far-field shape of the adhesion front given by  $\tilde {f}''(\tilde \eta ) \sim (10/9) (234/280)^{1/3} \tilde {C}^{1/3}\tilde {\eta }^{-1/3}$ as
 $\tilde {\eta } \rightarrow \infty$ becomes comparable to the curvature of the blister,
 $\tilde \kappa =1.35\hat {\sigma }^{1/5}$ in dimensionless units of the adhesion front. This yields the natural scales
 $\tilde {\eta }_0=\tilde C/\tilde \kappa ^3\sim \hat \sigma ^{-3/5}$ and
 $\tilde {f}_0={\tilde C^2}/\tilde \kappa ^5\sim \hat {\sigma }^{-1}$. Denoting by
 $\bar f$ the height and by
 $\bar \eta$ the longitudinal coordinate non-dimensionalized by these scales, and balancing the viscous and bending forces, we are led to an equation similar to that in the zippering region (§ 3.4) along with the asymptotic conditions that together read as
 $$\begin{gather} 1+\bar{f}^2\bar{f}'''''=0 , \end{gather}$$
 $$\begin{gather}\bar f \sim \left(\frac{243}{280}\right)^{1/3}\bar{\eta}^{5/3}\quad {\rm as}\ \bar \eta \rightarrow 0, \quad \bar f \sim \frac{\bar{\eta}^2}{2}\quad {\rm as}\ \bar \eta \rightarrow \infty. \end{gather}$$
We note that (B1b) sets the asymptotic behaviour of  $\bar f$ and therefore corresponds to a sufficient number of conditions to completely determine the solution. While the reduced (B1) can be solved numerically, our results obtained from the solution of the full governing partial differential equation (2.5) for finite values of
 $\hat {\sigma }$
 $\in [0.01-0.12]$ do not reveal the structure of this intermediate region. In particular, our simulations do not exhibit a clear region with constant curvature. Therefore, we do not present results that compare these different approaches here.



