Introduction
Soybean and cotton (Gossypium hirsutum L.) have been developed with a genetic trait that confirms resistance to dicamba (Behrens et al. Reference Behrens, Mutlu, Chakraborty, Dumitru, Jiang, LaVallee, Herman, Clemente and Weeks2007). This technology will provide growers with an alternative for the control of problematic glyphosate-resistant weeds like Palmer amaranth (Amaranthus palmeri S. Wats.), common waterhemp (Amaranthus rudis J.D. Sauer), common ragweed (Ambrosia artemisiifolia L.), giant ragweed (Ambrosia trifida L.), and horseweed [Conyza canadensis (L.) Cronquist], as well as protoporphyrinogen oxidase inhibitor–resistant Palmer amaranth, common waterhemp, and common ragweed (Heap Reference Heap2017). Dicamba-resistant soybean cultivars were first commercially available in 2016. That year, complaints of dicamba damage to nontarget crops were received in Missouri, Alabama, Arkansas, Illinois, Kentucky, Minnesota, Mississippi, North Carolina, Tennessee, and Texas (US EPA 2017). During the 2017 growing season off-target movement of dicamba was again observed. Bradley (Reference Bradley2017) reported that 2,708 dicamba-related injury cases were under investigation by state departments of agriculture by mid-October in 2017. State extension weed scientists estimated that approximately 1.46 million ha of US soybean crops were injured by off-site movement of dicamba.
In most weed science research, crop injury response to herbicide is based on a visual rating of 0 (no crop injury/no effect) to 100% (all plants dead/total plant death/complete kill/complete crop death). Injury criteria represented in ratings are often not provided, but in some cases the authors are more specific. Al-Khatib and Peterson (Reference Al-Khatib and Peterson1999) noted “severe shoot and petiole epinasty, swollen petioles, leaf cupping, and leaf curling” 7 d after treatment (DAT) with dicamba, and “symptomology associated with yield loss from dicamba treatments included severe epinasty, leaf cupping and curling, as well as leaf burn at some of the higher rates.” Griffin et al. (Reference Griffin, Bauerle, Stephenson, Miller and Boudreaux2013) stated that injury ratings “included leaf cupping and crinkling, stem and leaf petiole epinasty, terminal chlorosis/death, stem swelling, and stem cracking.” Others have stated that “foliar chlorosis, necrosis, and plant stunting were considered when making the visual estimates” (Johnson et al. Reference Johnson, Fisher, Jordan, Edmisten, Stewart and York2012). Weidenhamer et al. (Reference Weidenhamer, Triplett and Sobotka1989) assessed soybean injury from dicamba by “the presence or absence of several distinct morphological symptoms of herbicide injury; foliar aberrations, terminal bud injury, pod malformation, petiole enlargement, twisting of plant tops, splitting of stem, canopy closure, and delayed maturity.” To assign a single injury rating on a 0 to 100% scale that represents multiple injury criteria would require that individual criterion be assigned a level of severity and ranked as to contribution to overall injury. Such a rating system would be subjective, and ratings would be expected to vary among individuals.
Others have used a 0 to 100 rating scale to assess soybean injury affected by auxin herbicides, but have gone a step further by clearly defining the specific injury represented using 10-point increments. As an example, Egan and Mortensen (Reference Egan and Mortensen2012) described soybean injury following exposure to dicamba, where a value of 10 represents “slight crinkle of leaflets of terminal leaf,” 20 is equivalent to “cupping of terminal leaflets, slight crinkle of leaflets of second leaf, growth rate normal,” and 50 indicates “no expansion of terminal leaf, second leaf size one-half that of control, axillary leaf buds unable to open and develop.” Robinson et al. (Reference Robinson, Simpson and Johnson2013) described soybean injury from auxin herbicides, where 10% represents “slight reduction in height or canopy volume, cupped or bubbled leaves on less than or equal to the upper 10% of the plant, bent petioles, and chlorosis or necrosis,” 20% represents “moderately crinkled leaflets (extended across less than or equal to the upper 20% of the plant), curled petioles, reduced height and canopy volume, cupped terminal leaflets,” and 50% represents “very high reduction of plant height (less than or equal to 50% of the plant) with little likelihood of recovery from the apical meristem, new growth suppressed, formation of pods reduced or malformed, some leaf and stem tissue becomes necrotic, petioles and stem show severe twisting.”
The rating systems described by Egan and Mortensen (Reference Egan and Mortensen2012) and Robinson et al. (Reference Robinson, Simpson and Johnson2013), however, may be too definitive and inflexible. A fairly simple and straightforward method of assessing crop injury from auxin herbicides was described by Bauerle et al. (Reference Bauerle, Griffin, Alford, Curry and Kenty2015). Cotton and tomato injury symptoms were grouped as (1) leaf cupping/crinkling/drooping, (2) leaf rolling/strapping, (3) stem epinasty, and (4) stem swelling/cracking. For each group, a visual injury rating was assigned using a scale of 0 to 5 with 0=none, 1=slight, 2=slight to moderate, 3=moderate, 4=moderate to severe, and 5=severe. The rating system proved effective in evaluating volatility among auxin herbicide formulations.
The high sensitivity of soybean to dicamba suggests that symptomology such as leaf cupping would be expressed at very low rates. The question would be, how does the presence of leaf cupping or any other observed symptom relate to crop yield? The objectives of this research were (1) to identify injury criteria associated with soybean exposure to dicamba and to quantify severity (0 to 5 scale) as influenced by rate, plant growth stage at exposure, and time after exposure; (2) to compare this method of injury assessment to overall visual crop injury ratings (0 to 100%); and (3) to use injury criteria data and level of severity to help pinpoint specific herbicide rates to determine crop yield loss.
Materials and Methods
Experiments to evaluate soybean response to dicamba were conducted for 3 yr at the LSU AgCenter, Central Research Station, Ben Hur Research Farm (30.363°N, 91.163°W) in Baton Rouge, LA. The soil type and soil classification for the experiments was a Mhoon silt loam (fine-silty, mixed, nonacid, thermic Typic Fluvaquent) with a pH of 6.3 and organic matter content of 1.9%. Indeterminate soybean cultivars and maturity groups were ‘Pioneer 94Y80’ (relative maturity 4.8) in 2013, ‘Terral REV 51R53’ (relative maturity 5.1) in 2014, and ‘Asgrow 4835’ (relative maturity 4.8) in 2015. Planting dates were June 6, 2013, May 21, 2014, and May 6, 2015, and seeding rate was 300,000 seed ha–1. On the same day of planting, S-metolachlor (Dual II Magnum®; Syngenta Crop Protection, Greensboro, NC) at 1,610 g ai ha–1 plus glyphosate (Roundup PowerMax®; Monsanto Co., St. Louis, MO) at 870 g ae ha–1 were applied in 2013, and S-metolachlor plus sulfentrazone (Authority® Elite; FMC Corp., Philadelphia, PA) at 1,760 g ai ha–1 were applied in 2014 and 2015. In each experiment, glyphosate (Roundup PowerMax) was applied twice at 870 g ha–1 when weeds were 5 to 8 cm tall and approximately 14 d later to eliminate weed competition. Fungicides and insecticides were applied beginning at R3 (Fehr and Caviness Reference Fehr and Caviness1977) based on LSU AgCenter recommendations (Anonymous 2017).
The DGA salt formulation of dicamba (Clarity® herbicide; BASF Corp., Research Triangle Park, NC) was applied to soybean at V3/V4 (third/fourth node with two to three fully expanded trifoliates) or at R1/R2 (open flower at any node on main stem/open flower at one of the two uppermost nodes on main stem). Dicamba rates included 0.6, 1.1, 2.2, 4.4, 8.8, 17.5, 35, 70, 140, and 280 g ae ha–1 (1/1,000 to 1/2 of the manufacturer’s use rate of 560 g ha–1). Nonionic surfactant at 0.25% vol/vol was added to all treatments, and a nontreated control was included for comparison. A randomized complete block design with a factorial arrangement of treatments (growth stage by dicamba rate) and four replications were used each year.
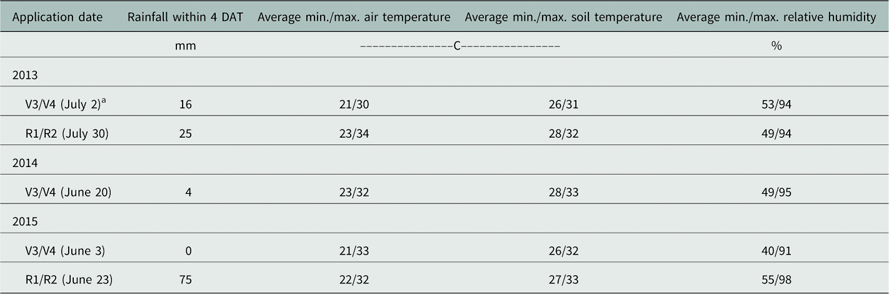
Specific dates for dicamba application for each experiment along with rainfall received 0 to 4 d after application (DAA) and average minimum/maximum air temperature, soil temperature, and percent relative humidity 0 to 4 DAA are shown in Table 1. For the 3 yr of the study, plots were not irrigated. Timely rainfall was in most cases sufficient to prevent drought stress conditions. For each experiment, dicamba treatments were applied using a CO2-pressurized backpack sprayer calibrated to deliver 140 L ha–1 spray volume at 270 kPa. Sprayers were fitted with 110-degree Turbo TeeJet Induction flat spray nozzles (TeeJet® Technologies, Spraying Systems Co., Wheaton, IL), and wind speed at application was no more than 4.8 km h–1. Treated areas consisted of two rows spaced 76 cm apart with a nontreated border area between plots of 152 cm. The border area was sufficient to prevent cross-contamination between adjacent plots.
Rainfall, average minimum (min.) and maximum (max.) air and soil temperatures, and average relative humidity 0 to 4 d after herbicide treatment (DAT) for experiments conducted in Baton Rouge, LA, to evaluate dicamba applied to soybean at vegetative and reproductive growth stages.

a Soybean growth stages included V3/V4 (third/fourth node with two to three fully expanded trifoliates) and R1/R2 (open flower at any node on main stem/open flower at one of the two uppermost nodes on main stem). The R1/R2 application in 2014 was not included because of weather conditions.
Fourteen injury criteria associated with dicamba exposure were identified as upper canopy leaf cupping, terminal leaf cupping, upper canopy pale leaf margins, upper canopy leaf surface crinkling, upper canopy leaf rollover/inversion, lower leaf soil contact, leaf petiole droop, leaf petiole base swelling, terminal leaf chlorosis, terminal leaf necrosis, terminal leaf epinasty, stem epinasty, lower stem base swelling, and lower stem base lesions/cracking. Each criterion was visually rated 7 and 15 d after dicamba treatment (DAT) using a scale of 0 to 5, with 0=no injury, 1=slight, 2=slight to moderate, 3=moderate, 4=moderate to severe, and 5=severe. Injury ratings were determined from five plants selected at random within each row of the two-row plots. Plants were evaluated for each injury criterion using the 0 to 5 scale, and a value representative of the 10 plants was recorded. In addition, an overall visual assessment of soybean injury 7 and 15 DAT was made using a scale of 0 to 100%, with 0=none and 100%=plants dead. An attempt was made to include the level of injury observed for specific injury criteria in the overall injury assessment. Around 15 d is when injury expression is highly visible (Griffin et al. Reference Griffin, Bauerle, Stephenson, Miller and Boudreaux2013; Egan et al. Reference Egan, Barlow and Mortensen2014), and over time plant symptoms can become less noticeable because of plant recovery or death. Plant height reduction compared with the nontreated control was also determined 7 and 15 DAT using the 0 to 100% scale. Mature plant height was measured just prior to harvest from five randomly selected plants from each treated row. Soybean was combine-harvested on October 28, 2013, on October 16, 2014, and on October 5, 2015, and yields were adjusted to 13% moisture.
Statistical Analysis
Data for all variables were subjected to the Mixed Procedure in SAS (SAS Institute Inc., Cary NC). Years and replications, and all interactions containing these effects were considered random (Carmer et al. Reference Carmer, Nyquist and Walker1989). Application timing, herbicide rate, and rating date (where applicable) were considered fixed effects. Because injury criteria were assigned zero values when dicamba was not applied, and for some of the criteria injury was not observed at lower rates or at higher rates because of plant death, Tukey-Kramer (P<0.05) was used for mean separation, and letter groupings and SE values were included (SAS Institute Inc., Cary, NC).
For percent visual injury and plant height reduction, regression analysis determined the relationship of each variable to dicamba rate and is best described by a three-parameter sigmoidal equation (Nandula et al. Reference Nandula, Poston, Reddy and Whiting2009). The regression equation for each variable was computed using Sigma Plot (Sigma Plot, version 12.5; Systat Software Inc., San Jose, CA).
 $$y{\equals}a\,/\,\left( {1{\plus}exp\left( {{\minus}\left( {x{\plus}{\rm }x_{0} } \right)\,/\,b} \right)} \right)$$
For Equation 1, y is visual injury or plant height reduction, a is an asymptote, x 0 is the dicamba rate resulting in a given measure of y, b is the slope of the curve around x 0, and x is the dicamba rate, fitted to the raw data.
For soybean mature height and yield, we observed a significant dicamba rate–by–growth stage interaction. Regression analysis determined the relationship of each variable to dicamba rate and is best described as a nonlinear exponential decay model (Nandula et al. Reference Nandula, Poston, Reddy and Whiting2009; White and Boyd Reference White and Boyd2016). Regression equations for each variable were computed using Sigma Plot.
 $$y{\equals}ae^{{{\minus}bx}} $$
For Equation 2, y is mature plant height or yield, a is an asymptote, e is Euler's number (a constant), b is the slope of the curve, and x is the dicamba rate, fitted to the raw data.
Results and Discussion
Soybean plants were actively growing when dicamba was applied each year. For the V3/V4 and R1/R2 applications, rainfall ranging from 0 to 16 mm and 25 to 75 mm, respectively, was received within 4 DAT (Table 1). Average maximum air temperature 0 to 4 DAT for the applications ranged from 30 to 34 C, and average maximum relative humidity was at least 91%.
Upper Canopy Leaf Cupping and Upper Canopy Pale Leaf Margins
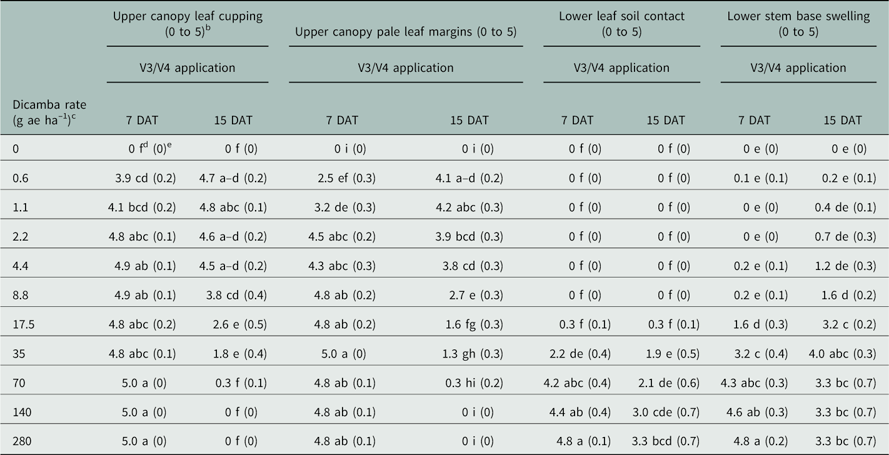
Leaf cupping is commonly used to describe symptomology of auxin herbicides (Al-Khatib and Peterson Reference Al-Khatib and Peterson1999; Bauerle et al. Reference Bauerle, Griffin, Alford, Curry and Kenty2015; Egan and Mortensen Reference Egan and Mortensen2012; Griffin et al. Reference Griffin, Bauerle, Stephenson, Miller and Boudreaux2013; Johnson et al. Reference Johnson, Fisher, Jordan, Edmisten, Stewart and York2012; Robinson et al. Reference Robinson, Simpson and Johnson2013; Wax et al. Reference Wax, Knuth and Slife1969; Weidenhamer et al. Reference Weidenhamer, Triplett and Sobotka1989). Upper canopy leaf cupping was observed for dicamba exposure at V3/V4 and was expressed primarily as upward cupping. At 7 DAT, upper canopy leaf cupping for dicamba at 0.6 and 1.1 g ha–1 was 3.9 and 4.1, respectively, and injury was equivalent for 2.2 to 280 g ha–1 (4.8 to 5) (Table 2). In contrast, greatest upper canopy leaf cupping was observed 15 DAT at the lower dicamba rates. Injury was equivalent for rates of 0.6 to 8.8 g ha–1 (3.8 to 4.8), and decreased to 2.6 at 17.5 g ha–1 and to 1.8 at 35 g ha–1. Leaf cupping for 70 g ha–1 dicamba and higher was no more than 0.3 because of masking by other injury criteria and plant death.
Upper canopy leaf cupping, upper canopy pale leaf margins, lower leaf soil contact, and lower stem base swelling in soybean 7 and 15 d after treatment (DAT) with dicamba at V3/V4.Footnote a

a Application timing: V3/V4 (third/fourth node with two to three fully expanded trifoliates).
b Injury was visually rated using a scale of 0=no injury; 1=slight; 2=slight to moderate; 3=moderate; 4=moderate to severe; and 5=severe.
c Dicamba rates ranged from 1/1,000 to 1/2 of the use rate of 560 g ha–1.
d Means within each column followed by the same letter are not significantly different using Tukey-Kramer at P<0.05.
e Standard error of the mean in parentheses.
Upper canopy leaves also exhibited whitish/cream-colored leaf margins often with a pointed leaf tip, which made symptoms highly visible. Upper canopy pale leaf margins 7 d following exposure at V3/V4 to dicamba at 0.6 and 1.1 g ha–1 was 2.5 and 3.2, respectively, and injury was 4.3 to 5.0 for the higher rates (Table 2). Greatest injury was observed 15 DAT at the lower dicamba rates. Injury was equivalent for 0.6 to 4.4 g ha–1 (3.8 to 4.2) and was 2.7 at 8.8 g ha–1. For 17.5 to 280 g ha–1, injury was 0 to 1.6 as a result of expression of other injury criteria and plant death.’
Lower Leaf Soil Contact and Lower Stem Base Swelling
For both variables injury was observed following dicamba exposure at V3/V4, and greatest injury was observed at the higher dicamba rates. Lower leaf soil contact was no more than 0.3 at 7 and 15 DAT for rates of 0.6 to 17.5 g ha–1 (Table 2). At 35 g ha–1, however, injury at 7 DAT was 2.2 and at 15 DAT was 1.9; for 70 to 280 g ha-1, injury ranged from 4.2 to 4.8 at 7 DAT and from 2.1 to 3.3 at 15 DAT. Lower stem base swelling observed for exposure at V3/V4 was equivalent to the nontreated control for dicamba at 0.6 to 8.8 g ha–1 at 7 DAT (0 to 0.2) and at 0.6 to 4.4 g ha–1 at 15 DAT (0.2 to 1.2) (Table 2). Lower stem base swelling for 70 to 280 g ha–1 was 4.3 to 4.8 at 7 DAT and 3.3 at 15 DAT.
Terminal Leaf Cupping and Upper Canopy Leaf Rollover/Inversion
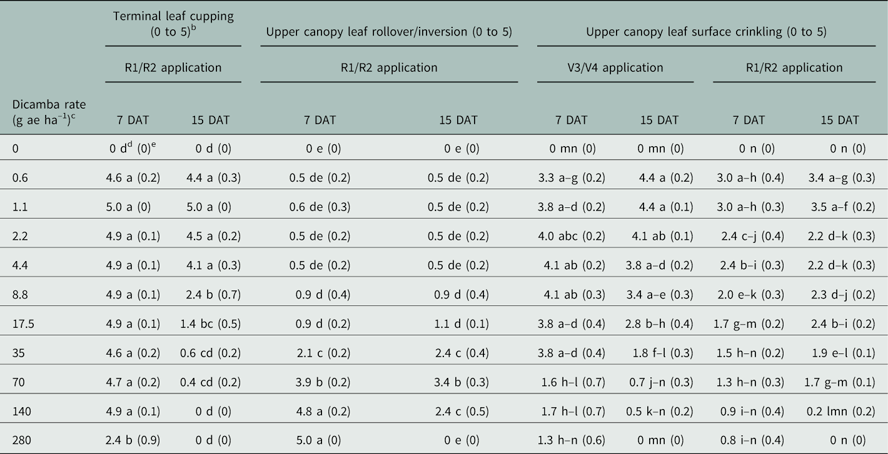
Terminal leaf cupping was observed for dicamba exposure at R1/R2. The presence of mostly upward cupped terminal leaflets was not as visible compared with cupping of upper canopy leaves observed at V3/V4, because affected terminal leaves did not exhibit whitish/cream-colored margins and were mostly underneath older leaves in the upper canopy. At 7 DAT, terminal leaf cupping was 4.6 to 5.0 for dicamba rates of 0.6 to 140 g ha–1, and at 280 g ha–1 injury decreased to 2.4 (Table 3). As also observed for upper canopy leaf cupping, greatest terminal leaf cupping 15 DAT was observed at the lower dicamba rates. Injury was equivalent for 0.6 to 4.4 g ha–1 dicamba (4.1 to 5.0), and decreased to 2.4 at 8.8 g ha–1 and to 0.6 at 35 g ha–1. For rates of 70 g/ha–1 and higher, terminal leaf cupping was overshadowed by other injury criteria and plant death. The difference in the response to dicamba observed between the 7- and 15-DAT ratings for upper canopy leaf cupping, upper canopy pale leaf margins, and terminal leaf cupping (Tables 2 and 3) suggest that the 15-DAT rating would be a better estimate of soybean response to dicamba.
Terminal leaf cupping and upper canopy leaf rollover/inversion in soybean 7 and 15 d after treatment (DAT) with dicamba at R1/R2 and upper canopy leaf surface crinkling 7 and 15 DAT at V3/V4 and R1/R2.Footnote a

a Application timings:V3/V4 (third/fourth node with two to three fully expanded trifoliates) and R1/R2 (open flower at any node on main stem/open flower at one of the two uppermost nodes on main stem).
b Injury was visually rated using a scale of 0=no injury; 1=slight; 2=slight to moderate; 3=moderate; 4=moderate to severe; and 5=severe.
c Dicamba rates ranged from 1/1,000 to 1/2 of the use rate of 560 g ha–1.
d Means within each column followed by the same letter are not significantly different using Tukey-Kramer at P<0.05.
e Standard error of the mean in parentheses.
Upper canopy leaf rollover/inversion was observed for exposure at R1/R2. Particularly at higher dicamba rates, the light green color from the underside of inverted leaves was evident in the top of the soybean canopy. Injury 7 and 15 DAT ranged from 0.5 to 1.1 for dicamba rates of 0.6 to 17.5 g ha–1 and at 35 g ha–1 was 2.1 at 7 DAT and 2.4 at 15 DAT (Table 3). At 280 g ha–1, injury was 5.0 at 7 DAT but was not observed 15 DAT because of plant death.
Upper Canopy Leaf Surface Crinkling
Upper canopy leaf surface crinkling was observed for dicamba applied at both growth stages, but unlike upper canopy leaf cupping, affected leaves did not have pale leaf margins. Crinkled leaves exhibited an irregular, bubbled/leathery leaf surface and a slight downward curve with an abnormal whitish, pointed leaf tip. Leaves exhibiting surface crinkling appeared in conjunction with cupped leaves in the upper canopy following exposure at V3/V4 (Table 2) and with terminal leaves following exposure at R1/R2 (Table 3). At 7 DAT for V3/V4 application, upper canopy leaf surface crinkling from 0.6 to 35 g ha–1 dicamba was equivalent and ranged from 3.3 to 4.1, and injury decreased at the higher rates (Table 3). At 15 DAT for V3/V4 application, injury from dicamba at 0.6 g ha–1 was 4.4 and decreased to 2.8 at 17.5 g ha–1. Injury for 70 g ha–1 and higher was no greater than 0.7. For exposure at R1/R2, upper canopy leaf surface crinkling for dicamba at 0.6 g ha–1 was 3.0 at 7 DAT and 3.4 at 15 DAT, and injury was equivalent to rates as high as 70 g ha–1 (Table 3). Injury was 0 to 0.9 for dicamba at 140 and 280 g ha–1 because of plant senescence.
Leaf Petiole Droop and Leaf Petiole Base Swelling
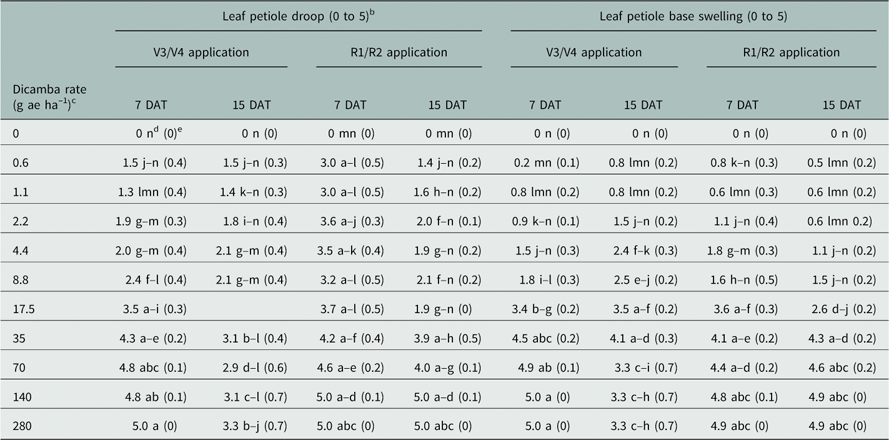
Leaf petiole droop and leaf petiole base swelling were observed following exposure to dicamba at both growth stages. Leaf petioles were considered to be drooped when the angle between the petiole and the main stem was greater than 45 degrees; in some cases, leaf petioles were at 90-degree angles or more. Following V3/V4 exposure to dicamba at 0.6 to 8.8 g ha–1, leaf petiole droop was equivalent and ranged from 1.3 to 2.4 at 7 DAT (Table 4). Injury was 3.5 to 5.0 for 17.5 g ha–1 and higher. For 15 DAT at V3/V4 and 7 DAT at R1/R2, differences in leaf petiole droop were not observed for dicamba rates of 0.6 to 280 g ha–1. At 15 d following the R1/R2 application, injury was equivalent to the nontreated control for dicamba rates of 0.6 to 17.5 g ha–1 (1.4 to 2.1) and was 3.9 to 5.0 for 35 g ha–1 and higher.
Leaf petiole droop and leaf petiole base swelling in soybean 7 and 15 d after treatment (DAT) with dicamba at V3/V4 and R1/R2.Footnote a

a Application timings: V3/V4 (third/fourth node with two to three fully expanded trifoliates) and R1/R2 (open flower at any node on main stem/open flower at one of the two uppermost nodes on main stem).
b Injury was visually rated using a scale of 0=no injury; 1=slight; 2=slight to moderate; 3=moderate; 4=moderate to severe; and 5=severe.
c Dicamba rates ranged from 1/1,000 to 1/2 of the use rate of 560 g ha–1.
d Means within each column followed by the same letter are not significantly different using Tukey-Kramer at P<0.05.
e Standard error of the mean in parentheses.
Leaf petiole base swelling was 0 to 1.8 for dicamba at 0 to 8.8 g ha–1 at 7 DAT at V3/V4 and increased to 3.4 to 5.0 for the higher rates (Table 4). At 15 DAT at V3/V4 stage, leaf petiole base swelling was equivalent to the nontreated control for dicamba at 0.6 to 2.2 g ha–1 (0.8 to 1.5); injury was 2.4 to 4.1 for rates of 4.4 g ha–1 and higher. For R1/R2 at 7 DAT, injury was 0 to 1.8 for rates of 0 to 8.8 g ha–1, and injury increased to 3.6 to 4.9 for the higher rates (Table 4). Injury at 15 DAT was equivalent to the nontreated control for dicamba at 0.6 to 8.8 g ha–1 (0.5 to 1.5), and injury was 4.3 to 4.9 for dicamba at 35 g ha–1 and higher.
Terminal Leaf Chlorosis and Terminal Leaf Necrosis
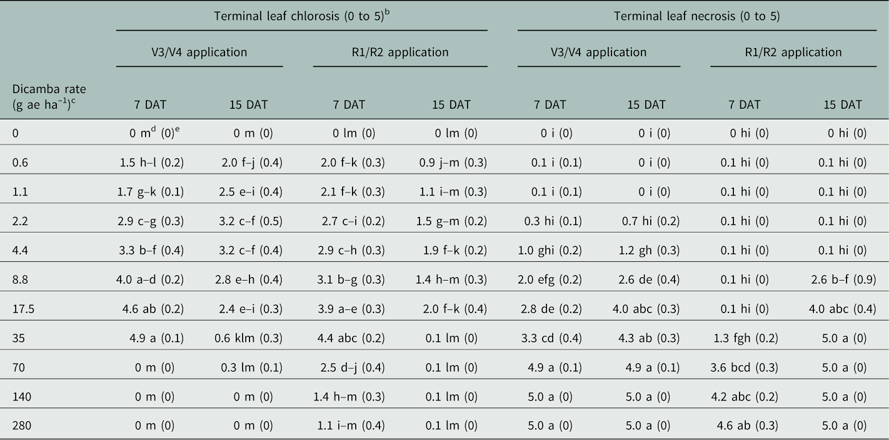
Terminal leaf chlorosis and necrosis were observed following exposure to dicamba at both growth stages. For terminal leaf chlorosis 7 DAT at V3/V4, injury was 1.5 and 1.7 for 0.6 and 1.1 g ha–1, respectively, and 4.0 to 4.9 for 8.8 to 35 g ha–1 (Table 5). Injury 15 DAT at V3/V4 was 2.0 to 3.2 for 0.6 to 17.5 g ha–1 dicamba, but injury was no more than 0.6 for 35 g ha–1 and higher as a result of terminal necrosis. Terminal leaf chlorosis 7 DAT at R1/R2 was equivalent for dicamba at 0.6 to 8.8 g ha–1 (2.0 to 3.1) and was greater than the nontreated control; injury was 2.5 to 1.1 for 70 to 280 g ha–1 (Table 5). By 15 DAT for R1/R2 exposure, differences in terminal leaf chlorosis were not observed for dicamba at 0.6 to 280 g ha–1.
Terminal leaf chlorosis and terminal leaf necrosis in soybean 7 and 15 d after treatment (DAT) with dicamba at V3/V4 and R1/R2.Footnote a

a Application timings: V3/V4 (third/fourth node with two to three fully expanded trifoliates) and R1/R2 (open flower at any node on main stem/open flower at one of the two uppermost nodes on main stem).
b Injury was visually rated using a scale of 0=no injury; 1=slight; 2=slight to moderate; 3=moderate; 4=moderate to severe; and 5=severe.
c Dicamba rates ranged from 1/1,000 to 1/2 of the use rate of 560 g ha–1.
d Means within each column followed by the same letter are not significantly different using Tukey-Kramer at P<0.05.
e Standard error of the mean in parentheses.
Terminal leaf necrosis for V3/V4 was no greater than for the nontreated control for dicamba at 0.6 to 4.4 g ha–1 at 7 DAT (0.1 to 1.0) and for 0.6 to 2.2 g ha–1 at 15 DAT (0 to 0.7) (Table 5). Injury for 8.8 to 35 g ha–1 was 2.0 to 3.3 at 7 DAT and 2.6 to 4.3 at 15 DAT. For 70 to 280 g ha–1, injury was 4.9 to 5.0 for 7 DAT and 15 DAT. For R1/R2 exposure, terminal leaf necrosis was no greater than for the nontreated control for dicamba at 0.6 to 35 g ha–1 at 7 DAT and for 0.6 to 4.4 g ha–1 at 15 DAT (Table 5). Injury was 3.6 to 4.6 for 70 to 280 g ha–1 at 7 DAT and 4.0 to 5.0 for 17.5 to 280 g ha–1 at 15 DAT. A common observation where terminal necrosis was severe was the presence 15 DAT of new growth from lateral buds at the base of the plant.
Terminal Leaf Epinasty, Stem Epinasty, and Lower Stem Base Lesions/Cracking
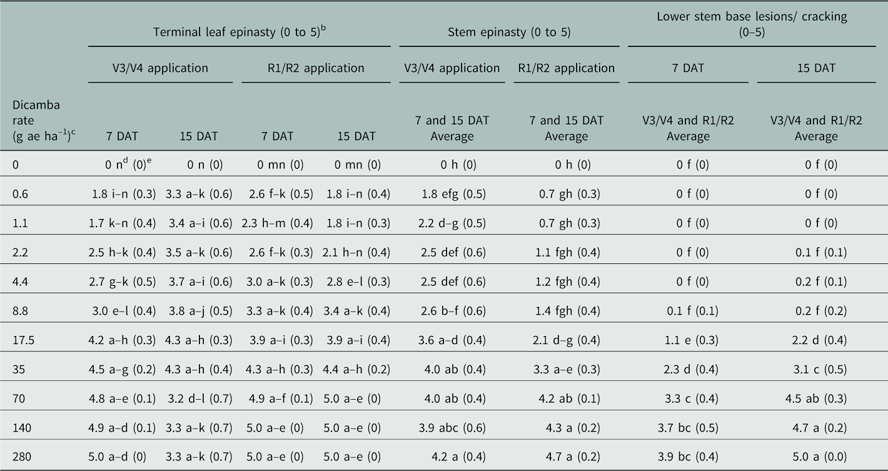
Terminal leaf epinasty, stem epinasty, and lower stem base lesions/cracking were observed following exposure to dicamba at both growth stages. For terminal leaf epinasty, injury 7 DAT for V3/V4 exposure was equivalent to the nontreated control for dicamba at 0.6 and 1.1 g ha–1 (1.8 and 1.7) (Table 6). Compared with 0.6 g ha–1, however, injury was greater for 17.5 g ha–1 and higher (1.8 vs. 4.2 to 5.0). At 15 DAT for V3/V4 exposure, terminal leaf epinasty was equivalent for dicamba rates of 0.6 to 280 g ha–1 (3.2 to 4.3). For the R1/R2 application 7 DAT, injury for dicamba at 0.6 to 70 g ha–1 was equivalent (2.3 to 4.9), and injury was 5.0 for 140 and 280 g ha–1 (Table 6). For 15 DAT, terminal leaf epinasty was equivalent to the nontreated control for dicamba at 0.6 to 2.2 g ha–1 (1.8 to 2.1). Compared with dicamba at 0.6 g ha–1, injury was greater for 35 g ha–1 and higher (1.8 vs. 3.9 to 5.0).
Terminal leaf epinasty, stem epinasty, and lower stem base lesions/cracking in soybean 7 and 15 d after treatment (DAT) with dicamba at V3/V4 and R1/R2.Footnote a

a Application timings: V3/V4 (third/fourth node with two to three fully expanded trifoliates) and R1/R2 (open flower at any node on main stem/open flower at one of the two uppermost nodes on main stem).
b Injury was visually rated using a scale of 0=no injury; 1=slight; 2=slight to moderate; 3=moderate; 4=moderate to severe; and 5=severe.
c Dicamba rates ranged from 1/1,000 to 1/2 of the use rate of 560 g ha–1.
d Means within each column followed by the same letter are not significantly different using Tukey-Kramer at P<0.05.
e Standard error of the mean in parentheses.
For stem epinasty, there was a significant interaction between dicamba rate and growth stage. Averaged across rating dates, injury from exposure at V3/V4 was equivalent for dicamba at 0.6 to 8.8 g ha–1 (1.8 to 2.6), and injury was 3.6 to 4.2 for 17.5 g ha–1 and higher (Table 6). For the R1/R2 application averaged across rating dates, stem epinasty was equivalent to the nontreated control for dicamba applied at 0.6 to 8.8 g ha–1 (0.7 to 1.4). Injury increased compared with 0.6 g ha–1 for dicamba at 35 g ha–1 and higher (0.7 vs. 3.3 to 4.7). For lower stem base lesions/cracking there was a significant interaction between dicamba rate and rating date. Averaged across growth stages, injury was equivalent to the nontreated control 7 and 15 DAT for dicamba applied at 0.6 to 8.8 g ha–1 (0 to 0.2) (Table 6). For dicamba at 17.5 g ha–1, lower stem base lesions/cracking at 7 DAT was 1.1 and at 15 DAT was 2.2. At 70 g ha–1 and higher, injury was 3.3 to 3.9 at 7 DAT and 4.5 to 5.0 at 15 DAT.
Visual Soybean Injury and Height Reduction
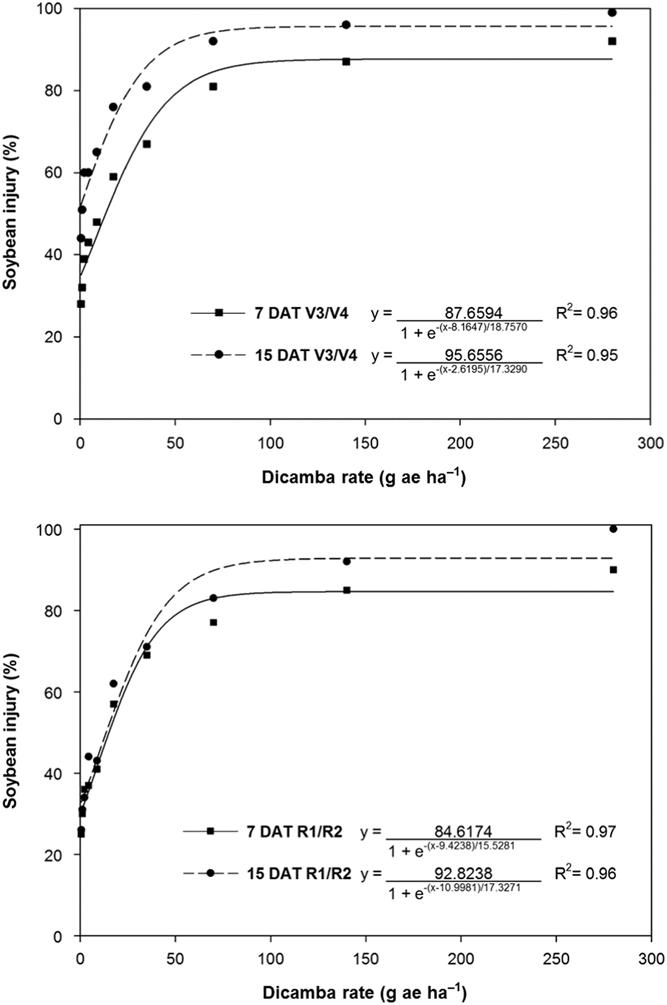
A significant sigmoidal response was observed for percent overall soybean injury and plant height reduction versus dicamba rate 7 and 15 DAT for V3/V4 and R1/R2 applications. For both V3/V4 and R1/R2 applications, soybean injury for the dicamba rates was greater 15 DAT compared with 7 DAT (Figure 1). As dicamba rate increased from 0.6 to 70 g ha–1 for application at V3/V4, soybean injury increased from 35% to 85% 7 DAT and from 45% to 94% at 15 DAT. For 140 and 280 g ha–1, injury was 88% at 7 DAT and 96% at 15 DAT. For exposure at R1/R2, as dicamba rate increased from 0.6 to 70 g ha–1 soybean injury increased from 31% to 83% at 7 DAT and from 33% to 90% at 15 DAT. For 140 and 280 g ha–1, injury was 85% at 7 DAT and 93% at 15 DAT.
Soybean injury 7 and 15 d after dicamba treatment (DAT) as influenced by dicamba rate and application timing at V3/V4 and R1/R2.

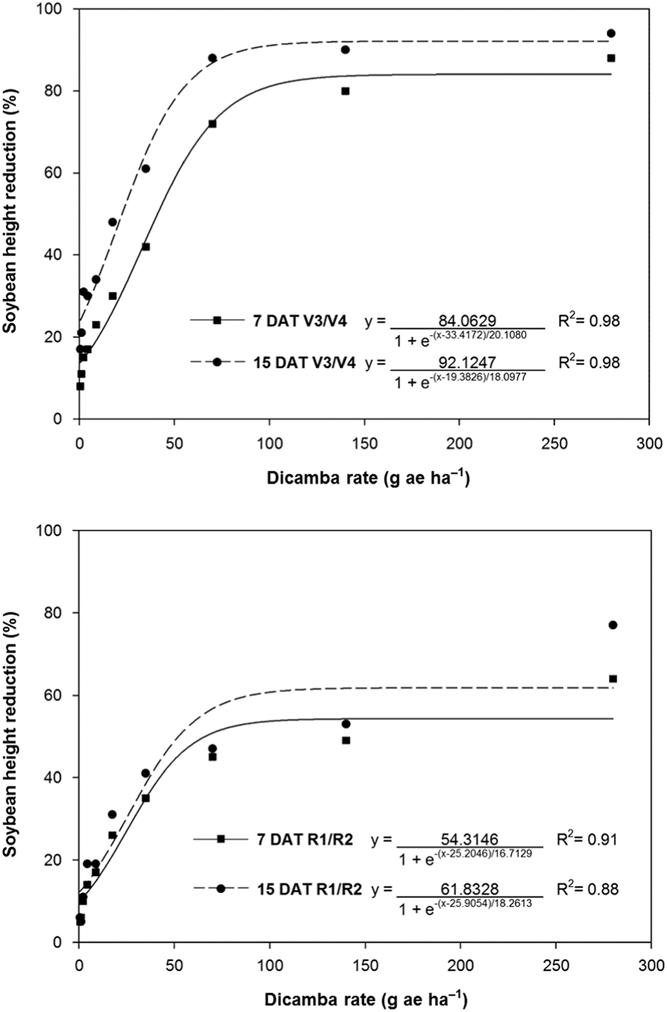
Soybean height reduction for both V3/V4 and R1/R2 applications was greater at 15 DAT compared with 7 DAT (Figure 2). Soybean height reduction from exposure to dicamba at V3/V4 increased as rate increased for 0.6 to 70 g ha–1 from 14% to 72% at 7 DAT and from 24% to 87% at 15 DAT. For 140 and 280 g ha–1, height reduction was 84% at 7 DAT and 92% at 15 DAT. For exposure at R1/R2, height reduction at 7 DAT increased from 10% to 51% as dicamba rate increased from 0.6 to 70 g ha–1 and from 12% to 57% at 15 DAT. For 140 and 280 g ha–1, height reduction was 54% at 7 DAT and 62% at 15 DAT. For dicamba rates of 0.6 to 8.8 g ha–1, plant height reduction 15 DAT for V3/V4 was around twice that observed for R1/R2. The increase in both soybean visual injury and height reduction with increasing dicamba rate is in contrast to the decrease in severity of injury observed 15 DAT for upper canopy leaf cupping, terminal leaf cupping, upper canopy pale leaf margins, and upper canopy leaf surface crinkling (Tables 2 and 3).
Soybean height reduction 7 and 15 DAT as influenced by dicamba rate and application timing at V3/V4 and R1/R2.

Mature Plant Height
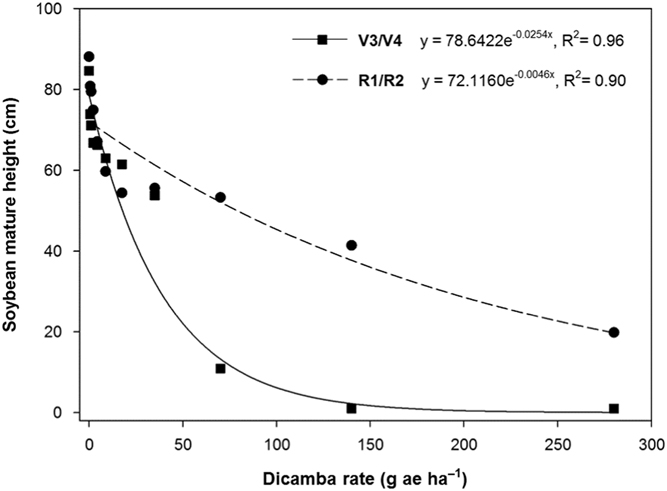
Soybean mature height in response to dicamba rate followed an exponential decay pattern for both application timings. Soybean mature height when dicamba was not applied was 78.6 cm for the V3/V4 treatments and 72.1 cm for the R1/R2 treatments (Figure 3). For individual rates of dicamba, mature plant height was negatively affected more when soybean was exposed at V3/V4 than at R1/R2. For exposure at V3/V4 to 0.6 g ha–1 dicamba, mature height was reduced 1% but was not reduced for the same rate applied at R1/R2. For exposure at V3/V4, mature plant height was reduced 5% at 2.2 g ha–1, 20% at 8.8 g ha–1, and 59% at 35 g ha–1. In contrast, plant height for soybean exposed at R1/R2 was reduced 1% at 2.2 g ha–1, 4% at 8.8 g ha–1, and 15% at 35 g ha–1.
Soybean mature height as influenced by dicamba rate and application timing at V3/V4 and R1/R2.

The greater reduction in mature plant height when soybean was exposed to dicamba at V3/V4 was due to apical meristem damage. Terminal necrosis prior to flowering resulted in plants producing multiple branches from the lower nodes (data not shown). With the extended growing season following dicamba exposure at V3/V4, soybean was able to compensate for reduction in height through additional branching with increased number of fruiting sites (Andersen et al. Reference Andersen, Clay, Wrage and Matthees2004; Wax et al. Reference Wax, Knuth and Slife1969). In contrast, soybean plants injured by dicamba during flowering were unable to compensate as a result of the shortened growing season.
Soybean Yield
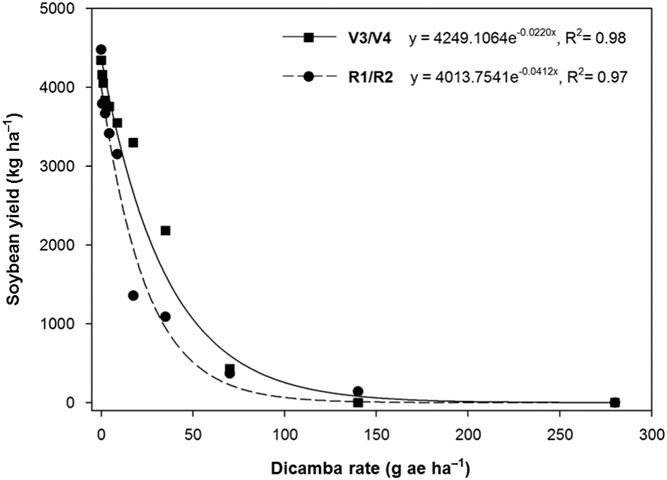
Soybean yield in response to dicamba rate followed an exponential decay pattern for both V3/V4 and R1/R2 applications. When dicamba was not applied, soybean yield was 4,250 kg ha–1 for V3/V4 treatments and 4,014 kg ha–1 for R1/R2 treatments (Figure 4). For individual rates of dicamba, soybean yield was negatively affected more when soybean was exposed at R1/R2 than at V3/V4. Following exposure to dicamba at V3/V4, soybean yield was reduced 5% at 2.2 g ha–1, 18% at 8.8 g ha–1, and 54% at 35 g ha–1. Yield for soybean exposed at R1/R2 was reduced 9% at 2.2 g ha–1, 30% at 8.8 g ha–1, and 76% at 35 g ha–1, a reduction in yield around twice that compared with the same rates at V3/V4. Others also have reported that soybean is more susceptible to dicamba in the flowering stage compared with vegetative (Auch and Arnold Reference Auch and Arnold1978; Egan et al. Reference Egan, Barlow and Mortensen2014; Griffin et al. Reference Griffin, Bauerle, Stephenson, Miller and Boudreaux2013; Wax et al. Reference Wax, Knuth and Slife1969).
Soybean yield as influenced by dicamba rate and application timing at V3/V4 and R1/R2.

For a field application rate of 560 g ha–1 dicamba, a rate of 0.56 g ha–1 (0.1% of the applied rate) would correspond to vapor drift exposure in an adjacent field (Egan and Mortensen Reference Egan and Mortensen2012; Grover et al. Reference Grover, Yoshida and Maybank1972). Based on the present study, injury expressed as moderate to severe 15 d following exposure to dicamba at 0.6 g ha–1 during the vegetative stage was observed for only upper canopy leaf cupping (4.7), upper canopy pale leaf margins (4.1), upper canopy leaf surface crinkling (4.4), and terminal leaf epinasty (3.3) (Tables 2, 3, and 6). For the same dicamba rate 15 d following exposure during the reproductive stage, moderate to severe injury was noted for only terminal leaf cupping (4.4) and upper canopy leaf surface crinkling (3.4) (Table 3). Overall visual injury associated with 0.6 g ha g ha–1 dicamba 15 DAT was 45% and 33% for vegetative and reproductive exposure, respectively, but soybean yield loss was no more than 2% (Figures 1 and 4). Meta-analysis of data from over seven decades of simulated drift experiments showed soybean yield losses of basically zero for exposure to dicamba at 0.56 g ha–1 during vegetative stage and of approximately 1% during flowering (Egan et al. Reference Egan, Barlow and Mortensen2014).
A dicamba use rate of 5.6 g ha–1 (1% of applied rate) would correspond to particle drift exposure in an adjacent field (Brown et al. Reference Brown, Carter and Stephenson2004; Carlsen et al. Reference Carlsen, Spliid and Svensmark2006; de Jong et al. Reference de Jong, de Snoo and van de Zande2008; US EPA Reference Behrens, Mutlu, Chakraborty, Dumitru, Jiang, LaVallee, Herman, Clemente and Weeks2006; Wang and Rautman Reference Wang and Rautman2008). Based on the present study, injury expressed as moderate to severe 15 d following exposure to dicamba at 4.4 g ha–1 during the vegetative stage was observed for only upper canopy leaf cupping (4.5), upper canopy pale leaf margins (3.8), upper canopy leaf surface crinkling (3.8), terminal leaf chlorosis (3.2), and terminal leaf epinasty (3.7) (Tables 2, 3, 5, and 6). For the same dicamba rate 15 d following exposure during the reproductive stage, moderate to severe injury was noted for only terminal leaf cupping (4.1) (Table 3). Overall visual injury associated with 4.4 g ha–1 dicamba 15 DAT was 50% and 38% for vegetative and reproductive exposure, respectively, and soybean yield loss was 9% and 17%, respectively (Figures 1 and 4). Egan et al. (Reference Egan, Barlow and Mortensen2014) reported soybean yield loss from dicamba exposure at 5.6 g ha–1 of 4% during vegetative stage and 9% during flowering. For the meta-analysis study (Egan et al Reference Egan, Barlow and Mortensen2014), crop sensitivity to vapor and spray particle drift of dicamba and 2,4-D in soybean and cotton was directly related to environmental conditions before, during, and following herbicide exposure. Soil moisture and air temperature were identified as key factors, and dry conditions were consistently associated with increased soybean sensitivity to dicamba.
In the present study for some of the criteria 15 d after exposure to dicamba, injury was greatest at the lower rates and decreased with increasing rate. The lack of differences among the lower dicamba rates for some of the criteria is in contrast to the steady increase in overall visual injury and plant height reduction observed as dicamba rate increased (Figures 1 and 2). These findings suggest that moderate to severe injury ratings at the lower dicamba rates for upper canopy leaf cupping, upper canopy pale leaf margins, upper canopy leaf surface crinkling, and terminal leaf chlorosis at V3/V4, and terminal leaf cupping at R1/R2 (Tables 2, 3, and 5) may or may not be indicative of yield loss. Weidenhamer et al. (Reference Weidenhamer, Triplett and Sobotka1989) reported significant soybean yield reduction when injury from dicamba consisted of terminal bud kill, splitting of the stem, swollen petioles, and curled, malformed pods, but yield was not reduced when only crinkling and cupping of terminal leaves occurred at lower rates. Al-Khatib and Peterson (Reference Al-Khatib and Peterson1999) stated that symptoms from soybean exposure to dicamba that usually are worrisome to growers, such as cupping of terminal leaf, crinkling, and leaf stunting, occur at rates much lower than required to reduce yield. Egan et al. (Reference Egan, Barlow and Mortensen2014) reported that visual injury (most commonly reported on a 0 to 100% scale) for soybean exposed to dicamba will overestimate yield loss and that plants exposed during the vegetative stage can recover from low to moderate injury. The effects of initial injury and persistence of injury on crop yield loss would be dependent on receiving timely rainfall or irrigation during the growing season and on the effective management of insects, diseases, and weeds to maximize crop yield potential.
For other criteria associated with dicamba exposure in the present study, injury 15 DAT was greatest at the higher rates, but at the lower rates injury was not different from the nontreated control. This was observed for dicamba rates as high as 2.2 g ha–1 for leaf petiole droop, leaf petiole base swelling, and terminal leaf necrosis for V3/V4 exposure and for terminal leaf epinasty for R1/R2; as high as 4.4 g ha–1 for lower stem base swelling for V3/V4 exposure and for terminal leaf necrosis and upper canopy rollover/inversion for R1/R2; as high as 8.8 g ha–1 for leaf petiole base swelling and stem epinasty for R1/R2 exposure and lower stem base lesions/cracking as an average for V3/V4 and R1/R2; and as high as 17.5 g ha–1 for lower leaf soil contact for V3/V4 exposure and leaf petiole droop for R1/R2 (Tables 2 through 6). The lack of differences in injury for these criteria at the lower dicamba rates compared with the nontreated control would also be in contrast to the steady increase in overall visual injury and plant height reduction observed as dicamba rate increased (Figures 1 and 2).
The high sensitivity of soybean to dicamba based on moderate to severe cupping and leaf crinkling observed at 0.6 g ha–1, the lowest rate evaluated, suggests that significant injury would be expected at much lower rates. Identification of injury criteria and the level of injury associated with specific dicamba rates could be useful in yield loss assessment. Further analysis of the data may be useful for developing a model for soybean yield loss prediction.
Acknowledgments
The authors acknowledge the assistance of Dr. David Blouin with statistical analysis of the data. Partial funding to support this research was provided by the Louisiana Soybean and Grain Research and Promotion Board. Appreciation is expressed to the LSU AgCenter Central Research Station, Ben Hur Research Farm, in Baton Rouge, LA, for providing land area to support this research. No conflicts of interest have been declared.