Introduction
Soils of the ice-free areas of the Ross Sea region of Antarctica have evolved over millions of years in an environment characterized by low precipitation, hyper-aridity, severe cold, limited biological activity, and extraordinary landscape stability (Campbell & Claridge Reference Campbell and Claridge1975, Reference Campbell and Claridge1987, Doran et al. Reference Doran, Priscu, Lyons, Walsh, Fountain, McKnight, Moorhead, Virginia, Wall, Clow, Fritsen, McKay and Parsons2002, Pointing et al. Reference Pointing, Chan, Lacap, Lau, Jurgens and Farrell2009). Ross Sea region soils generally lack structural development and coherence, and the loose material is covered by a thin protective layer of gravel, or coarse sand, known as a desert pavement (Cooke Reference Cooke1970, McFadden et al. Reference McFadden, Wells and Jercinovich1987, Bockheim Reference Bockheim2010). Mature, undisturbed Ross Sea region desert pavements are typically characterized by a closely packed layer of gravel, cobble, and boulder-sized rock material, which depending on its age, can be ventifacted, and coated with desert varnish (Campbell & Claridge Reference Campbell and Claridge1987, Bockheim Reference Bockheim2010). Desert pavement clasts are embedded into a finer matrix, and their undersides are often coated in salts.
Desert pavement disturbance can arise from a number of sources, and at different intensities, ranging from human trampling, to vehicles that cause overturning of large stones. In the Ross Sea region overturned stones are visible as undersides are often less weathered, lighter coloured, and coated in salts. Other disturbances range from indentation and compression of sub-surface soils, bulldozer blade scrapes, and removal of tens of centimetres of material for road fill, to station construction and complete re-contouring of the immediate landscape. Most desert pavement surfaces are easily disturbed by foot traffic (Campbell & Claridge Reference Campbell and Claridge1987, Campbell et al. Reference Campbell, Balks and Claridge1993, Balks et al. Reference Balks, Campbell, Campbell and Claridge1995), with walking tracks forming within the first 20 passes on unconsolidated surface materials (Campbell et al. Reference Campbell, Claridge and Balks1998). A walking ‘track’, as defined in this study, is an area where a visible pathway has been formed by repeated foot traffic. Once the desert pavement is disturbed, underlying finer, loose material is susceptible to wind erosion. The prevailing cold desert conditions result in slow rehabilitation rates, with some visual impacts suggested as persisting from decades to potentially hundreds of years (Campbell & Claridge Reference Campbell and Claridge1987, Campbell et al. Reference Campbell, Balks and Claridge1993, Reference Campbell, Claridge and Balks1998, Harris Reference Harris1998). Freeze-thaw processes, wind action, and to a lesser extent, water action, are recognized as drivers of physical weathering and desert pavement recovery in polar desert environments (Campbell & Claridge Reference Campbell and Claridge1987, Campbell et al. Reference Campbell, Claridge and Balks1998, Bockheim Reference Bockheim2010). Wind action is probably the primary driver of surface recovery in the Ross Sea region of Antarctica, and over time wind action moves clasts back into their flat-lying preferred state of minimum energy (McFadden et al. Reference McFadden, Wells and Jercinovich1987), whilst finer material is winnowed away, restoring a protective desert pavement.
There have been limited previous studies on the ability of Ross Sea region desert pavements to recover from human disturbance. Campbell et al. (Reference Campbell, Balks and Claridge1993) developed a Visual Site Assessment (VSA) for rapid evaluation of present-day low-intensity disturbance impacts. The VSA rates the extent of surface disturbance against impact assessment criteria, such as evidence of boot imprints, as a means of comparing disturbance severity across different sites. The rate of walking track formation was investigated near Scott Base and in the McMurdo Dry Valleys, and showed that on some unconsolidated parent materials it takes less than 20 passes for a track to form (Campbell et al. Reference Campbell, Claridge and Balks1998). Campbell et al. (Reference Campbell, Claridge and Balks1998) also showed that once a track has formed the cumulative impacts of larger numbers of people following the same track: 20 passes, versus 200 passes, versus 2000 passes, are minimal. Salt accumulation on recently disturbed surfaces (Campbell & Claridge Reference Campbell and Claridge1987, Balks et al. Reference Balks, Campbell, Campbell and Claridge1995) has been reported and it has been recognized that older, strongly weathered, desert pavements are more vulnerable to disturbance (Campbell & Claridge Reference Campbell and Claridge1987). A study by McLeod (Reference McLeod2012) identified differences in soil vulnerability in the McMurdo Dry Valleys, and Roura (Reference Roura2004) reported the relatively quick recovery of the former Greenpeace World Park Base (unofficial name) site at Cape Evans. Investigation into the direct effects of foot traffic on soil nematode populations in the Taylor Valley by Ayres et al. (Reference Ayres, Nkem, Wall, Adams, Barnett, Broos, Parsons, Powers, Simmons and Virginia2008) showed that trampling had a negative effect on the soil ecosystem, even at low intensities, and to protect microbial populations they recommended limiting foot traffic to established paths.
Under Annex I and II of the Protocol on Environmental Protection to the Antarctic Treaty all activities undertaken in Antarctica must be planned and conducted to limit adverse impacts on the Antarctic environment, and associated ecosystems (Annex II, Article 1(d) and 1(h)). Multiple walking tracks and widespread visible disturbance can detract from the visual quality of the Antarctic environment, which the public perceive to be pristine and deserving of a high level of protection (Kiernan & McConnell Reference Kiernan and McConnell2001). With the expansion of scientific expeditions and their supporting logistics, as well as the increase in tourism and non-governmental activities, understanding how best to minimize the human-induced impacts from low-intensity field camps, tourist visits, or national programme science events, has become an important issue (Campbell et al. Reference Campbell, Claridge and Balks1998, Tin et al. Reference Tin, Fleming, Hughes, Ainley, Convey, Moreno, Pfeiffer, Scott and Snape2009). Between-site differences in rehabilitative capability have implications for the environmental management of activities. In this paper we investigate the visible recovery of desert pavement surfaces from low-intensity disturbance (foot and vehicle traffic). In focussing on the visible component of surface recovery we only consider the wilderness and aesthetic values (which have been given legal protection under the Protocol since 1998). Assessment of the recovery of soil physical properties and the biota residing within the soil, although important, was beyond the scope of this paper.
The objective of this study was to assess the impacts of, and recovery from, foot and vehicle traffic on varying land surfaces in the Ross Sea region of Antarctica. We also attempted to answer the long-standing question: what has the greatest lasting visual impact on soil surfaces in the Ross Sea region: dispersed trafficking or confined human movements which form a “track”?
Study sites
Study site overview
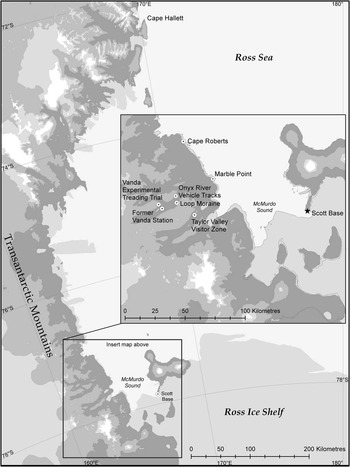
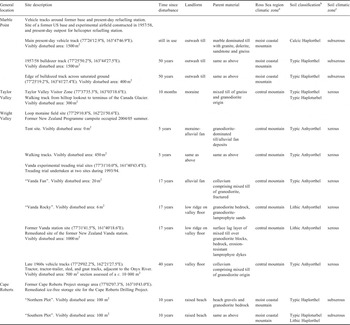
Twelve sites of past pedestrian and vehicle disturbance, and adjacent control sites, were assessed over the 2008/09 and 2009/10 field seasons (Fig. 1). The assessed sites were situated on a variety of landforms, soil parent materials, and local climates (Table I). At each site the history of the site and time since last disturbance was known, and ranged from three months to over 50 years prior to assessment.
General location of the 12 Ross Sea region study sites. Note: there are two study sites at the Loop moraine, two sites at the Vanda experimental treading trial, three sites at Marble Point, and two sites at Cape Roberts.

Site characteristics of the 12 Ross Sea region study sites.

Notes: aRoss Sea region climatic zones after Campbell & Claridge (Reference Campbell and Claridge1987). bSoil classification after Soil Survey Staff (2002). cSoil moisture zones after Campbell & Claridge (Reference Campbell and Claridge1987).
The studied sites in the McMurdo Dry Valleys (Wright Valley and Taylor Valley) and at Marble Point on the Antarctic mainland were formed predominantly from till materials of mixed granite-gneiss-marble-diorite lithology. The Cape Roberts site comprised beach-deposited gravelly sand material over granodiorite bedrock. The Cape Roberts and Marble Point sites have moderate snowfalls and are described as within the moist coastal mountain climatic zone of Campbell & Claridge (Reference Campbell and Claridge1987). The Wright Valley and Taylor Valley sites were all near the valley floor, in a central mountain climatic regime, where wind activity is considered to be the predominant driver of surface processes (Campbell & Claridge Reference Campbell and Claridge1987) (Table I). All sites were salt stage 1 (Bockheim Reference Bockheim1997) and all sites were weathering stage 2 (Campbell & Claridge Reference Campbell and Claridge1975) except the Cape Roberts sites which were weathering stage 1.
Marble Point vehicle track sites
Marble Point (Fig. 1), on the western side of McMurdo Sound, consists of c. 20 km2 of ice-free undulating land up to 122 m above sea level (Campbell et al. Reference Campbell, Claridge and Balks1994). The US military built a camp known as North Base (unofficial name) at Marble Point in 1956 including a 500 m aeroplane runway. The United States Naval Construction Battalion Reconnaissance Unit and a civilian contractor undertook extensive engineering surveys over the summers of 1957/58 and 1958/59 to test the feasibility of building a 3 km long, hard-surface air strip (Broadbent Reference Broadbent1994, Reference Broadbent2009). Base construction, occupation, and geotechnical investigation resulted in many vehicle tracks scattered across the area. Most of the “North Base” camp was cleared before military departure in January 1959 (Broadbent Reference Broadbent1994). Marble Point is the site of a present-day helicopter refuelling station and since about the year 2000 vehicle use has been confined to one main track.
Taylor Valley Visitor Zone
The Taylor Valley Visitor Zone (TVVZ) (Fig. 1) is located adjacent to the Canada Glacier, within Antarctic Specially Managed Area 2 (ATCM 2011) of the McMurdo Dry Valleys. Designated as a Visitor Zone in 1995, the TVVZ provides visitors with a spectacular Dry Valleys vista. The TVVZ is c. 350 x 300 m, dominated by a low hill (c. 30 m high), and is covered in gravely rocky till, relatively undisturbed desert pavement and patterned ground. There are established walking tracks and small guided groups walk around the site, passing by a pro-glacial lake and the terminus of the Canada Glacier, up a steep track to a lookout point. Access is by helicopter only. A total of 434 people have landed between the summers of 2006/07 and 2008/09. Research programme activity also occurs in the vicinity of the site, with substantial US Antarctic Program camps at nearby Lake Fryxell and Lake Hoare, so total visitor numbers are difficult to quantify.
Loop moraine campsite
A temporary summer field research campsite was located adjacent to the Loop moraine (unofficial name) in the lower Wright Valley (Fig. 1), during the summer of 2004/05. The camp consisted of three tents, which were occupied for one month by four people. At the end of January 2005 all tents and equipment were removed and any obviously disturbed stones were returned to their original position and orientation. At the time of departure from the site footprints were widely evident around the area where the tents had been and distinct walking tracks had formed between the campsite and the toilet facilities (about 100 m away), and campsite and a stream-side experiment (about 300 m away). New Zealand and US national programme records indicate that the site has been undisturbed since the summer of 2004/05.
Vanda experimental treading trial sites
At the eastern end of Lake Vanda, in the Wright Valley, are the Vanda experimental treading trial sites (Fig. 1). The trial was undertaken at two sites of contrasting parent material, the Vanda Fan and Vanda Rocky sites (unofficial names), during the 1993/94 summer season (Campbell et al. Reference Campbell, Claridge and Balks1998). Campbell et al. (Reference Campbell, Claridge and Balks1998) recorded changing ground surface characteristics as the walking track formed after 20, 50, 100, and 200 passes. The two sites have been undisturbed since the trial was established and no remediation of the sites was attempted.
Former Vanda station
Vanda station (unofficial name) (Fig. 1) was established adjacent to Lake Vanda, in the 1968/69 summer to support research in the Wright Valley. Human occupation left the former station site disturbed by trampling, vehicle movement, excavations, and accidental spills (Webster et al. Reference Webster, Webster, Nelson and Waterhouse2003), and extensive vehicle tracks criss-crossed the site. Concerns over rising lake levels and the potential for leaching from contaminated ground into the lake system forced a step-wise decommissioning of the station over the summers of 1992/93 to 1994/95 (Hayward et al. Reference Hayward, MacFarlane, Keys and Campbell1994).
Vehicle tracks in the Wright Valley
Overland vehicles, including tractors, gnats (small three-wheeled off-road vehicles), trailers, and sleds, were used to transport equipment and supplies along the Wright Valley (Harris Reference Harris1998). Vehicles criss-crossed the floodplain of the Onyx River as they travelled along the valley floor towards Lake Vanda and Vanda station (Fig. 1). The use of vehicles in the Dry Valleys was discontinued in the late 1970s (Harris Reference Harris1998), with a move to helicopter transport. There are a few areas along the valley floor where traces of vehicle tracks are still visible.
Cape Roberts drilling project ice-free storage area
Cape Roberts (Fig. 1) is a small ice-free coastal peninsula situated on the southern side of Granite Harbour on the Antarctic mainland. In the early 1980s two New Zealand Antarctic Programme huts were erected and since then a variety of tracked-vehicles have entered the area. During the summers of 1995/96 through to 1999/2000 the (previously disturbed) site was used for winter storage of vehicles, drilling, and camp equipment, for the Cape Roberts Drilling Project (CRP) (Waterhouse Reference Waterhouse2001). A baseline survey of the ice-free storage area was carried out by Campbell & Keys (Reference Campbell and Keys1993) in the summer of 1992/93. The baseline VSA was carried out on two 10 x10 m plots (“Northern” and “Southern” plots) and provided environmental data which would enable the impact of the project to be assessed at its conclusion (Campbell & Keys Reference Campbell and Keys1993). During the CRP there were about 100 visitors per annum (Waterhouse Reference Waterhouse2001), and impacts included disturbance attributed to transport of large containers, vehicles, and helicopters. Annual environmental monitoring surveys were undertaken during the project. Following conclusion of the CRP, all storage materials were removed and site restoration was undertaken over the summers of 1999/2000 and 2000/01. Rakes were used to redistribute soil material disturbed by vehicle and walking tracks, and all indentations left by bulldozers and sledge skis were raked over. Remediation occurred at a site of localized hydraulic fluid contamination, where the drill rig had been located (75 m south-west of the permanent huts, within the “Southern plot” of Campbell & Keys (Reference Campbell and Keys1993)), and 0.6 m3 of contaminated material was removed, and the area was filled in and left to recover (Cowie Reference Cowie2001). The original huts were left in place to support ongoing tide gauge measurements.
Methods
Photograph comparisons
Study sites were analysed using comparative photographic records, the established and widely used VSA of Campbell et al. (Reference Campbell, Balks and Claridge1993), and the use of a new Desert Pavement Recovery Assessment (DPRA) method (O'Neill et al. Reference O'Neill, Balks and López-Martínez2012). A collection of existing photographs were used to accurately identify and relocate previously disturbed sites. Using the historic photographs the authors lined up features in the landscape to exactly identify a site and photographed the same view as the original photograph (e.g. Figs 2 & 3).
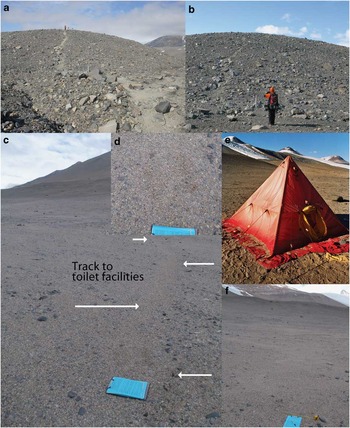
Taylor Valley Visitor Zone and Loop moraine sites. a. Taylor Valley Visitor Zone, walking track from the helicopter landing site to the hilltop lookout, 2006/07 season, after 96 tourist visitors. Picture: Jana Newman. b. Walking track from the helicopter landing site to the hilltop lookout, December 2009, before first tourist group of the season. c. Loop moraine 2004/05 walking track to toilet, track margin visible (white arrows), after five years recovery, December 2009. d. Recovery of the desert pavement on the track surface, after five years. e. Loop moraine tent site, December 2004. Picture: Fiona Shanhun. f. Loop moraine tent site, five years later, December 2009.

Visual Site Assessment
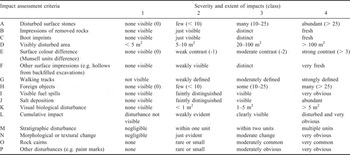
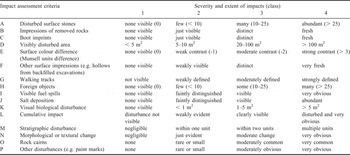
The VSA method of Campbell et al. (Reference Campbell, Balks and Claridge1993) was used to assess the present-day visual impacts at a representative area at each site. The VSA method of Campbell et al. (Reference Campbell, Balks and Claridge1993) is a rapid visual evaluation of terrestrial impacts and rates the extent of surface disturbance against 11 impact assessment criteria, such as extent of disturbed surface stones, evidence of boot imprints, and evidence of foreign objects, as a means of comparing disturbance severity across different sites (see Campbell et al. Reference Campbell, Balks and Claridge1993 for full methods and illustrations). We used Kiernan & McConnell's (2001) modified version of the original VSA which included an additional five criteria: evidence of salt deposition, stratigraphic disturbance, textural disturbance, presence of rock cairns, and “other”, such as paint marks, to give a total of 16 impact assessment criteria (Table II). Criteria are rated between one and four, one being no visible impact, and four being the most severe. A VSA was undertaken on the entire disturbed area, or typical representative area for large-scale disturbances. An adjacent equivalent control was also selected, and a VSA was undertaken. Control sites showed no visual evidence of disturbance and were situated adjacent to visually disturbed sites, comprising the same parent material, slope, aspect, and landform. The baseline VSA of the “Northern” and “Southern” plots carried out at Cape Roberts by Campbell & Keys (Reference Campbell and Keys1993) was repeated in this investigation.
Impact assessment criteria scoring system used for Visual Site Assessment (modified from Campbell et al. (Reference Campbell, Balks and Claridge1993), and Kiernan & McConnell (Reference Kiernan and McConnell2001)).
Desert Pavement Recovery Assessment
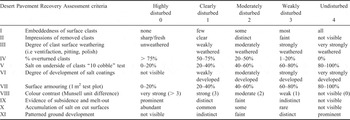
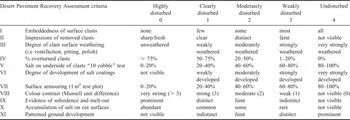
The DPRA of O'Neill et al. (Reference O'Neill, Balks and López-Martínez2012) was used to quantify the relative stage of desert pavement recovery following physical disturbance. The DPRA is an assessment method based on a set of 11 morphological features (termed recovery assessment criteria) that change over time as a desert pavement re-establishes and stabilizes (Table III). The DPRA gives an indication of where a disturbed site is placed, with respect to visual recovery, along the continuous spectrum of desert pavement rehabilitation. Recovery assessment criteria I–VI (Table III) relate to surface clast characteristics, such as embeddedness of surface clasts, impressions of removed clasts, and degree of clast surface weathering. Recovery assessment criteria VII and VIII are desert pavement attributes, such as pavement armouring per 1 m2 (interlocking nature of the desert pavement, % of large to small clasts) and pavement colour contrast. Recovery assessment criteria IX–XI are indicators of surface stability, such as evidence of subsidence or melt out, or evidence of patterned ground development. Criteria are assigned an extent of development rating from zero to four, zero being undeveloped (or highly disturbed), and four being highly developed (or undisturbed). A detailed description of the DPRA is included in O'Neill et al. (Reference O'Neill, Balks and López-Martínez2012). The development of desert pavement features is dependent on a range of factors including climate, parent material, and surface age. Therefore, to assess the visual recovery of a surface following disturbance it is necessary to make a comparison of the recovery criteria for the disturbed site with the recovery criteria assessed from an adjacent undisturbed equivalent surface. Finally an overall mean recovery index (MRI) can be assigned to each pavement surface, based on the mean percentage recovery for all criteria, with values decreasing as visible disturbance increases. A site with an MRI between 0 and 24% is rated as highly disturbed; 24–49%, forming an incipient pavement; 50–74%, the site is in an intermediate stage of rehabilitation; and 75–99%, advanced recovery. Sites with an MRI of 100% are indistinguishable from an undisturbed control site.
Desert Pavement Recovery Assessment criteria ratings (O'Neill et al. Reference O'Neill, Balks and López-Martínez2012).
Results
Visual Site Assessments
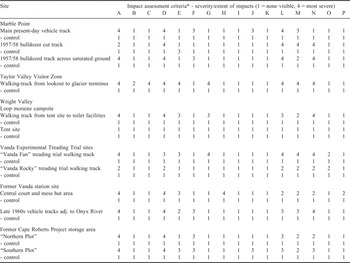
Eleven of the twelve study sites (all except the tent site at the Loop moraine), showed some differences between the disturbed and equivalent control sites, with respect to the 16 visual impact assessment criteria measured (Table IV). The five most common visual impacts amongst the 12 study sites were disturbed surface stones (A on Table II), visibly disturbed area (D), cumulative impact (L), evidence of stratigraphic disturbance (M), and textural changes to the surface (N). At no sites were there visible fuel spills (I), or visual biological disturbance (K). Impressions of removed rocks (B), boot imprints (C), and salt deposition (J), were observed at three sites.
Visual Site Assessment results for the 12 study sites, Ross Sea region, Antarctica.

*Impact assessment criteria: A = disturbed surface stones, B = impressions of removed rocks, C = boot imprints, D = visibly disturbed area, E = surface colour difference (Munsell units difference), F = other surface impressions (e.g. shallow concavities from backfilled excavations), G = walking tracks, H = foreign objects, I = visible fuel spills, J = salt deposition, K = biological disturbance, L = cumulative impact (scale 1–10), M = stratigraphic disturbance, N = morphological or textural disturbance, O = rock cairns, P = other, paint marks etc. (modified from Campbell et al. (Reference Campbell, Balks and Claridge1993) and Kiernan & McConnell (Reference Kiernan and McConnell2001)).
Desert Pavement Recovery Assessments
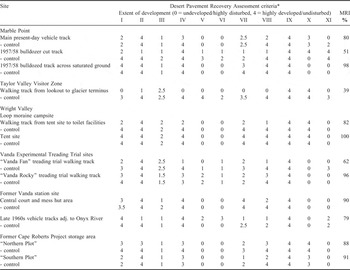
Eleven of the 12 study sites (all except the TVVZ walking track) had MRIs greater than 50% (Table V). Sites showing the greatest visual differences in desert pavement compared to an undisturbed control were the steep walking track in the TVVZ (MRI of 39%) and the 1957/58 bulldozer cut surface at Marble Point (MRI of 51%). The “Vanda Fan” experimental treading site showed intermediate desert pavement recovery with an MRI of 62%, whereas the “Vanda Rocky” site had an MRI of 96%, almost fully recovered (Table V).
Desert Pavement Recovery Assessment results for the 12 study sites, Ross Sea region, Antarctica. Note: mean recovery index (MRI) is based on the percentage recovery of each criterion, relative to the equivalent control surface.

*Desert Pavement Recovery Assessment criteria: I = embeddedness of surface clasts, II = impressions of removed clasts, III = degree of clast surface weathering, IV = % overturned clasts, V = salt on underside of clasts, VI = development of salt coatings, VII = armouring per 1 m2, VIII = colour contrast, IX = evidence of subsidence/melt out, X = accumulation of salt on cut surfaces, XI = patterned ground development. MRI = mean recovery index.
Of the 11 desert pavement recovery criteria assessed, the five criteria that showed the greatest differences between disturbed and control sites were the embeddedness of surface clasts (I on Table III), impressions of removed clasts (II), the percentage of overturned clasts (IV), armouring per 1 m2 (VII), and the colour contrast between the disturbed and control desert pavements (VIII) (Table V). At a limited number of sites accumulations of salt on the underside of clasts (V) were associated with desert pavement recovery, whereas at other sites there were isolated instances where evidence of subsidence (IX), and patterned ground development (XI), were seen to be a function of the stage of the desert pavement recovery. The TVVZ steep walking track was assigned a rating of zero (i.e. highly disturbed) for four of the five most common recovery assessment criteria (embeddedness of surface clasts, percentage of overturned clasts, armouring, and colour contrast) (Table V).
Marble Point vehicle tracks
The present-day Marble Point roadway between the landing beach and refuelling station was clearly evident. Two-to-three month old vehicle tracks had salt efflorescences on them, which were considered to be a result of salts precipitating on the surface following disturbance. Although salt was absent on both 1957/58 era examples described here, surficial salt deposits were evident on some older bulldozer cut surfaces at Marble Point, unmodified since the 1957/58 camp construction. Evidence of permafrost degradation and slumping was visible at a number of bulldozer cut tracks that linked the former camp with the beach staging area where supplies and equipment would have been offloaded. Large boulders lined the margins of the 1957/58 era bulldozed track, and cleat marks were visible in the inner part of the track. Algal growth was equally abundant across the late 1950s vehicle track crossing the periodically saturated ground and undisturbed saturated area, in spite of traces of the track remaining a distinct feature of the contemporary landscape. The present-day vehicle track and the late 1950s vehicle track across the saturated ground were in an advanced stage of desert pavement rehabilitation, with MRIs of 80% for the present-day vehicle track, and 98% for the vehicle track crossing the saturated ground (Table V). The 1957/58 era bulldozed track had an MRI of 51%, or intermediate recovery, reflected in the abundance of non-embedded rocks, impressions of removed rocks, lack of salt on the underside of rocks, and less surface “armouring” at the disturbed site. A strong colour contrast between the vehicle track and the adjacent control was also observed (Table V).
Taylor Valley Visitor Zone
The Taylor Valley Visitor Zone was visited in late December 2009, prior to the arrival of the first tourists for the 2009/10 summer. The walking track between the hilltop lookout and the terminus of the Canada Glacier sloped between 8° and 15° and was clearly visible (Fig. 2b). There was an abundance of disturbed surface stones, a clear surface colour difference, stratigraphic disturbance, and textural change (Table IV). On the steepest part of the slope our footprints broke through the desert pavement and well into the underlying fine-grained material, leaving distinct footprints. The walking track showed no visible footprints on our arrival, suggesting that individual footprints are obliterated over the course of the winter season. However, photograph-replication revealed that the colour contrast between the walking track and the adjacent control persisted between seasons (cumulative), but was less pronounced after the site had a winter to recover, implying that some desert pavement recovery occurs between tourist seasons (Fig. 2a & b). The TVVZ steep walking track had the lowest MRI of all the study sites (39% or incipient desert pavement formation) due to an abundance of impressions of removed clasts, non-embedded clasts, > 75% overturned clasts, and strong colour contrast, compared to the adjacent control site (Table V). The visibly disturbed area was about 300 m2 (300 m long x 1 m wide), and the cumulative impact of visitors using the walking track on a regular basis was obvious.
Loop moraine campsite
At the Loop moraine campsite, the 2004/05 walking track between the tents and toilet facilities had abundant disturbed surface stones, and distinct surface texture change (Table IV). The ground surface had an indentation effect, the result of sorting of rock material and compaction of the inner part of the track (Fig. 2c & d). The walking track had a moderate colour contrast between the track and the adjacent undisturbed material, which is probably the result of the larger, and darker, dolerite rocks having moved to the outer margins of the track due to foot traffic (Fig. 2c). The visibly disturbed area was about 450 m2 (300 m long x 1.5 m wide), and the foot track was clearly evident five years after the disturbance.
In contrast, at the Loop moraine campsite, the impacts around the tent site, caused by widespread random trampling (Fig. 2e), were undetectable (Fig. 2f). There were no visibly disturbed stones, no impressions of rocks removed, no boot imprints and no visible surface colour difference. In less than five years the desert pavement at the tent site showed visual recovery to pre-disturbance condition (Fig. 2e & f) and was visually indistinguishable from the surrounding undisturbed material (Table IV). The tent site was the only site with an MRI of 100%, whilst the walking track from the campsite to the toilet facilities was in an advanced stage of desert pavement recovery with an MRI of 82% (Table V).
Vanda experimental treading trial sites
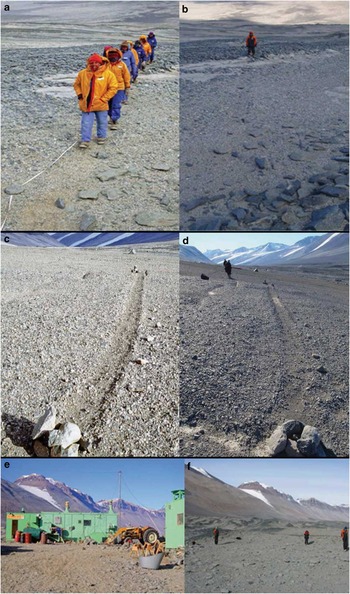
Most impacts at the “Vanda Rocky” experimental treading site were minimal or non-existent (Fig. 3a & b). Only the “softer” mixed till sections, between the slabs of coarser granodiorite bedrock, showed traces of the track (Fig. 3b). There were some unnaturally positioned bedrock slabs lining the middle of the track which had been placed there to hold the measuring tape during the experiment. There were no impressions of removed rocks, no boot imprints, or salt deposits on the surface of the “Vanda Fan” and “Vanda Rocky” treading trial sites (Table IV). In contrast, the experimental walking track on the “Vanda Fan” site, formed on an alluvial fan comprising soft mixed till materials, remained an obvious feature in the landscape 17 years after the treading trial experiment (Fig. 3c & d). The “Vanda Fan” site had an abundance of disturbed surface stones, obvious stratigraphic disturbance, and a moderate surface colour contrast (Table IV). Whilst the desert pavement of the inner part of the track had partially recovered, the larger clasts which were once scattered across the entire ground surface were concentrated along the margins of the walking track and the associated indentations persisted in the landscape (Fig. 3d). The “Vanda Fan” site was in an intermediate stage of visual desert pavement recovery (MRI of 62%), whilst the “Vanda Rocky” site, which had higher cobble to sand fraction and greater resistance to the original trampling impacts, was in an advanced stage of desert pavement recovery (MRI of 96%) (Table V). The visibly disturbed area of the “Vanda Fan” site was 20 m2, with 6 m2 at the “Vanda Rocky” site.
Vanda experimental treading trial and former Vanda station sites. a. “Vanda Rocky” site, 192 passes, December 1993. b. “Vanda Rocky” site, after 17 years of recovery, December 2009. Note the “out of place” stones that were used to secure the measuring tape in December 1993. c. “Vanda Fan” site, immediately after 200 passes, December 1993. d. “Vanda Fan” site, after 17 years of recovery, December 2009. e. Vanda station, January 1992, immediately prior to removal. f. Site of the former Vanda station mess hut, December 2009. The three people are marking the corners of the former buildings.

Former Vanda station site
Thorough cleanup of the former Vanda station site made it difficult to locate the site of the former central court and mess hut (Fig. 3e & f), even though a member of our party had stayed at the site on a number of occasions. There were no visible footprints or evidence of vehicle or walking tracks within the central court area. All building materials had been removed and displaced rocks had been redistributed. There were no impressions of removed rocks, no boot imprints, no visible salt deposition, or visual evidence of biological disturbance, although there were some nails and other foreign objects visible in the central area (Table IV). It is probable that the foreign objects observed at the surface at the time of investigation were exposed by the same winnowing processes that rehabilitate the desert pavement. Clasts were less embedded and there was a greater proportion of smaller rock fragments at the former station site compared with the control site. The site of the former Vanda station had a MRI of 90% (Table V), indicating the desert pavement is in an advanced stage of rehabilitation.
Late 1960s Wright Valley vehicle tracks
Tracks from 1960s and 1970s tracked and two-wheeled vehicles were clearly visible in some areas on the valley floor of the Onyx River floodplain, with abundant disturbed surface stones, and a distinct textural change between the impacted area and its paired control (Table IV). Coarser material had been effectively “sorted” to the margins of the track by wheeled vehicles, with finer grained material concentrated in the inner part of the track. The 1960s and 1970s Wright Valley vehicle tracks had an MRI of 79% (advanced stage of rehabilitation) (Table V).
Cape Roberts drilling project ice-free storage area
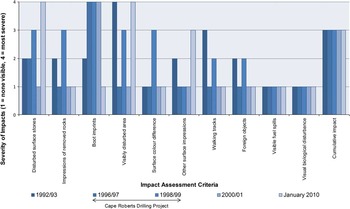
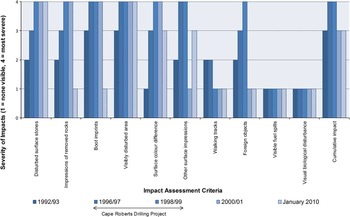
Visual Site Assessment results for the Campbell & Keys (Reference Campbell and Keys1993) “Northern Plot” and “Southern Plot” were combined with mid-project VSA monitoring undertaken in the summers of 1996/97, 1998/99, and post-remediation observations, 2000/01, to show recovery over time (Figs 4 & 5).
Visual Site Assessment of Cape Roberts Project (CRP) “Northern Plot” monitoring site, pre-CRP (1992/93, after Campbell & Keys Reference Campbell and Keys1993), during CRP (1996/97 and 1998/99, after Waterhouse Reference Waterhouse2001), after remediation (2000/01, after Cowie Reference Cowie2001), and ten years after remediation (January 2010). Note: January 2010 control scores are not shown, however, each impact assessment criteria scored a one.

At the “Northern Plot” VSAs showed the site was overall in better condition in 2010 than in the pre-CRP baseline assessment in 1992/93 (Fig. 4). This probably reflects effective site cleanup and restoration in 1999/2000 and 2000/01. The Cape Roberts sites had been disturbed on numerous occasions prior to the commencement of the Cape Roberts Drilling Project. In 2010 there was an improvement in four impact assessment criteria, including, a decrease in impressions of removed rocks, boot imprints, presence of foreign objects, and evidence of formed walking tracks. Four criteria remained the same, and the evidence of cumulative impact remained consistent at > 100 m2. Mid-project 1996/97 and 1998/99 VSAs showed an increase in impressions of removed rocks, evidence of walking tracks, and foreign objects over the duration of the drilling project. The abundance of disturbed surface stones, and other surface impressions, shows only partial recovery to baseline 1992/93 condition (Fig. 4), with rehabilitation probably an ongoing process. The “Northern Plot” had an MRI of 88% (Table V).
Visual impacts were consistently greater at the “Southern Plot” as it was the site where most vehicle and walking tracks were concentrated, and the location of the fuel rack and huts. The “Southern Plot” showed deterioration in some of the criteria re-assessed in 2010. There was a decline in four impact assessment criteria, including an increase in abundance of disturbed surface stones, and visibly disturbed areas, and evidence of other surface impressions, such as Hagglund vehicles tracks and helicopter skid marks (Fig. 5). Three impact assessment criteria remained the same, such as the extent of cumulative impact which remained consistent at > 100 m2, and four showed an improvement beyond the 1992/93 baseline assessment (impressions of removed rocks, boot imprints, evidence of walking tracks, and foreign objects). The surface colour contrast between the impacted site and the surrounding undisturbed material showed the greatest increase in the first few years of the project. Both the visibly disturbed area and cumulative impacts increased rapidly at the beginning of the CRP (see 1996/97 and 1998/99 VSAs, Fig. 5), and remained “severe” over the duration of the project. The 2010 assessment showed no obvious evidence of post-CRP environmental monitoring soil sampling pits, nor visible evidence of the removal of contaminated sand and gravel that was taken during remediation (Waterhouse Reference Waterhouse2001).
Visual Site Assessment of Cape Roberts Project (CRP) “Southern Plot” monitoring site, pre-CRP (1992/93, after Campbell & Keys Reference Campbell and Keys1993), during CRP (1996/97 and 1998/99, after Waterhouse Reference Waterhouse2001), after remediation (2000/01, after Cowie Reference Cowie2001), and ten years after remediation (January 2010). Note: January 2010 control scores are not shown, however, each impact assessment criteria scored a one.

Discussion
Random versus confined trafficking
In general, walking single file (compared with widespread trampling) reduces spatial and visual impact, but increases local impact (Campbell et al. Reference Campbell, Claridge and Balks1998, Ayres et al. Reference Ayres, Nkem, Wall, Adams, Barnett, Broos, Parsons, Powers, Simmons and Virginia2008). On young active surfaces, such as the Cape Roberts ice-free storage site, which rejuvenate quickly, the pattern of disturbance in less important. However, on repetitive use, once a confined track is formed and larger clasts concentrated to the margins of the track, giving an “indentation” appearance, visual impacts are more permanent (as we described at both the “Vanda Fan” treading trial site, and the Loop moraine walking track).
The Loop moraine campsite challenges the longstanding assumption that all disturbed desert pavements in Antarctica take many years to rehabilitate (Campbell et al. Reference Campbell, Balks and Claridge1993, Reference Campbell, Claridge and Balks1998). The Loop moraine campsite also illustrated the differences in recovery rates between confined walking tracks and randomly trampled sites. Evidence of the heavily trampled tent site was undetectable (MRI of 100%), however, walking tracks formed to-and-from the campsite were visible five years later (MRI of 82%). In hindsight, personnel occupying this camp may have chosen to either rake out the margins of formed tracks, or walk to their experimental sites and toilet in a random and widespread fashion, avoiding the formation of walking tracks. In the case of non-repeat events such as the Loop moraine campsite, we consider the formation of walking tracks should be avoided as random, widespread trampling had less lasting visual impact on the environment.
Tourist operators visiting the Taylor Valley Visitor Zone walk on established walking tracks. The walking tracks follow the margins of patterned ground polygons (known as patterned ground cracks), which are the most favourable place to concentrate visitor flow as material in patterned ground cracks is more likely to be naturally moved through freeze-thaw processes than material in polygon centres. Campbell et al. (Reference Campbell, Claridge and Balks1998) showed tracks form within the first 20 or so passes in unconsolidated materials common in the Ross Sea region, and that cumulative impacts of increasing traffic are minimal. Thus, where repeated use is planned, we consider it preferable to keep visitors to a single, confined track especially where the site has steeply sloped surfaces, with material at the angle of repose, and slopes are susceptible to down-slope movement of surficial materials when disturbed by walking.
Remediation
Site remediation (raking and smoothing of disturbed surfaces to free-up compacted soil, and redistribute out of place stones) was effective and led to accelerated visual recovery of the desert pavement on the sites studied. Ten years after remediation both the Cape Roberts study sites were nearly visually indistinguishable from equivalent control sites (“Northern Plot” MRI of 88%, “Southern Plot” MRI of 91%). We suggest the redistribution of larger stones and raking the margins of walking tracks that result from field camps (such as the Loop moraine walking track from the tent site to the toilet) would enhance the visual aesthetics by eliminating unnatural surface irregularities, and facilitate the visible recovery of previously disturbed desert pavement. Larger stones, such as those used to pin down tents at the Loop moraine campsite, must however, be replaced in original orientations with salt coated surfaces down and polished or weathered surfaces up, preferably in the indentations from which they were removed. The redistribution of disturbed rocks from vehicle and walking track margins was an effective means of remediation at the former Vanda station site (MRI of 90%), but needs to be undertaken with an understanding of the rock material's natural position in the environment.
Our observations are consistent with Campbell et al. (Reference Campbell, Claridge and Balks1998) and Kiernan & McConnell (Reference Kiernan and McConnell2001), who concluded that the natural processes of visible recovery can be given a head start by sensible rehabilitation. While the natural stratigraphy of a site cannot be restored, it is possible to mimic the natural geomorphology, dramatically reduce visual impacts, and reduce longer term changes to geomorphic processes that may cause ongoing environmental harm (Kiernan & McConnell Reference Kiernan and McConnell2001). Although raking will enhance the visual aesthetics of a site there is a question of whether by raking we are further damaging the remaining microbial communities living in the surface material. The impacts of remediative measures on residing biota have yet to be investigated, so caution must be used as we also have an obligation under Annex II (Article 1(d) and 1(h)) of the Protocol on Environmental Protection to the Antarctic Treaty to protect soil biota. Value judgments must be considered, particularly whether potential adverse impacts to biota outweigh the longer-term positive effects of site restoration. Where moderate to high-intensity disturbances have dramatically changed the contour of the land and the disturbance is likely to change drainage patterns and other geomorphic processes in the longer term, raking the disturbed area may be the best option to ensure ecosystems down-slope of the disturbance are not (also) adversely affected.
Factors influencing desert pavement recovery
The rate and extent of desert pavement recovery at the sites investigated could be attributed to a combination of the intensity of the initial disturbance; the environmental conditions for the site, including, parent material and surface characteristics (age and weathering stage), availability of water and wind regime; and also the restoration and remediation measures undertaken at the site.
Intensity of initial disturbance
Low intensity trampling impacts the top 0–5 cm of a desert pavement and underlying soil, whereas bulldozer tracks where the active layer was removed and cleat marks cut into the new surface affects the rehabilitative capability of the landscape. Where the intensity of disturbance was low, such as widespread trampling around the tent site at the Loop moraine, factors such as wind and site remediation can have the ability to restore the surface to near original visual condition. The 1957/58 bulldozed vehicle track at Marble Point, had formed side mounds with material pushed to the side of the track. With day-to-day use the track would have undergone surface compaction, thus increasing soil bulk density (Campbell et al. Reference Campbell, Claridge and Balks1998). Repetitive disturbance, such as the disturbance associated with repetitive foot traffic at the Taylor Valley Visitor Zone, although of low intensity, has a cumulative effect. Cumulative disturbances at the visitor zone did not allow full recovery of the desert pavement between summer seasons (MRI of 39%), although some recovery in terms of track colour contrast occurred over one winter season. Even once people have stopped using the track, such as the 1960s vehicle tracks in the Wright Valley (MRI of 79%), or Marble Point 1957/58 vehicle tracks (MRI of 51%), the visual impacts are likely to be long-lasting without the redistribution of displaced materials. At both Marble Point and in Wright Valley, there would have been a range of lower intensity impacts in the 1950s through to the 1970s that are no longer visible and hence not recorded here. In many cases only the highest level of intensity, bulldozed tracks and similar impacts, now remain evident for study.
Parent material and surface characteristics
Why are disturbances of equal intensity preserved at some sites and not at others? The effects of the Vanda treading trial and persistence of the resultant walking track were obvious at the “Vanda Fan” site (MRI of 62%), 17 years after the event. The colour difference associated with disturbance had largely disappeared (probably a result of wind removing the lighter coloured material exposed at the surface), however displacement of coarser particles to the margins of the track and compaction of the soft fine-grained parent material remained. Upon revisiting the “Vanda Rocky” site (MRI of 96%), traces of the track were only visible in the fine-grained sections of the track. It was obvious comparing the two parent materials that the lasting visible impact can be lessened by, wherever possible, following routes across bouldery surfaces or bedrock. Late 1960s vehicle tracks (MRI of 79%) were not continuously preserved along the Wright Valley floor, but only in softer material that had not been reworked by Onyx River flood events. In finer grained materials the initial disturbance can seem rapid and damage high, such as the Loop moraine tent site (MRI of 100%), however these materials can undergo rapid rehabilitation under favourable conditions (high moisture and/or wind regime). At the former Vanda station site (MRI of 90%), the hardy nature of the slabby granodiorite surface material meant when combined with the site remediation there was little evidence of the once widespread trampling and vehicle tracks.
Wind and moisture regime
Wind is probably the primary driver of surface recovery in most environments in the Ross Sea region (Campbell et al. Reference Campbell, Claridge and Balks1998) and we assume wind action in valley floors and low ridge sites winnows away the finer-grained material from the disturbed site until sufficient coarser-grained material is exposed and a new protective desert pavement is formed. At the Loop moraine tent site (MRI of 100%) wind action probably resulted in natural infilling of footprints and return to original surface colour. Wind action, however, was not sufficient to redistribute larger clasts that lined the margins of the Loop moraine walking-tracks or diffuse the “indentation” visible at the Loop moraine tracks (MRI of 82%) and the “Vanda Fan” treading trial site (MRI of 62%). The wind regime in the valley floors is likely to have contributed to the partial obliteration of late 1960s and 1970s vehicle tracks (MRI of 79%) along the Onyx River floodplain (along with intermittent floods from the Onyx River). In comparison, some higher and older floodplain terraces vehicle tracks remain in the landscape after over 40 years. In other areas, such as the relatively young active beach gravel sites at Cape Roberts, the soil materials are unweathered gravels which are consistent down the soil profile. As a consequence the desert pavement lacks the distinct armoured appearance and wind and water (snow melt) action quickly dissipates surface/subsurface colour contrasts.
The intermittent supply of moisture at the Cape Roberts sites (MRIs between 88% and 91%) and Marble Point (moistened by spring snow thaw and occasional summer snowfalls) may have assisted wind action in desert pavement recovery. In the drier, central mountain climatic zone, such as the “Vanda Fan” treading trial site, Loop moraine walking track, 1960s and 1970s vehicle tracks adjacent to the Onyx River, and walking tracks at the TVVZ, moisture available for soil surface processes is much less (c. 0.2% moisture in topsoil compared with 1–2% in coastal areas), and recovery was not as advanced as equivalent intensity disturbances in the moist coastal climatic zones of Cape Roberts and Marble Point.
Applications of this research
Our paper suggests that long-term environmental impacts in Antarctica can be reduced through careful site remediation and site selection, but perhaps more importantly by taking appropriate action in the project design, planning, and operational stages of the activity to minimize impacts so that remediative measures are minimal, if required at all.
Many of the soil impacts caused by low intensity soil disturbance activities like camping can be avoided, remedied, or at least mitigated if field parties are aware of the longevity of impacts and recovery capabilities of the areas they are working in. Avoiding forming walking tracks will lessen the lasting visible impact to the environment. The ability to recognize young active surfaces, such as active beach deposits, and sand dunes, where material is readily reorganized by wind or water, is important, as in these settings the initial damage of foot traffic may seem high, but the ability of surfaces to recover is greater than some older less resilient landforms and parent materials.
Further work is needed to investigate the rehabilitative capability of older sites with strongly developed desert pavements. Investigation into sites which have completely recovered, such as the sections of Wright Valley floor where the 1960s and 70 s vehicle tracks have not been preserved, and have fully recovered, could also be undertaken. By revisiting recovering sites and verifying the predicted environmental impacts, we are able to contribute to understanding the best approaches to minimize visual impacts on the Antarctic landscape.
Conclusions
Twelve sites of past human occupation and activity were investigated to assess the visual impacts of, and recovery from, foot and vehicle traffic. Study sites comprised a variety of landforms, parent materials, and climates, with the time since last disturbance ranging from three months to about 50 years prior to assessment. The extent of soil surface recovery from the physical impacts of foot and vehicle traffic in the Ross Sea region was higher than anticipated.
Eleven of the 12 study sites (all except the TVVZ walking track) had a MRI greater than 50%. Sites showing the greatest visual differences in desert pavement compared to an undisturbed control were the steep walking track in the TVVZ (MRI of 39%) and the 1957/58 bulldozer cut surface at Marble Point (MRI of 51%). Sites with the highest MRIs were the former tent site at the Loop moraine (MRI of 100%, indistinguishable from the control site) and the vehicle track crossing periodically saturated ground at Marble Point (MRI of 98%), which was in an advanced stage of desert pavement recovery.
Formed walking tracks remained visible in the landscape due to the persistence of larger rocks and loose material concentrated at the outer margins of the walking track. However, randomly dispersed footprints on surfaces were often recovered and undetectable within five years. Widespread, dispersed trampling around one-off campsites is recommended to minimize overall visible impact in the medium term. Walking in patterned ground cracks minimized impacts on stable desert pavement surfaces and should be undertaken where practicable. At steep sloped sites, and sites where repeated visits occur, such as the TVVZ, the use of a single confined walking track is recommended.
Concentrating activity on more resilient parent materials, such as bouldery or bedrock surfaces, as seen at the former Vanda station site (MRI of 90%), and the “Vanda Rocky” treading trial (MRI of 96%), lessens lasting visible impacts to the environment. Where softer sediment cannot be avoided, site remediation was effective at reducing visible disturbance and aiding surface pavement recovery.
Site remediation activities, including replacing larger moved stones back in their original positions, ensuring that surface stones are placed with the weathered side up, and raking of gravel sand-sized displaced materials, can all be effective at enhancing the rate and degree of surface recovery. Remedial activities such as raking should only be carried out on areas that have been disturbed already, where there are gravelly sand materials which lack a strongly developed desert pavement. Consideration must be given to ensuring that the overall environmental effects of the remediative activities do not cause more impact than they cure, particularly with respect to impacts on microbial communities. Further investigation into older, highly weathered landscapes (where there is a greater weathering contrast between surface and subsurface materials), a greater number of previously disturbed sites (on varying landforms, parent materials, climatic regimes, and impact intensities), and recovered sites are needed to further advance our understanding of differences in surface rehabilitative capabilities.
Acknowledgements
The authors wish to thank Antarctica New Zealand for logistic support over the summers of 2008/09 and 2009/10. Funding was provided by the Landcare Research Murray Jessen Memorial Doctoral Scholarship. We are grateful to Errol Balks for field assistance, Margaret Auger and Nathan Cross for science support at Scott Base, and Jana Newman for technical advice. We appreciate the useful comments from reviewers.