1. Introduction
The origin and significance of the limestone beds and nodules in the uppermost Rhaetian (Triassic) to Sinemurian (Jurassic) Blue Lias Formation of Britain has long been a subject of interest (Day, Reference Day1865; Richardson, Reference Richardson1923; Kent, Reference Kent1936). Hallam (Reference Hallam1960, Reference Hallam1964) argued that the limestones owed their characteristics to both diagenetic and primary (i.e. depositional) factors. Shukri (Reference Shukri1942) speculated on the possible role of climate but ruled out forcing by Milankovitch orbital-precession cycles because the limestone beds at Lyme Regis are more widely spaced in the lower Sinemurian compared to the Hettangian. Following the demonstration by Hays, Imbrie & Shackleton (Reference Hays, Imbrie and Shackleton1976) of orbital forcing of Pleistocene to Recent climate, House (Reference House1985, Reference House1986) and Weedon (Reference Weedon1985, Reference Weedon1986) revived the idea of orbital-climatic (Milankovitch cycle) forcing to explain the interbedded lithologies.
One of the reasons the Blue Lias Formation has attracted so much research interest is that it exhibits two styles of sedimentary cyclicity. Visually most obvious are the alternations of limestones and non-limestones, but also present are alternations of homogeneous, organic-carbon-poor strata (grey limestone plus light grey marl) with laminated organic-carbon-rich strata (black to very dark grey laminated shale plus laminated limestone). Dark grey marls represent intermediate compositions. The homogeneous limestone beds and layers of nodules are considered to have formed diagenetically within light marl beds while the much rarer laminated limestone beds and laminated limestone nodules formed within primary laminated shale beds (Hallam, Reference Hallam1964; Weedon, Reference Weedon1986, Reference Weedon1987a; Arzani, Reference Arzani2004).
Weedon (Reference Weedon1986, Reference Weedon1987a) showed, using time-series analysis, that the alternation of the limestone with the non-limestones can encode a similar signal of regular cycles to that of the alternating homogeneous and laminated rock-types. However, in thicker sections such as those exposed on the West Somerset coast, multiple limestone beds and/or nodule horizons occur within thick (tens of centimetre- to metre-scale) light marl beds. A recent analysis of orbital forcing in the relatively thick sections on the West Somerset coast (Ruhl et al. Reference Ruhl, Deenen, Abels, Bonis, Krijgsman and Kürschner2010) specifically avoided sampling the limestones that nonetheless represent a critical part of the sequence. This paper is designed to clarify the nature of the information conveyed by the limestones, both laminated and homogeneous.
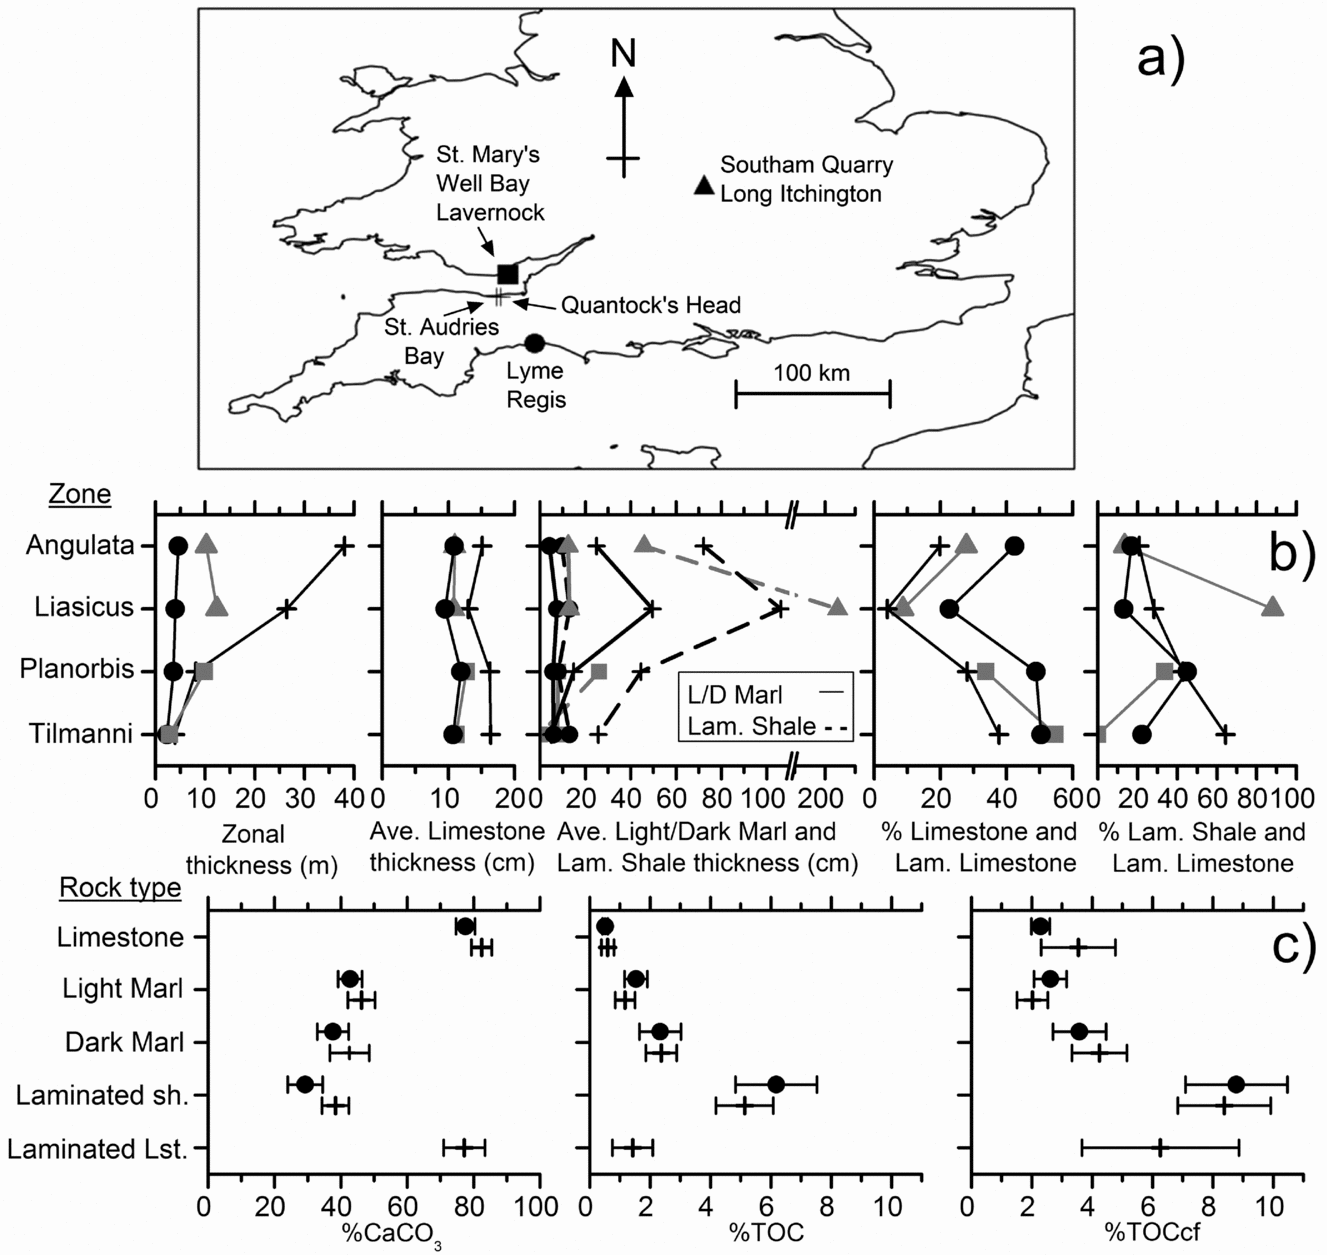
New, high-resolution lithostratigraphic and magnetic-susceptibility logs for four sections (Fig. 1) are presented together with refinements of the ammonite biostratigraphy. The sections chosen within ‘typical offshore’ Blue Lias span all the ammonite zones of the Hettangian Stage and represent a wide range of net accumulation rates. The aims are to explain why: (a) limestone bed thicknesses are apparently independent of the net accumulation rate; (b) the spacing of the limestone beds within ammonite zones can be related to Milankovitch orbital cycles although there are large variations in spacing from zone to zone and from place to place; (c) laminated limestone beds and laminated limestone nodules are comparatively rare; and (d) some limestone beds preserve abundant ammonite fossils, but others preserve none. We present new evidence for intra-formational hiatuses and a synthesis of limestone formation in terms of combined climatic and sea-level controls plus an improved understanding of the preservation of the ammonites.
(a) Location of the sections illustrated in Figures 3–6. (b) Formation characteristics according to Hettangian ammonite zone and location. Data from logs shown in Figures 3–6. The symbols in (a) indicate the localities. The percentage of limestone refers to the thickness of limestone logged as limestone or laminated limestone beds, or if more than 50% of a particular level, limestone or laminated limestone nodules. Ave. – average; L/D – Light/Dark; Lam. – laminated. (c) Average rock-type composition at Lyme Regis and on the West Somerset coast (St Audries Bay and Quantock's Head sections) in terms of weight per cent calcium carbonate (%CaCO3), total organic carbon (TOC) and TOC re-expressed on a carbonate-free basis (TOCcf). Horizontal bars denote 95% confidence intervals around the mean. Data and analytical methods from Weedon (Reference Weedon1987a): 90 samples from the Angulata and Bucklandi zones at Lyme Regis and 57 samples from the Tilmanni to Bucklandi zones on the West Somerset coast. These data are supplemented using a further 38 SAB samples (Hesselbo et al. Reference Hesselbo2008) from the Tilmanni and Planorbis zones at St Audries Bay. Numbers of samples analysed by rock-type for Lyme Regis versus West Somerset coast, respectively, are: limestone and limestone nodules 31 v. 17; light marl 23 v. 17; dark marl 20 v. 19; laminated shale 16 v. 35; laminated limestone samples from West Somerset coast alone, 7. The average %TOCcf values and their uncertainties in the different rock-types are consistent with the limestones formed by carbonate cementation of light marls and with the laminated limestones formed by carbonate cementation of laminated shales.

2. Bio- and chronostratigraphy
2.a. Ammonite biochronology and correlation
The Jurassic System is divided into a sequence of 11 globally applicable stages that are subdivided, without gaps or overlap, into regional sequences of ammonite-correlated ‘zones’ (Ogg & Hinnov, Reference Ogg, Hinnov, Gradstein, Ogg, Schmitz and Ogg2012). Since ammonite zones completely fill each stage, and are now usually explicitly defined with a basal stratotype, they can also be considered to be chronostratigraphical units (Callomon, Reference Callomon, Michelsen and Zeiss1985, Reference Callomon and Le Bas1995; Page, Reference Page1995, Reference Page, Ineson and Surlyk2003, in press). The great majority of zones do not conform in any way to a classical biozone since they do not correspond to the range of any ammonite species or assemblage.
In the present work, we refer neutrally to the ammonite-correlated stratigraphical units as ‘Standard’ Zones and Subzones (sensu Callomon, Reference Callomon, Michelsen and Zeiss1985), rather than using an epithet to describe their character (i.e. ‘chronozone’ and ‘subchronozone’ as in Page, Reference Page2010a,b,Reference Page, Lord and Davisc). However, as chronozones, these units can be explicitly correlated using proxies other than ammonites, such as local lithological changes, other faunal or floral elements and isotopic ‘events’ (Jenkyns et al. Reference Jenkyns, Jones, Gröcke, Hesselbo and Parkinson2002).
Throughout the Jurassic System, infra-subzonal units that are often referred to as biohorizons provide a very high-resolution biochronology. Biohorizons typically correspond to the stratigraphic range of a specific indicator species. Normally, the bases of ammonite Standard Zones are explicitly, or effectively, defined by the bases of specific biohorizons, and hence correlated, as potential timelines, by the stratigraphically lowest occurrences of the indicator species.
The initial biohorizonal framework for the Lower Sinemurian Stage in the UK of Page (Reference Page1992) led to the schemes applied by Page (Reference Page2002, Reference Page, Lord and Davis2010b) to the Devon and Dorset coastal sections. The scheme for the Hettangian Stage of the Devon/Dorset coast (Page, Reference Page, Lord and Davis2010b,Reference Page, Lord and Davisc) was based largely on the version for West Somerset by Page (Reference Page2005), but recent re-sampling of the latter area has revealed even greater biostratigraphical detail, which is used here. This new scheme provides a sequence of 55 biohorizons for the Hettangian, as opposed to the 27 used by Page (Reference Page, Lord and Davis2010b,Reference Page, Lord and Davisc).
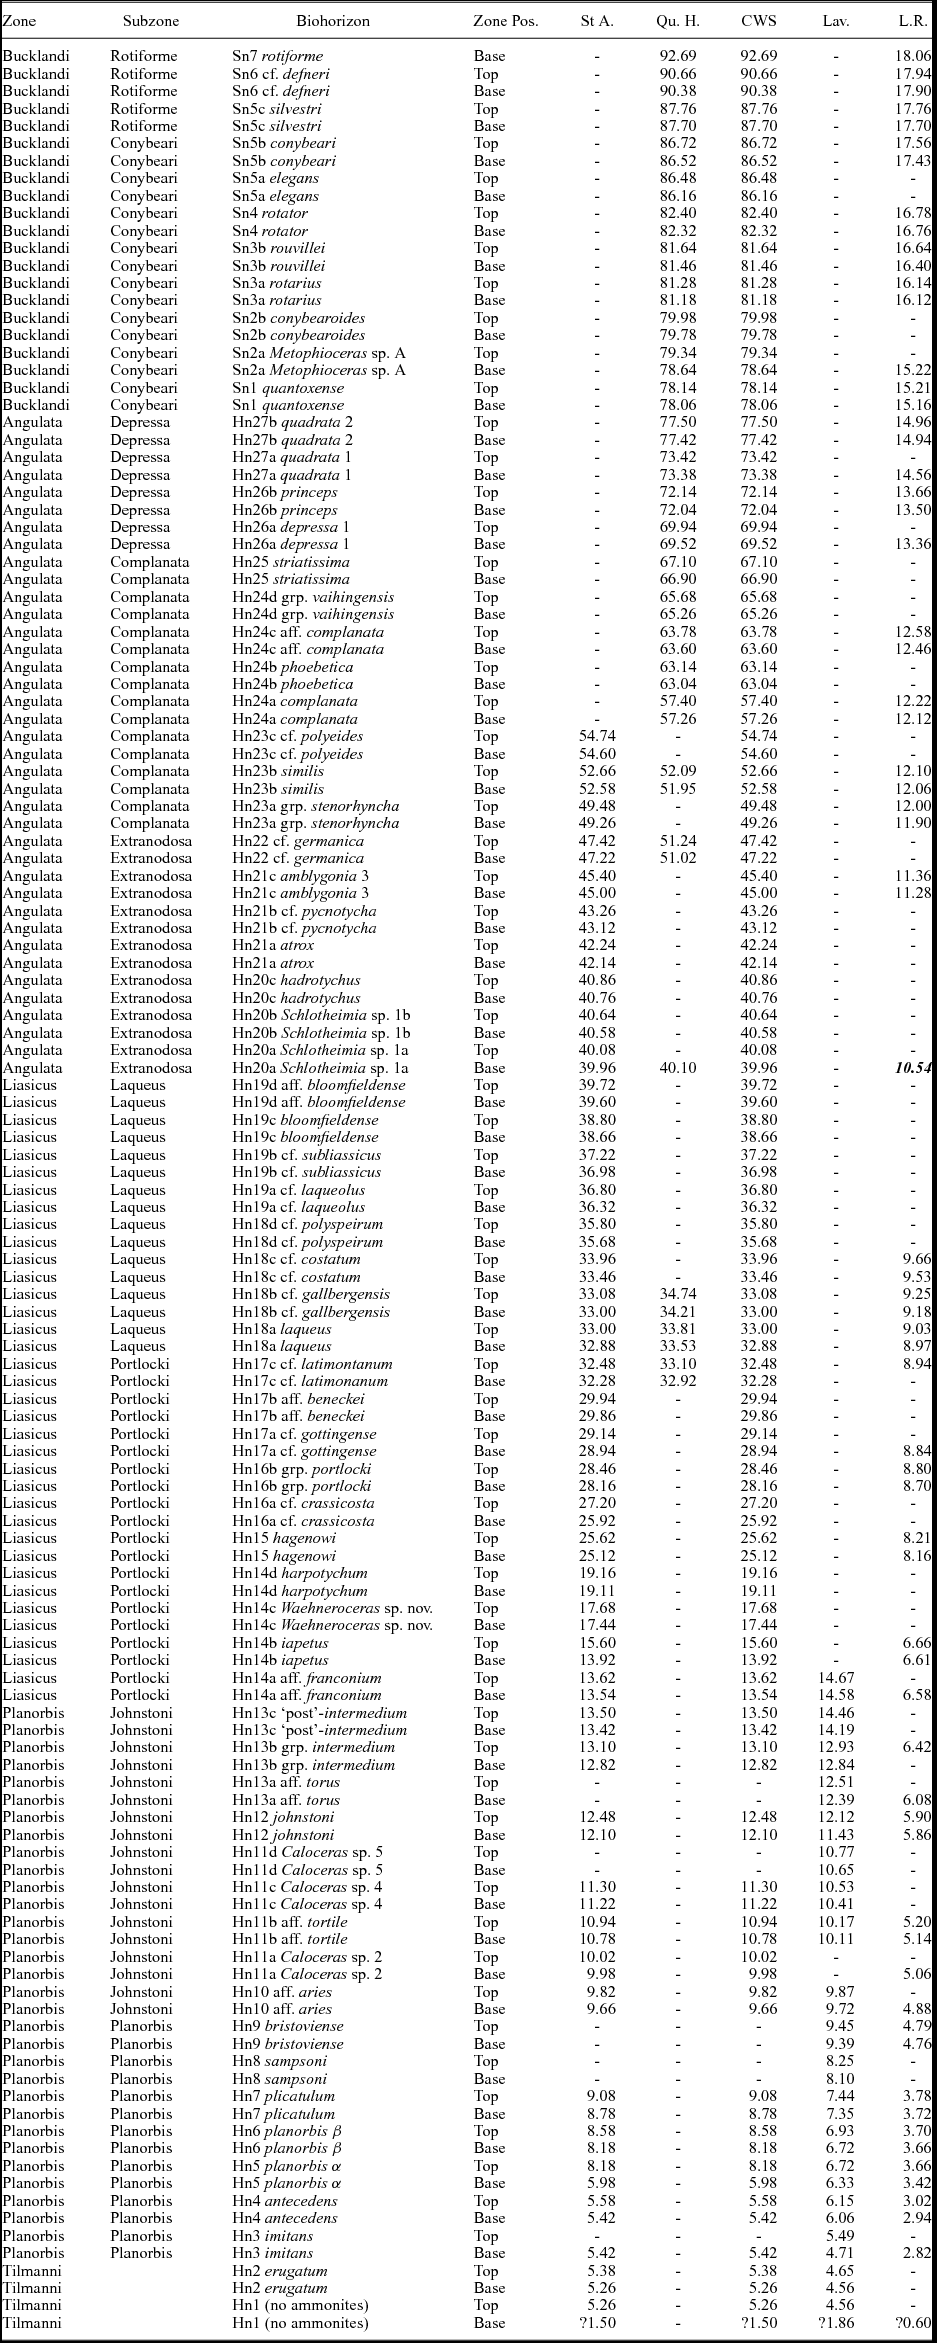
Zonal and subzonal boundaries throughout the Hettangian have been reviewed, based on new sampling by K.N.P. on coastal sections (Fig. 1a) in East Devon (Lyme Regis), West Somerset (Doniford, St Audries Bay, East Quantocks Head to Kilve) and South Glamorgan, South Wales (St Mary's Well Bay, Lavernock). The biohorizon boundaries, where constrained to within a few centimetres stratigraphically, are indicated in Table 1. Within the Lower Sinemurian of West Somerset, the placement of biohorizon boundaries are as previously published (e.g. Bloos & Page, Reference Bloos, Page, Hall and Smith2000b; Page Reference Page, Lord and Davis2010b,Reference Page, Lord and Davisc).
Ammonite biohorizon limits on the West Somerset (St Audries Bay and Quantock's Head), Devon/Dorset (Lyme Regis) and South Wales (Lavernock) coast sections

Height in metres of biohorizon boundaries above base of the Blue Lias Formation. The value in bold italics for the base Angulata Zone at Lyme Regis was estimated using the correlation with the St Audries Bay section (see Fig. 8, Section 5.a.). Pos. – Position; St A. – St Audries Bay section, Somerset; Qu. H. – Quantock's Head section, Somerset; CWS – Composite West Somerset coastal sections using common splice level at 56.90 m (below this level the heights for Quantock's Head differ from the CWS heights); Lav. – St. Mary's Well Bay section near Lavernock, South Wales; L.R. – Pinhay Bay to Devonshire Head section, Lyme Regis, Dorset.
2.b. The base of the Jurassic
The Global Stratigraphic Section and Point (GSSP) for the base of the Jurassic has been defined in the Kuhjoch section in the Austrian Calcareous Alps (Hillebrandt, Krystyn & Kuerschner, Reference Hillebrandt, Krystyn and Kuerschner2007; Hillebrandt & Krystyn, Reference Hillebrandt and Krystyn2009). Subsequently Page (Reference Page, Lord and Davis2010b,Reference Page, Lord and Davisc) revised the zonal framework for the base of the Hettangian Stage in the UK by inserting the former authors’ Tilmanni Zone below the Planorbis Zone (which was previously considered to be the lowest zone of the Jurassic System).
Page (Reference Page, Lord and Davis2010b,Reference Page, Lord and Davisc) concluded that only the top of the Tilmanni Zone in the UK had yielded ammonites, specifically Psiloceras erugatum (Phillips) as illustrated by Bloos & Page (Reference Bloos, Page, Hall and Smith2000a). Nevertheless, in the UK the base of the Zone and hence the base of the Jurassic System can still be approximated using the most positive part of a positive δ13Corg interval, as demonstrated by Clémence et al. (Reference Clémence, Bartolini, Gardin, Paris, Beaumont and Page2010). At St Audries Bay on the West Somerset coast (Fig. 1), the base of the Hettangian corresponds to a level less than 1.5 m above the base of the Blue Lias Formation (Clémence et al. Reference Clémence, Bartolini, Gardin, Paris, Beaumont and Page2010). At St Mary's Well Bay near Lavernock, South Wales (Fig. 1), the δ13Ccarb curve of Korte et al. (Reference Korte, Hesselbo, Jenkyns, Rickaby and Spotl2009), based on measurements of Liostrea sp. samples, suggests that the base of the Jurassic System lies about 1.9 m above the top of the Langport Member (Penarth Group, Upper Triassic). The δ13Ccarb curve produced from bulk sediment samples from the coast at Lyme Regis on the Devon/Dorset border by Korte et al. (Reference Korte, Hesselbo, Jenkyns, Rickaby and Spotl2009) is, however, of limited use for correlation because it does not show the same signature as elsewhere. Nevertheless, it is likely that the base of the Jurassic System in the area also lies in the lowest part of the Blue Lias Formation.
2.c. The base of the Planorbis Zone
The base of the Planorbis Zone, as correlated by the first appearance of Neophyllites at the base of the Hn3 imitans Biohorizon (Page, Reference Page2010a), corresponds to the base of bed 9 of Whittaker & Green (Reference Whittaker and Green1983) on the West Somerset coast (Page & Bloos, Reference Page and Bloos1995; Bloos & Page Reference Bloos, Page, Hall and Smith2000a). In South Glamorgan, in St Mary's Well Bay, Lavernock, the base of the Planorbis Zone is about 12 cm below the base of bed 30 of Waters & Lawrence (Reference Waters and Lawrence1987), i.e. the level indicated by Hodges (Reference Hodges1994) within his bed 38. At Lyme Regis, this level correlates with the base of bed H25 of Lang (Reference Lang1924); see Page (Reference Page2002).
2.d. Southam Quarry near Long Itchington
At Southam Quarry, Long Itchington, Warwickshire, below bed 10 of Clements et al. (Reference Clements1975, Reference Clements1977) ammonites are rare (Radley, Reference Radley2008) and the lowest part of the Blue Lias Formation is inferred to belong to the Liasicus Zone (i.e. the Tilmanni and Planorbis zones are missing). This interpretation follows from the location of Long Itchington in relation to the reconstructed age of onlap of the Blue Lias Formation onto the London-Brabant Platform by Donovan, Horton & Ivimey-Cook (Reference Donovan, Horton and Ivimey-Cook1979). Furthermore, it is consistent with the records of Old, Sumbler & Ambrose (1984, p. 34), who cite Laqueoceras and Waehneroceras ‘close above the Langport Member’ at Southam Quarry. Laqueoceras certainly indicates the lower part of the Laqueus Subzone Hn18 Biohorizon of Page (Reference Page, Lord and Davis2010b,Reference Page, Lord and Davisc). However, specimens of Waehneroceras from Southam Quarry include species from the upper part of the Portlocki Subzone, including abundant examples of W. portlocki (Wright), in limestone nodules and rare W. cf. shroederi Lange in limestone beds. These observations suggest that at least biohorizons Hn16 and Hn17 of Page (Reference Page, Lord and Davis2010b,Reference Page, Lord and Davisc) are also present.
3. The sections studied and the lithostratigraphic and magnetic-susceptibility logs
Lithological logging, whilst measuring magnetic susceptibility (MS) in the field, utilized the five microfacies or rock-types of Weedon (Reference Weedon1986, Reference Weedon1987a), as adopted by others (e.g. Bottrell & Raiswell, Reference Bottrell and Raiswell1989; Arzani, Reference Arzani2004, Reference Arzani2006; Paul, Allison & Brett, Reference Paul, Allison and Brett2008), i.e. homogeneous grey limestone, laminated grey limestone, light grey marl, dark grey marl and millimetre-laminated black shale. Limestone nodules occur within light marl beds and locally pass laterally into continuous limestone beds (e.g. at Lyme Regis bed 37 or ‘Rattle’: Lang, Reference Lang1924 and Hesselbo & Jenkyns, Reference Hesselbo, Jenkyns and Taylor1995 provide all the limestone bed names for the Devon/Dorset coast). Laminated limestone nodules occur within the laminated black shales. Large differences in net accumulation rates in the sections studied are suggested by the thicknesses of zones shown in Figure 1b, and the average composition of the rock-types is indicated in Figure 1c and discussed further in Section 4.
3.a. Measurements of magnetic susceptibility in the field
Volume magnetic susceptibility (vol. MS) logging of sections used a Bartington Instruments MS2 meter combined with an F-probe in direct contact with fresh faces of rock at right angles to the bedding. Instrument drift, related to temperature changes, was removed by taking measurements in the air more than 1 m from the cliff face between each rock-surface measurement. At the levels of limestone nodules, MS was measured in the limestone rather than light marl in cases where limestone constituted more than half of that stratigraphic level (Weedon et al. Reference Weedon, Jenkyns, Coe and Hesselbo1999). As far as possible, calcite ‘beef’ veins and lenses (Richardson, Reference Richardson1923; Marshall, Reference Marshall1982), most prevalent at the base of laminated shale beds at Lyme Regis, were avoided during MS measurement.
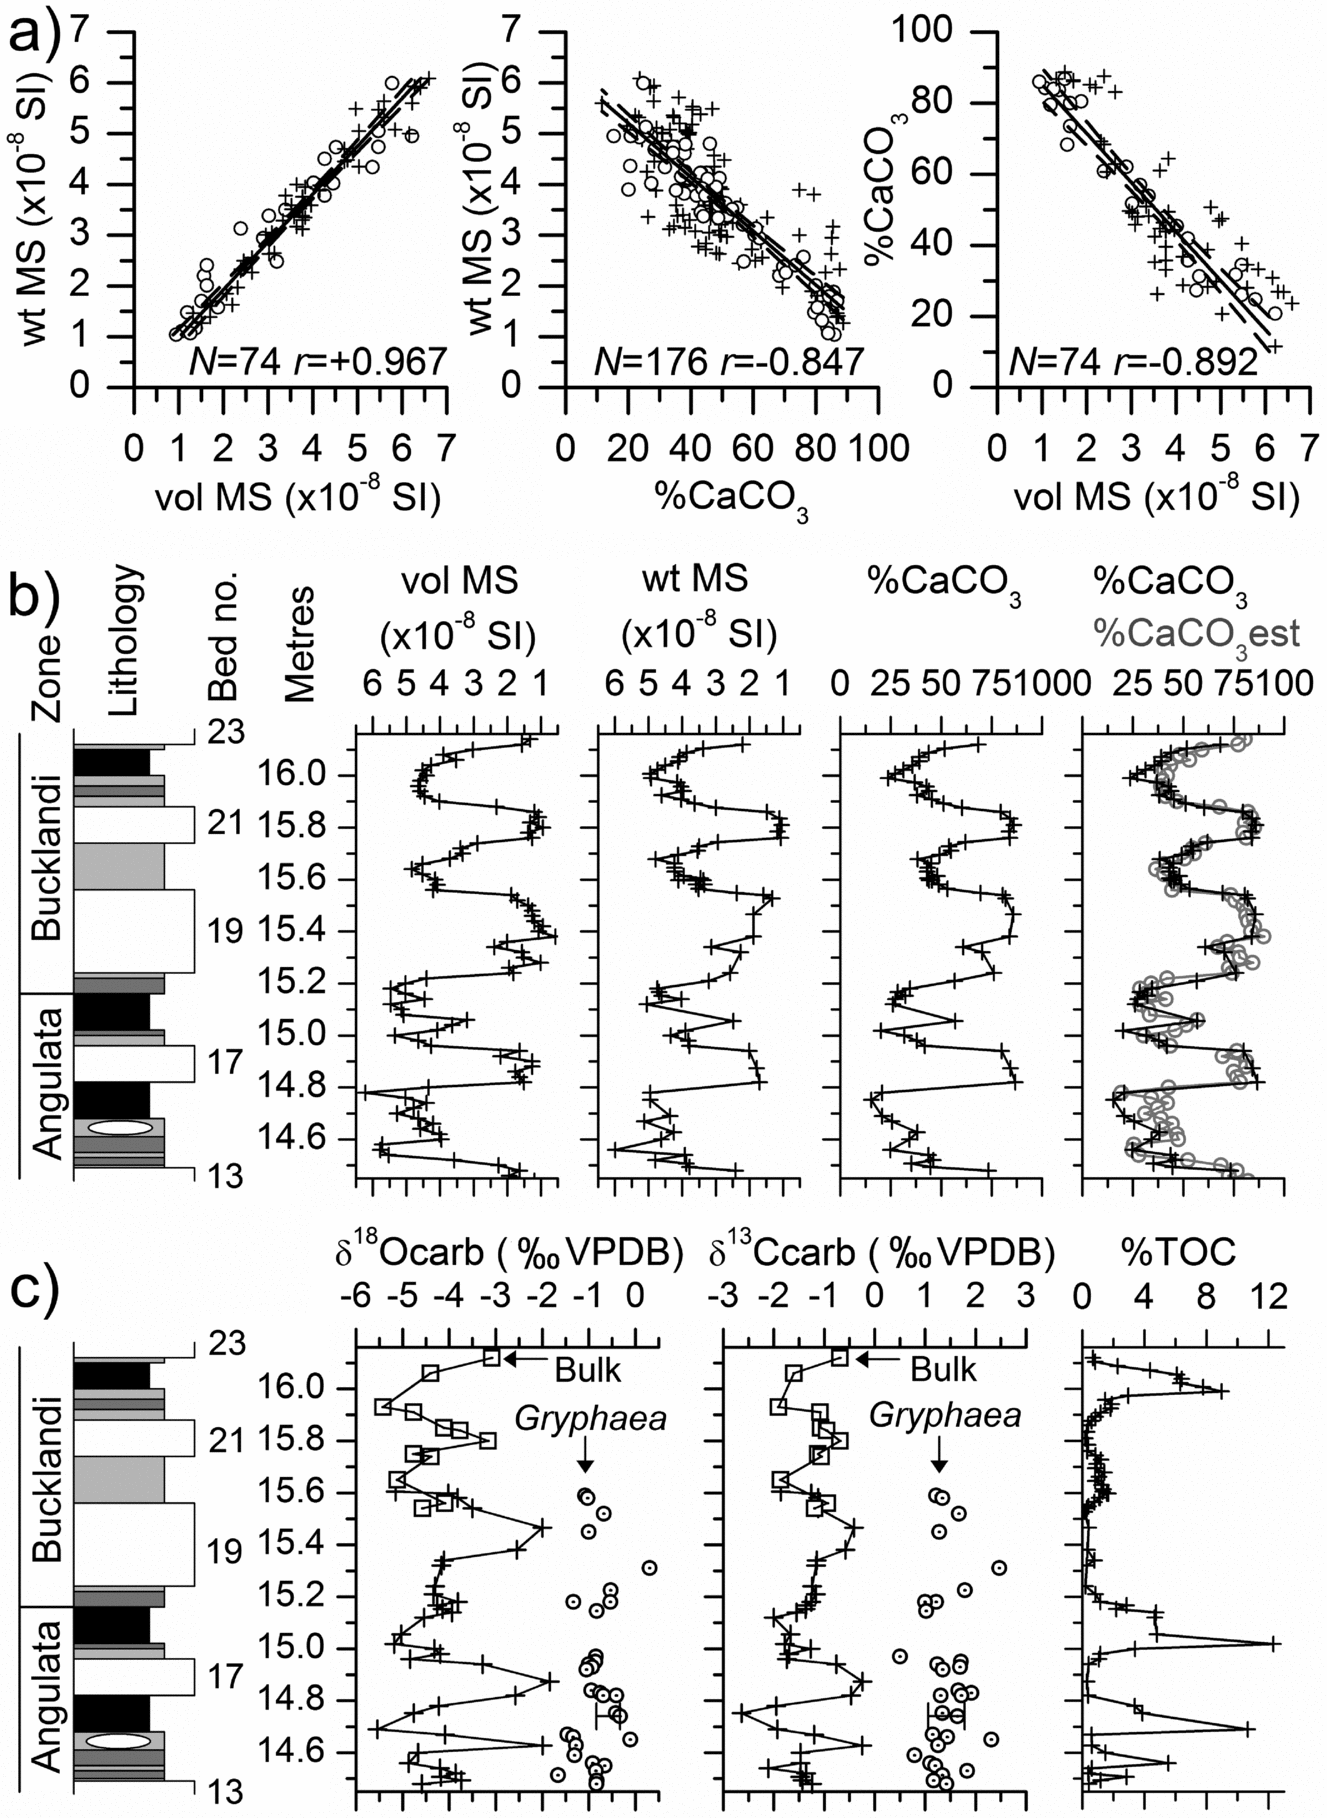
Measurements of weight-specific MS (wt MS) using a Bartington Instruments MS2B sensor for samples from Lyme Regis and the West Somerset coast show the expected strong, linear correlation with vol. MS (Pearson's r = +0.967, N = 74, P < 0.001, Fig. 2a). This relationship and the similarity of both the vol. MS and wt MS logs to %CaCO3 in Figure 2b confirm that the field measurements are neither significantly affected by changes in magnetic properties due to weathering, nor by incomplete rock sensing due to imperfect surface contact and/or undetected voids.
(a) Scatter plots of field measurements of vol. MS, and laboratory measurements of wt MS and %CaCO3. The dashed lines indicate the 95% confidence intervals of the regressions. N – number of samples; r – Pearson's r (degree of correlation); ○ – sample from Lyme Regis; + – sample from West Somerset coast. The stratigraphic locations of the samples are indicated in Figures 4 and 5. (b) Profiles of vol. MS and %CaCO3 measurements at Lyme Regis in beds 13 to 23 (bed numbers from Lang, Reference Lang1924). + – measurement of vol. MS, wt MS or %CaCO3; ○ – estimated %CaCO3 based on regression between vol. MS and %CaCO3 (Fig. 2a); see text Section 3.b. (c) Profiles of measurements of δ18O and δ13C and %TOC at Lyme Regis in beds 13 to 23. + – bulk sample δ18O and δ13C from Weedon (Reference Weedon1987a); □ – bulk sample δ18O and δ13C from Paul, Allison & Brett (Reference Paul, Allison and Brett2008); ○ – Gryphaea sp. sample δ18O and δ13C from Weedon (Reference Weedon1987a). Key to rock-types in Figure 3.

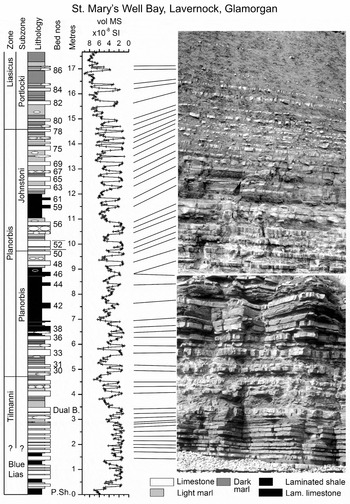
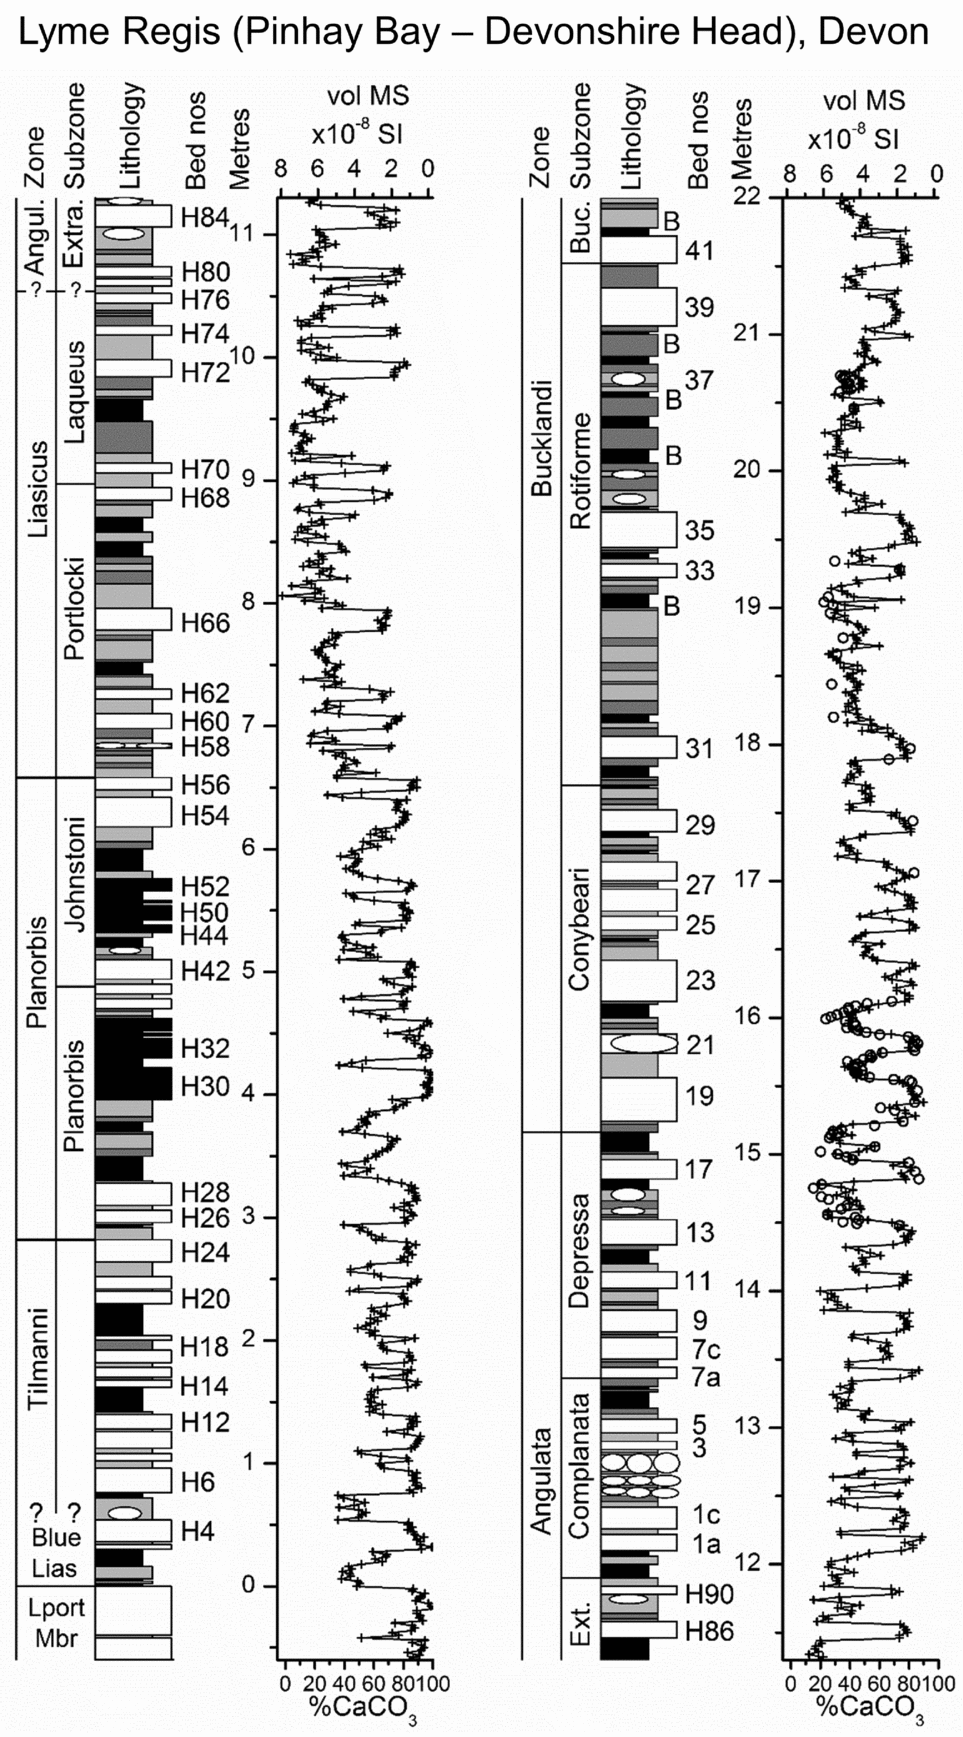
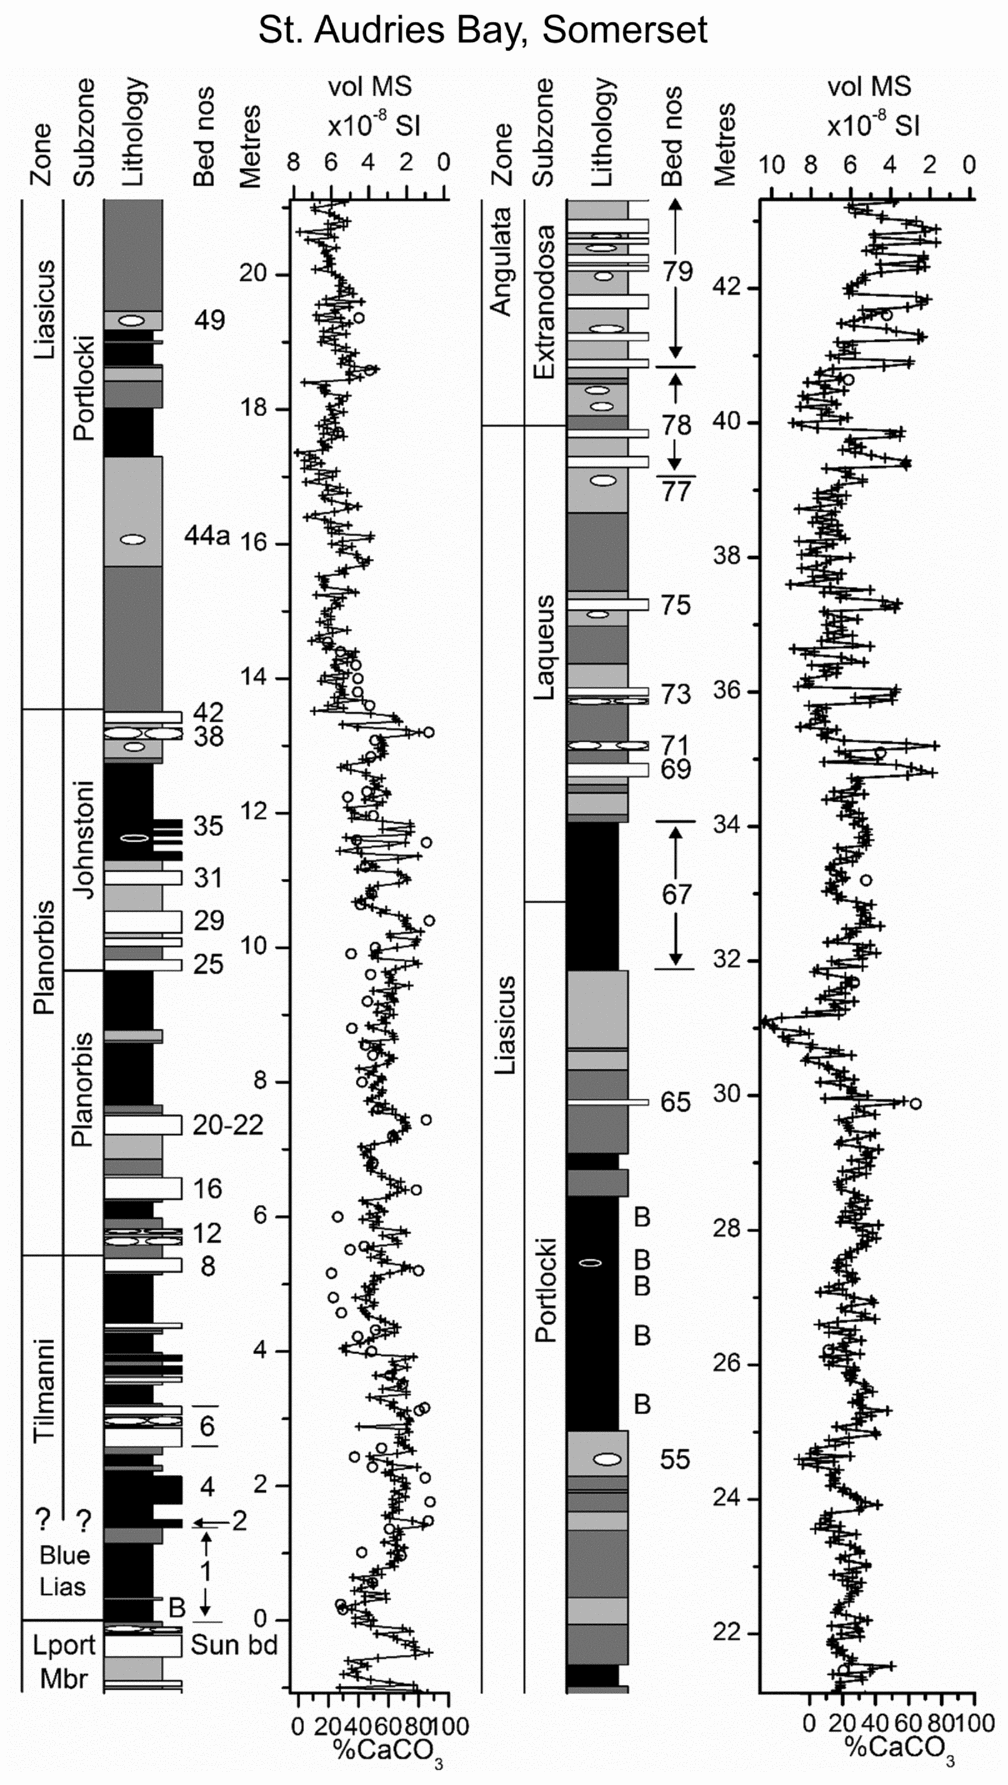
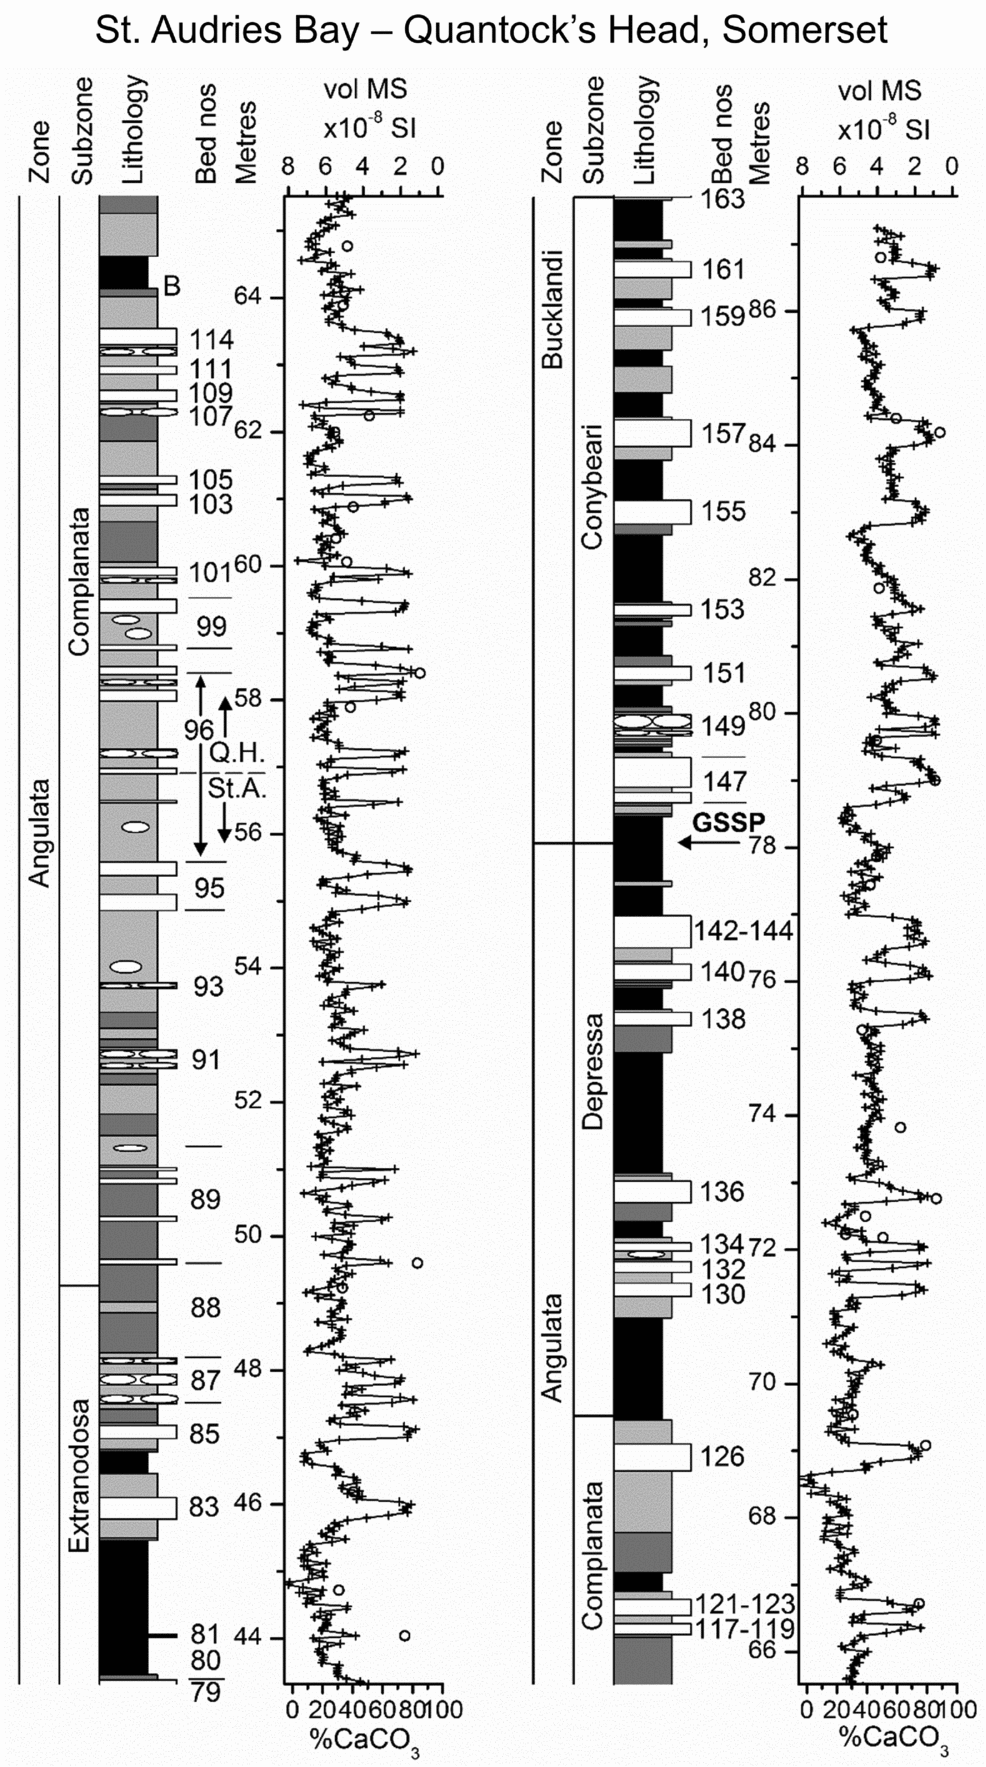
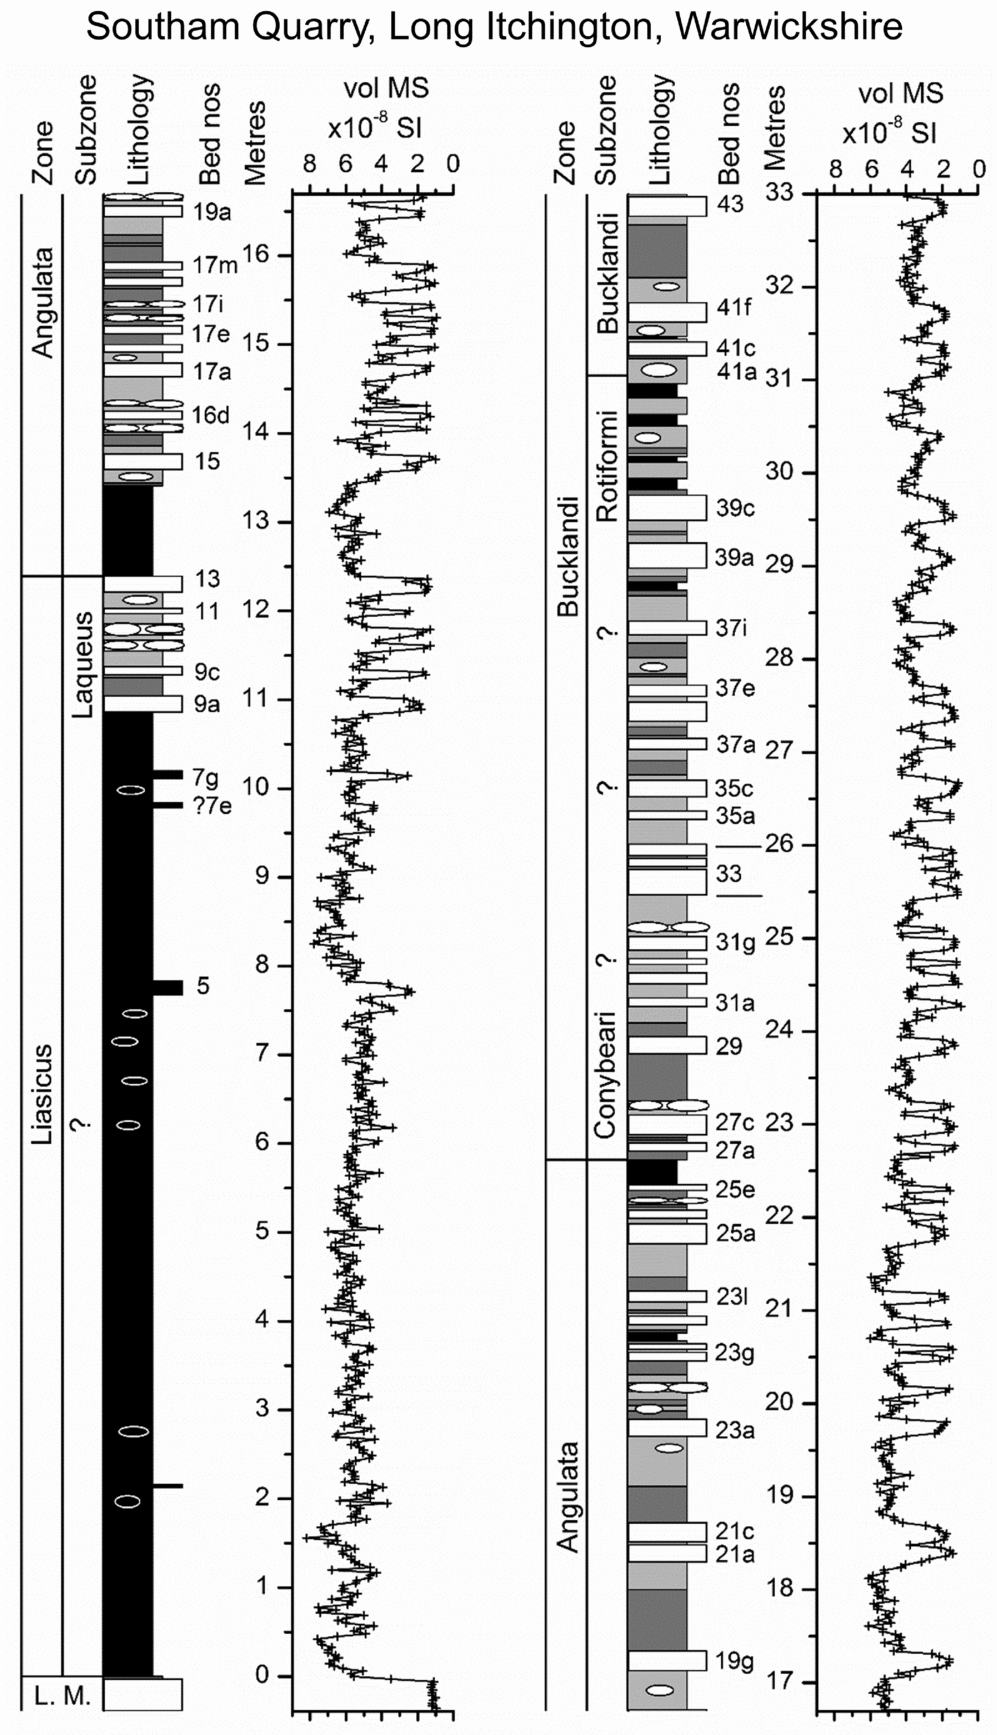
The lithological columns shown in Figures 3–6, with captions indicating the references used in bed numbering, illustrate large variations in the thickness of the marls and shales and highly variable spacing and overall proportions of the limestone beds. In the logs, the laminated black shales are shown as the most recessed lithology on the profiles as a convention to aid their identification rather than as an indication of the lowest resistance to weathering. The fixed spacing of the MS measurements at each section was designed to resolve the smallest variations in bulk composition. The measurements were obtained at 2 cm spacing at Lyme Regis; 3 cm at Southam Quarry, Long Itchington; and 4 cm spacing on both the West Somerset coast and at St Mary's Well Bay, Lavernock. In Southam Quarry, the faces were measured for MS in 1994 when the section in the southwest between the A423 and the A426 was fully accessible down to the disconformity with the Upper Triassic Langport Member. The vol. MS log for Lyme Regis was reported previously (Weedon et al. Reference Weedon, Jenkyns, Coe and Hesselbo1999) but Figure 4, primarily of the Hettangian portion, shows revisions to the zonal and subzonal boundaries.
Lithostratigraphic log, vol. MS measurements and ammonite biostratigraphy at St Mary's Well Bay, Lavernock, Wales. Homogeneous limestone nodules are indicated by black ellipses. Laminated limestone nodules are indicated by white ellipses. At the levels where vol. MS was measured within limestone nodules rather than light marl, the nodules are indicated on the right of the lithostratigraphic log. Bed numbers from Waters & Lawrence (Reference Waters and Lawrence1987).

Lithostratigraphic log, vol. MS and %CaCO3 measurements and ammonite biostratigraphy to the west of Lyme Regis, Devon. The location of the base of the Angulata Zone is discussed in Section 5.a. For key to lithologies see Figure 3. The concentration of samples at the level of bed 37 relates to figure 3.41 of Weedon (Reference Weedon1987a). ○ – sample measured for %CaCO3 plotted with reference to lower horizontal axis; B – level with abundant calcite beef; Lport Mbr – Langport Member; Angul. – Angulata; Buc. – Bucklandi; Extra. – Extranodosa; Ext. – Extranodosa. Bed numbers from Lang (Reference Lang1924). Lang (Reference Lang1924) and Hesselbo & Jenkyns (Reference Hesselbo, Jenkyns and Taylor1995) provide the names of limestone beds on the Devon/Dorset coast.

The log for the West Somerset coast (Fig. 5a, b; Palmer, Reference Palmer1972; Whittaker & Green, Reference Whittaker and Green1983) is composite. The section at St Audries Bay was measured from the base of the Blue Lias Formation to the top of bed 101 of Whittaker & Green (Reference Whittaker and Green1983), overlapping the MS log at Quantock's Head by about 3.5 m. The Quantock's Head to Kilve section was measured for MS from bed 97 to bed 163. The splice level of the composite record in bed 96, at 56.90 m above the base of the Blue Lias Formation, represents the base of the Quantock's Head MS log. Note that in Table 1 the biohorizon levels of the Quantock's Head section are listed both relative to the base of the log (i.e. at the splice level) and relative to the base of the Formation according to the heights of the St Audries Bay section within the composite column.
(a) Lithostratigraphic log, vol. MS and %CaCO3 measurements and ammonite biostratigraphy at St Audries Bay, Somerset. For key to lithologies see Figure 3. Black circles indicate samples measured for %CaCO3 plotted with reference to lower horizontal axis. ○ – sample measured for %CaCO3 plotted with reference to lower horizontal axis; B – level with abundant calcite beef. Bed numbering from Whittaker & Green (1983).

(b) As for (a) but a composite section from St Audries Bay and Quantock's Head. The join (splice) of the St Audries Bay section (St A.) with the Quantocks Head section (Q. H.) is indicated within bed 96 (Section 3.a). GSSP – Global Stratigraphic Section and Point.

3.b. Origin of the variations in vol. MS
It was reported previously for the Blue Lias Formation that MS is inversely correlated with %CaCO3 (Hounslow, Reference Hounslow1985; Weedon et al. Reference Weedon, Jenkyns, Coe and Hesselbo1999; Deconinck et al. Reference Deconinck, Hesselbo, Debuisser, Averbuch, Baudin and Bessa2003; Ruhl et al. Reference Ruhl, Deenen, Abels, Bonis, Krijgsman and Kürschner2010). This relationship is supported by current measurements of wt MS using a Bartington Instruments MS2B cavity sensor and vol. MS (Fig. 2a). The right-hand linear regression line of Figure 2a allows estimation of carbonate contents from the field measurement of vol. MS (using: %CaCO3 = 99.06 – (13.79×vol. MS), r = −0.892, N = 74, P < 0.001). Calcium carbonate measurements have been shown as open circles on top of the MS logs in Figures 4 and 5 by scaling %CaCO3 (bottom scale) relative to the vol. MS (top scale) according to this regression. Despite the good agreement between the estimated and measured %CaCO3 shown on the right of Figure 2b, the uncertainty (95% confidence interval) in individual estimates of %CaCO3 from vol. MS using the regression is about ±20.0%, ranging between ±19.6 and ±20.4%, depending on the difference between the individual vol. MS and the mean vol. MS (Williams, Reference Williams1984, p. 313).
The average MS values for these mudrocks are fairly low, thereby contrasting with younger British Jurassic cyclic mudrocks such as the Kimmeridge Clay Formation (Weedon et al. Reference Weedon, Jenkyns, Coe and Hesselbo1999). It was shown for the Blue Lias Formation (Hounslow, Reference Hounslow1985; Bixler, Elmore & Engel, Reference Bixler, Elmore and Engel1998; Deconinck et al. Reference Deconinck, Hesselbo, Debuisser, Averbuch, Baudin and Bessa2003; Hounslow, Posen & Warrington, Reference Hounslow, Posen and Warrington2004) that the stratigraphic variations in MS are consistent with variable dilution of paramagnetic clays by non-ferroan, and thus diamagnetic, calcite (wt MS = +0.84×10⁻⁸ SI; Bleil & Petersen, Reference Bleil, Petersen and Angenheister1987). Note that despite the presence of locally rather large percentages of pyrite (maximum 12% in the laminated shales; Weedon, Reference Weedon1987a) in a pure, unweathered, state this mineral is also diamagnetic (wt MS = −0.48×10⁻⁸ SI; Collinson, Reference Collinson1983) and consequently contributes very little to the whole-rock MS signal. Hence, stratigraphic logs of MS in the Blue Lias Formation provide an accurate picture of the occurrence of the limestones (Figs 2a, b, 3).
The marls and shales of the Liasicus Zone at all four localities have consistently higher average MS than the underlying Tilmanni and Planorbis and overlying Angulata and Bucklandi zones (Figs 3–6; Weedon et al. Reference Weedon, Jenkyns, Coe and Hesselbo1999; Deconinck et al. Reference Deconinck, Hesselbo, Debuisser, Averbuch, Baudin and Bessa2003). This observation suggests that there were long-term (zonal-scale) variations in the composition of the paramagnetic (mainly clay mineral) components (Deconinck et al. Reference Deconinck, Hesselbo, Debuisser, Averbuch, Baudin and Bessa2003). The relatively high average MS of the lower part of the section in Southam Quarry (Fig. 6) is consistent with the interpretation (Section 2.d) that the lowermost strata that lie disconformably on the Langport Member belong to the Liasicus Zone and not to the Planorbis Zone.
Lithostratigraphic log, vol. MS measurements and ammonite biostratigraphy at Southam Quarry, near Southam and Long Itchington, Warwickshire. For key to lithologies see Figure 3. L. M. – Langport Member. Bed numbers from Clements et al. (Reference Clements1975).

At about the 31 m level in the mid-Liasicus Zone (upper Portlocki Subzone) of the St Audries Bay section (Fig. 5a), the average vol. MS is unusually high with values extending outside the range of the %CaCO3 versus vol. MS regression of Figure 2a. Lower stratigraphic resolution sampling by Deconinck et al. (Reference Deconinck, Hesselbo, Debuisser, Averbuch, Baudin and Bessa2003) indicates that, at this level on the West Somerset coast, the clay minerals switch to higher kaolinite/illite ratios, but surprisingly, not to iron-rich clays. The unusually high MS might indicate an association of increased kaolinite with a source of different paramagnetic components and/or small amounts of ferromagnetic components such as magnetite-like minerals that, unusually for the Blue Lias Formation, survived dissolution by H2S during diagenesis (Deconinck et al. Reference Deconinck, Hesselbo, Debuisser, Averbuch, Baudin and Bessa2003). A similar interval of unusually high values of vol. MS, of around 8.0×10⁻⁸ SI, is found at about 8.2 m in Southam Quarry in the Liasicus Zone (Fig. 6). This interval of high average MS in the marls and shales is located at the top of the Portlocki Subzone, Liasicus Zone at both St Audries and Lyme Regis and may provide a correlatable change in paramagnetic mineralogy (Figs 4, 5a).
4. Variations in whole-rock composition
The typical ‘offshore’ facies of the Hettangian Blue Lias Formation of interest here shows considerable lateral and stratigraphic variations in bulk composition as discussed in Sections 4.b and 4.c. To provide a context for these descriptions we start with consideration of the ‘marginal facies’.
4.a. Marginal facies and ‘near-shore’ Blue Lias
The Blue Lias was deposited at the same times as palaeo-coastline deposits that include the Sutton Stone and Southerndown Beds of South Glamorgan (Trueman, Reference Trueman1920, Reference Trueman1922; Hallam, Reference Hallam1960; Wobber, Reference Wobber1965; Fletcher, Reference Fletcher1988; Sheppard, Reference Sheppard2006) and the Brockley Down Stone of the Radstock Plateau near Bristol (D. L. Loughman, unpub. Ph.D. thesis, Univ. Birmingham, 1982; Donovan & Kellaway, Reference Donovan and Kellaway1984). These so-called marginal facies, formed at and close to palaeo-coastlines, lie unconformably on Carboniferous Limestone and comprise conglomeratic limestones with grainstone textures including Carboniferous Limestone and chert lithoclasts, derived bioclasts, ooids and bioclasts (Wobber, Reference Wobber1965, Reference Wobber1966; Fletcher, Reference Fletcher1988).
On the coast near Southerndown, Glamorgan, 31 km west-northwest of the exposure at Lavernock (Fig. 1a), the unconformity surface is exposed and consists of multiple wave-cut platforms overlain by associated successive breccia and conglomeratic and grainstone limestones of the Sutton Stone (Fletcher, Reference Fletcher1988; Sheppard, Reference Sheppard2006). Both the unconformity surface and Carboniferous Limestone lithoclasts in the overlying Sutton Stone have Trypanites borings and are encrusted by oysters and colonial corals (Johnson & McKerrow, Reference Johnson and McKerrow1995; Simms, Little & Rosen, Reference Simms, Little and Rosen2002; Sheppard, Reference Sheppard2006). Some lithoclasts in the Sutton Stone are imbricated (Wobber, Reference Wobber1963) and elongate bioclasts have been used as palaeocurrent indicators that indicate long-shore drift and complex current movements influenced by the local islands of Carboniferous rocks (Wobber, Reference Wobber1966). The matrix-supported and rounded boulder- and cobble-sized lithoclasts in the Sutton Stone are succeeded stratigraphically by pebble-grade lithoclasts, micrites and thin shales of the Southerndown Beds, which grade laterally into the near-shore facies of Blue Lias (Trueman, Reference Trueman1922; Wobber, Reference Wobber1965; Wilson et al. Reference Wilson, Davies, Fletcher and Smith1990; Sheppard, Reference Sheppard2006).
Although the platform erosion probably started in latest Triassic time, ammonites have been recovered in stratigraphic order from the Sutton Stone and Southerndown Beds from the Planorbis, Liasicus and Angulata zones (Hodges, Reference Hodges1986; Sheppard, Reference Sheppard2006). These observations are not consistent with nearly instantaneous deposition of the Sutton Stone by a single hurricane (Ager, Reference Ager1986), but rather with the latest Triassic and Early Jurassic erosion of the wave-cut platforms and deposition of the marginal facies under storm influence over millions of years during episodic rises in relative sea level (Trueman, Reference Trueman1922; Fletcher, Reference Fletcher1988; Sheppard, Reference Sheppard2006).
Just 6 km south of the palaeo-coastline of Southerndown at Nash Point, the Blue Lias of the Bucklandi Zone represents an atypical limestone-dominated facies often full of bioclast fragments in both the marls and limestones (Hallam, Reference Hallam1960; Weedon, Reference Weedon1987a; Trueman, Reference Trueman1930). These strata representing Units B and C of the Porthkerry Formation have much higher limestone proportions than found in more ‘typical’ Blue Lias (an average of 60 to 85% limestone by thickness in sections tens of metres thick; Waters & Lawrence, Reference Waters and Lawrence1987; Wilson et al. Reference Wilson, Davies, Fletcher and Smith1990; Warrington & Ivimey-Cook, Reference Warrington, Ivimey-Cook and Taylor1995). Units B and C consist of metre-scale bedding units formed of closely spaced nodular limestones and 'anastomosing mudstone beds’ that probably result from pressure dissolution (Waters & Lawrence, Reference Waters and Lawrence1987). Local decimetre-scale mudstone beds are present, permitting correlation of limestone-shale bed groups, but organic-carbon contents are low and neither laminated shales nor laminated limestones are present (Sheppard, Houghton & Swan, Reference Sheppard, Houghton and Swan2006). Although much of the bedding was formed purely during diagenesis, the presence of hummocky cross-stratification at Nash Point proves strong storm influences (Sheppard, Houghton & Swan, Reference Sheppard, Houghton and Swan2006).
Thirty kilometres from the palaeo-coastline of South Glamorgan, typical ‘offshore’ Blue Lias facies is present at Lavernock in the Tilmanni to Liasicus zones as logged here (Fig. 3). In the lower part of the Angulata Zone, Unit A of the Porthkerry Formation consists of about 55% by thickness of normal offshore Blue Lias with nodular limestones and marls. However, in the same area near Cardiff, the upper part of the Angulata Zone, ‘Unit B’ of the Porthkerry Formation of Waters & Lawrence (Reference Waters and Lawrence1987), is of a similar facies to the Bucklandi Zone at Nash Point. The Porthkerry Formation is overlain gradationally by uppermost Angulata Zone and Bucklandi Zone oolitic ‘marginal facies’ (Waters & Lawrence, Reference Waters and Lawrence1987). Thus, Units B and C of the Porthkerry Formation near Cardiff and Nash Point represent a ‘near-shore’ facies of the Blue Lias, which has been envisaged as a storm-derived aragonitic lime mud deposited on a marine shelf (Sheppard, Houghton & Swan, Reference Sheppard, Houghton and Swan2006).
4.b. Rock-type compositions
The different rock-types of the ‘typical’ or ‘offshore’ Blue Lias consist mostly of various proportions of bioclasts, calcite microspar, clay minerals, organic matter, pyrite and minor quartz silt (Hallam, Reference Hallam1960; Weedon, Reference Weedon1986, Reference Weedon1987a). Whole-rock compositions quoted here are based on the samples from both Lyme Regis and the Somerset coast (Weedon, Reference Weedon1987a). Numbers of samples by rock-type and locality are indicated in the caption for Figure 1c and sample locations are indicated in Figures 4 and 5. The limestones (total organic carbon, TOC, mean = 0.54%±0.09 (±95% confidence interval), range = 0.14 to 1.64%, N = 48; CaCO3, mean = 79.3%±2.2, range = 51.8 to 88.7%, N = 48) form beds with contacts ranging from planar to nodular. Limestone nodules are typically entirely enclosed by light marl but can be ‘welded’ onto limestone beds. On the Devon/Dorset and West Somerset coasts, when seen in plan on the foreshore, limestone nodules are often found to be linked laterally at some levels. The limestones generally have a homogeneous bioclastic wackestone to bioclastic carbonate mudstone fabric reflecting the thoroughly bioturbated nature of the precursor light marls. The light marls (TOC mean = 1.42%±0.26, range = 0.38 to 4.41%, N = 40; CaCO3, mean = 43.8%±2.7, range = 25.7 to 69.9%, N = 40) are friable and homogeneous with planar contacts against dark marls and laminated shale beds.
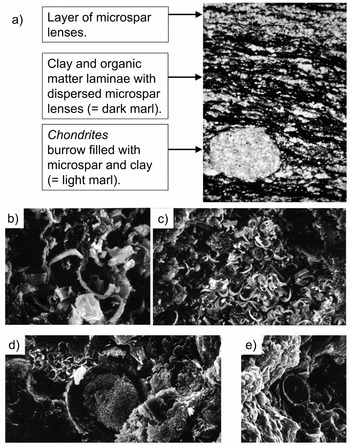
Normally the dark marls (TOC mean = 2.35%±0.41, range = 0.51 to 6.51%, N = 39; CaCO3, mean = 40.1%±3.7, range = 19.9 to 61.0%, N = 39) are homogeneous like the light marls and friable, but can become fissile on weathering. However, Figure 7a shows a laminated dark marl fabric, not visible in the field, consisting of abundant microspar lenses in places forming nearly continuous laminae that alternate with other laminae comprising clay and organic matter (Weedon, Reference Weedon1987a). The figure shows a Chondrites burrow with a homogeneous light marl filling that penetrates the dark marl fabric. Burrow mottles at the contacts of light and dark marl beds are common at Lyme Regis as both light marl burrow-fills within dark marl and vice versa (Hallam, Reference Hallam1964).
(a) Photomicrograph of dark marl thin-section (plane polarized light, width of view 3 mm). Sample BL120 and fig. 2.2M of Weedon (Reference Weedon1987a), bed 32a, Rotiforme Subzone, Bucklandi Zone, Lyme Regis. (b) SEM photograph showing coccoliths in situ partly engulfed by euhedral microspar overgrowth (width of view 14 μm). Dark marl sample BL120 and fig. 2.4G of Weedon (Reference Weedon1987a), bed 32a, Bucklandi Zone, Lyme Regis. (c) Scanning electron microscope (SEM) photograph showing an aggregate of coccoliths surrounded by a matrix of organic matter and clay (width of view 56 μm). Dark marl sample BL120 and fig. 2.4F of Weedon (Reference Weedon1987a), bed 32a, Bucklandi Zone, Lyme Regis. (d) SEM photograph showing an aggregate of coccoliths next to Schizosphaerella punctulata (centre) both surrounded by a matrix of organic matter, clay and calcite microspar (width of view 53 μm). Laminated shale sample BL117, and fig. 2.4H of Weedon (Reference Weedon1987a), topmost laminated shale of bed 32, Bucklandi Zone, Lyme Regis. (e) SEM photograph showing a corroded coccolith in limestone (width of view ~ 8 μm). Limestone sample BL103 and fig. 2.4A of Weedon (Reference Weedon1987a), bed 29, Conybeari Subzone, Bucklandi Zone, Lyme Regis.

The laminated shales (TOC mean = 5.46%±0.77, range = 1.53 to 12.80%, N = 51; CaCO3, mean = 35.5%±3.4, range = 11.6 to 68.4%, N = 51), usually with sharp basal bedding contacts against dark marl or light marl, produce a brown streak when scratched and weather into fissile, sometimes paper thin, laminae. Sub-microscopically they have scattered calcite microspar lenses dispersed within wavy sub-millimetre laminae of clay and organic matter (Weedon, Reference Weedon1987a). Laminated limestone (TOC mean = 1.42%±0.67, range = 0.90 to 3.00%, N = 7; CaCO3, mean = 77.2%±6.2, range = 62.4 to 87.2%, N = 9) forms beds that have planar contacts with laminated shale beds or nodules that are enclosed entirely by laminated shale (Weedon, Reference Weedon1987a; Arzani, Reference Arzani2004).
Hallam (Reference Hallam1987) and Arzani (Reference Arzani2006) doubted the presence of rock-forming quantities of nannofossils as a possible precursor to the microspar. However, calcareous nannofossils, both as true coccoliths as well as Schizosphaerella, are well documented from throughout the Tilmanni to Bucklandi Zone interval at Lyme Regis and on the West Somerset coast (Hamilton, Reference Hamilton and Lord1982; Bown, Reference Bown1987; Bown & Cooper, Reference Bown, Cooper and Bown1998; van de Schootbrugge et al. Reference van de Schootbrugge, Tremolada, Rosenthal, Bailey, Feist-Burkhardt, Brinkhuis, Pross, Kent and Falkowski2007; Clémence et al. Reference Clémence, Bartolini, Gardin, Paris, Beaumont and Page2010). Indeed, Weedon (Reference Weedon1986, Reference Weedon1987a,Reference Weedonb) argued that the microspar lenses in the dark marls and laminated shales represent neomorphosed zooplankton faecal pellets containing calcareous nannofossils. Very similar fabrics to Figure 7a are known in the Kimmeridge Clay Formation of Dorset (Kimmeridgian to Tithonian; fig. 2d, f, g of Pearson, Marshall & Kemp, Reference Pearson, Marshall and Kemp2004), which has abundant nannofossils (e.g. Young & Bown, Reference Young and Bown1991; Lees, Bown & Young, Reference Lees, Bown and Young2006). Aggregates of nannofossils surrounded by clay minerals and organic matter in the Blue Lias Formation (Fig. 7b, c, d; fig. 3 of Weedon, Reference Weedon1986; fig. 6B, C of Arzani, Reference Arzani2006) have similar dimensions to the microspar lenses, supporting their interpretation as neomorphosed zooplankton faecal pellets (Pearson, Marshall & Kemp, Reference Pearson, Marshall and Kemp2004).
Weedon (Reference Weedon1986, Reference Weedon1987a) argued that nannofossil preservation was best in the more organic-carbon-rich laminated shales and dark marls, as confirmed recently by Clémence et al. (Reference Clémence, Bartolini, Gardin, Paris, Beaumont and Page2010). The high organic-carbon contents may have helped the preservation of primary organic coatings on the coccoliths, which in turn prevented calcite dissolution by acidic pore waters during diagenesis (Bukri, Dent Glasser & Smith, Reference Bukri, Dent Glasser and Smith1982). In the less organic-carbon-rich sediments, partial or total microspar aggradation of nannofossils (e.g. Fig. 7b) was inferred to be the normal situation in the Blue Lias (Weedon, Reference Weedon1986, Reference Weedon1987a,Reference Weedonb). The homogeneity of the light marls and most of the dark marls was explained as resulting from burrowers mixing the organic-matter- and clay-rich laminae with faecal pellets. In the limestones and light marls, however, very rare isolated elliptical structures, representing partially corroded or overgrown coccoliths provide the only in situ evidence for calcareous nannofossil precursors to the microspar (Fig. 7e; fig. 2.4B of Weedon, Reference Weedon1987a).
If most carbonate mud in the ‘offshore’ Blue Lias Formation was derived from very shallow coastal waters rather than from nannofossil material, different localities would be expected to have different rock-type compositions. However, the average %CaCO3 and %TOC of the limestone, light marl, dark marl and laminated shales are statistically indistinguishable between the Devon/Dorset coast and the West Somerset coast sections (i.e. overlapping 95% confidence intervals in Fig. 1c). Therefore, considering the large difference in zonal and average bed thicknesses between these locations, the lithological composition of the offshore Blue Lias facies was not influenced by either the local net accumulation rates or by local differences in water depth. The consistency of facies between localities and across the range of accumulation rates represented is consistent with a primarily hemipelagic, rather than shoreline-influenced origin for the carbonate mud (Weedon, Reference Weedon1986).
The majority of the laminated limestone beds were formed by the coalescence of laminated limestone nodules (Weedon, Reference Weedon1987a; Arzani, Reference Arzani2004). However, at Lyme Regis, bed H30 categorized as laminated limestone does not have internal lamination but is homogeneous and without macrofossils. As for laminated limestone beds H32 and H36, it is underlain and overlain by laminated shale, has sharp planar top and bottom contacts, and has exceptionally low, slightly negative MS values. The lowest measured vol. MS of −0.13×10⁻⁸ SI implies, by extrapolating the regression of Figure 2a (Section 3.b), 97.3 %CaCO3 and hence these limestones represent cementation of a primary sediment almost devoid of organic matter and clay. Partly owing to the sharp, planar base, Hesselbo & Jenkyns (Reference Hesselbo, Jenkyns and Taylor1995) inferred a dilute turbidity-current origin for bed H30 (which they named ‘Intruder’). However, in the absence of direct evidence for basal erosion, grading or cross-lamination, alternative explanations for the deposition of almost pure carbonate mud should be considered.
4.c. Lateral and stratigraphic variations in limestone proportions
Unlike the marls and laminated shale beds, average limestone bed thicknesses are consistently close to 10–15 cm at all the logged localities and in every zone of the Hettangian (Fig. 1b). Hallam (Reference Hallam1964, Reference Hallam1986) regarded the consistency in limestone bed thickness of the Blue Lias, independent of locality and zonal thickness, as indicative of a diagenetic rather than a primary control on limestone formation. Although average limestone bed thicknesses remain nearly constant, the proportion of limestone beds by thickness per ammonite zone varies substantially from place to place and stratigraphically (Fig. 1b). Areas with thinner biozones (lower net accumulation rate or ‘condensed sections’) have higher average proportions of limestone (Fig. 1b; fig. 2 of Page, Reference Page1995). For example, all four ammonite zones of the Hettangian of Lyme Regis have a far higher proportion of limestone than those on the West Somerset coast (Fig. 1b).
At Lyme Regis, representing an area of low net accumulation rate, all the zones of the Hettangian are of similar thickness and the average bed thicknesses for all rock-types are also similar in the different zones (Fig. 1b). By contrast, on the West Somerset coast the oldest zones (Tilmanni and Planorbis) are much thinner than the succeeding (Liasicus and Angulata) zones; significantly, the large change in zonal thickness there is mirrored by changes in average bed thickness of the light and dark marls and the laminated shales (Fig. 1b).
The association of changes in average non-limestone bed thickness with changing zonal thickness is interpreted here as indicating a large change in net accumulation rates at the end of the Planorbis Zone times or start of the Liasicus Zone for sections on the West Somerset coast. In this study, only the base of the Liasicus Zone was logged at Lavernock (Fig. 3). However, the much greater thickness of the Liasicus Zone interval at Lavernock compared to the Tilmanni and Planorbis zones (Waters & Lawrence, Reference Waters and Lawrence1987; Warrington & Ivimey-Cook, Reference Warrington, Ivimey-Cook and Taylor1995) indicates a similar change in net accumulation rate to that of the West Somerset coast.
The Liasicus Zone is consistently associated with lower proportions of limestone than preceding and succeeding Hettangian zones in different localities (Fig. 1b; Hallam, Reference Hallam1960; Palmer, Reference Palmer1972). This difference in character has led to member-scale subdivisions of the Blue Lias Formation with locally applied names, i.e. the Lavernock Shales (Richardson, Reference Richardson1905; Waters & Lawrence, Reference Waters and Lawrence1987); the St Audries Shales (Palmer, Reference Palmer1972) and the Saltford Shales (Donovan, Reference Donovan1956; Ambrose, Reference Ambrose2001).
In the lower Liasicus Zone, higher velocities on downhole sonic logs related to relatively higher clay content, and higher gamma-ray counts related both to thorium and potassium in the marls and shales and to uranium within organic matter, allow ready correlation of this portion of the Blue Lias across Britain (Whittaker, Holliday & Penn, Reference Whittaker, Holliday and Penn1985). The base of this mudrock-dominated interval is diachronous because, in the English Midlands, there is biostratigraphical evidence that it occurs within the Planorbis Zone (Old, Sumbler & Ambrose Reference Old, Sumbler and Ambrose1987; Ambrose Reference Ambrose2001), whereas in West Somerset and Lavernock the base is close to the base of the Liasicus Zone (Figs 3, 5).
Mapping of the oldest strata of the Blue Lias Formation on the London-Brabant Platform and the Radstock Plateau near Bristol shows that the Liasicus Zone in the Hettangian and Semicostatum Zone of the Sinemurian were times of accelerated onlap (Donovan, Horton & Ivimey-Cook, Reference Donovan, Horton and Ivimey-Cook1979; Donovan & Kellaway, Reference Donovan and Kellaway1984). An inferred sea-level rise during these zones was suggested by Hallam (Reference Hallam1981) and broadly supported by Hesselbo & Jenkyns (Reference Hesselbo, Jenkyns, Hardenbol, Thierry, Farley, Jacquin, de Graciansky and Vail1998) and Hesselbo (Reference Hesselbo2008).
At Lyme Regis, in the Liasicus Zone, the zonal thickness and the average thicknesses of the various rock-types are similar in the overlying and underlying zones, but there is nevertheless a lower proportion of limestone (Fig. 1b). Therefore, rising sea levels were apparently associated with reduced probability of limestone formation. The near-constancy of net accumulation rate at Lyme Regis, as indicated by the near-uniform average bed thicknesses of the marl and laminated shale, presumably resulted from an underlying tectonic block maintaining a relatively level sea floor within turbulent-water depths (due to storm winnowing) despite sea-level rise (Sellwood & Jenkyns, Reference Sellwood and Jenkyns1975). Apparently, rising sea levels during the Liasicus Zone times at Lyme Regis led to slight increases in water depth and less probability of limestone formation, but the increase in accommodation space was too small to allow substantially increased net sedimentation rates.
On the West Somerset coast and at Lavernock, increased accommodation space and higher sedimentation rates during the Liasicus Zone account for locally greater thicknesses of mudrocks (i.e. greater zonal thicknesses and greater average thickness of marl and laminated shale beds) compared to the Tilmanni and Planorbis zones (Figs 1b, 3, 5a). In these localities, the rapid increase in net accumulation rates apparently resulted from faster, probably fault-related, subsidence that was coincident with the sea-level rise (i.e. the increased subsidence rates exaggerated the effect of sea-level rise on local water depths). Fault-related activity is documented for the Hettangian in the Wessex Basin (Jenkyns & Senior, Reference Jenkyns and Senior1991) and South Glamorgan in South Wales (Wilson et al. Reference Wilson, Davies, Fletcher and Smith1990) and fault movement occurred at some point during the Jurassic Period associated with the Bristol Channel area (Waters & Lawrence, Reference Waters and Lawrence1987; Bixler, Elmore & Engel, Reference Bixler, Elmore and Engel1998). Furthermore, fossil methane seeps dating from the Bucklandi Zone in the Sinemurian might be related to fault movement on the West Somerset coast (Allison, Hesselbo & Brett, Reference Allison, Hesselbo and Brett2008; Price, Vowles-Sheridan & Anderson, Reference Price, Vowles-Sheridan and Anderson2008).
At Southam Quarry near Long Itchington, the majority of the Liasicus Zone strata consist of laminated shale (Figs 1b, 6). This observation might be thought to indicate that greater water depth due to sea-level rise in the Liasicus Zone was associated with the conditions required for the preservation of lamination (especially bottom-water dysoxia and anoxia, cf. Hallam & Bradshaw, Reference Hallam and Bradshaw1979). However, in both West Somerset and Lyme Regis, although there is a reduction in the proportions of limestone in the Liasicus Zone, unlike Long Itchington the proportions of laminated shale are lower than in the succeeding Angulata Zone (Figs 1b, 4, 5a, b; Weedon, Reference Weedon1987a). Hence, it is the formation of a lower proportion of limestones, not the development of laminated shales, which can be consistently related to rising sea level/greater water depth.
5. Intra-formational hiatuses
Weedon (Reference Weedon1986, Reference Weedon1987a,Reference Weedonb) reasoned that differences between localities in the numbers of regular sedimentary cycles, thought to result from Milankovitch orbital forcing of climate, could be explained by the presence of intra-formational hiatuses. Although Hallam (Reference Hallam1960, Reference Hallam1987) disagreed, there are numerous lines of evidence, summarized in the sub-sections below, for both intermittent sea-floor erosion and for missing stratigraphic intervals within the offshore Blue Lias Formation of southern Britain.
5.a. Shaw plot
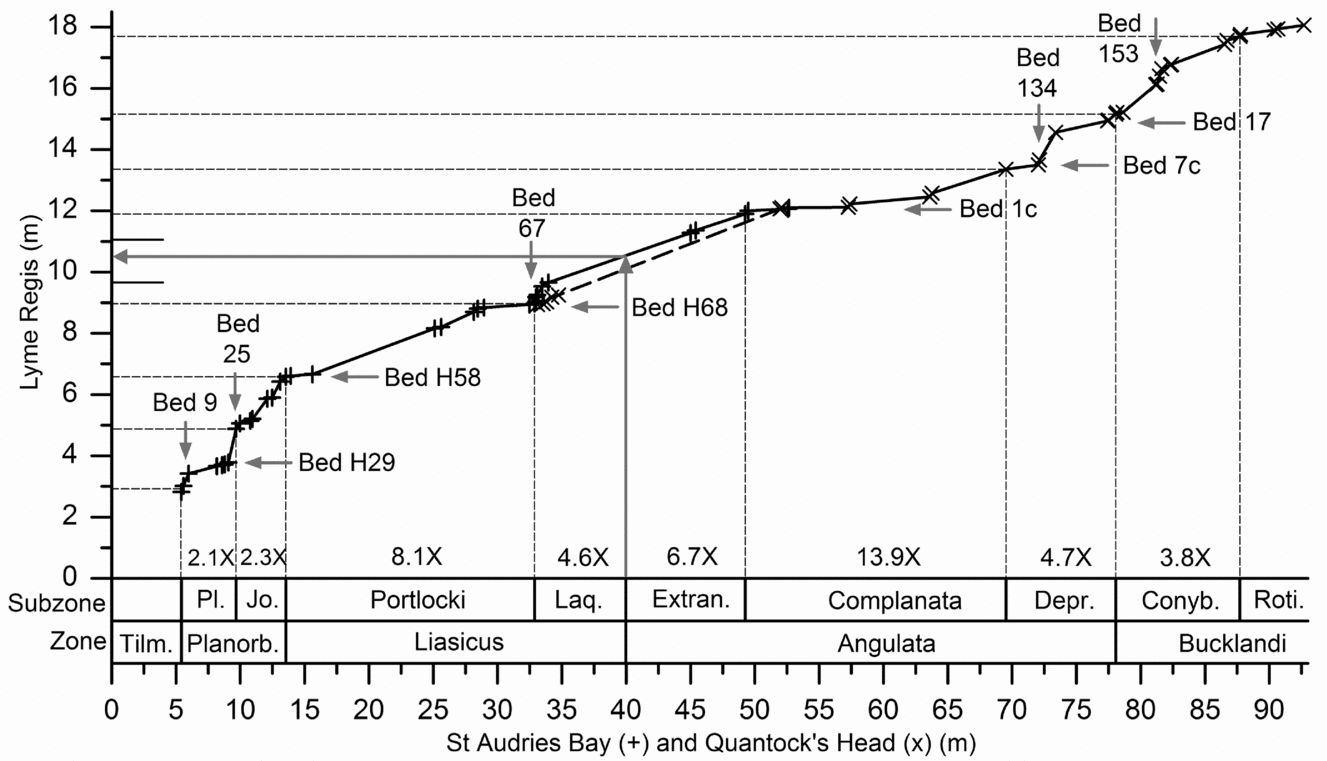
In Table 1 there are 63 levels in the Hettangian and Lower Sinemurian, out of 130 available, where the same biohorizon level (i.e. biohorizon top or biohorizon base) has been located to within a few centimetres both at Lyme Regis and on the West Somerset coast. This stratigraphic refinement allowed construction of the Shaw plot in Figure 8 that illustrates the correlation of these two sites. At Lyme Regis, the base of the Angulata Zone lies somewhere between the lowest level with recorded Schlotheimia at 11.06 m (base of bed H84) and the highest recorded level with Waehneroceras at 9.66 m (within bed H71), as indicated by short horizontal lines in Figure 8. Using the line of correlation between St Audries and Lyme Regis, its location has been inferred to be close to 10.54 m (within bed H77, Fig. 4, Table 1) as indicated using the long grey horizontal arrow in Figure 8. Alternatively, the line of correlation from Quantock's Head rather than St Audries Bay, with fewer biohorizon constraints, would imply that the base of the Angulata Zone lies close to 10.13 m at Lyme Regis (within bed H73).
Shaw plot constructed using the joint locations of biohorizon bases and biohorizon tops at Lyme Regis and the West Somerset coast (St Audries Bay and Quantock's Head sections) as listed in Table 1. The location of the base of the Angulata Zone at Lyme Regis has been estimated using the West Somerset data via the line of correlation data (long grey arrows, Section 5.a). The ratios of the thicknesses of subzones in the West Somerset composite section to subzones in the Lyme Regis section are indicated at the bottom of the plot. Vertical or horizontal arrows with bed numbers indicate the levels at which breaks in slope of the line of correlation imply relative condensation or intra-formational hiatuses. + – St Audries Bay section versus Lyme Regis section; × – Quantock's Head section versus Lyme Regis section. Tilm. – Tilmanni; Planorb. – Planorbis; Pl. – Planorbis; Jo. – Johnsoni; Laq. – Laqueus; Extran. – Extranodosa; Depr. – Depressa; Conyb. – Conybeari; Roti. – Rotiforme.

Subzones on the West Somerset coast sections are thicker than those in the corresponding section at Lyme Regis, as indicated in figures at the bottom of Figure 8. Treating the biohorizon picks as time lines, the amount of strata within each interval results from the combination of the sedimentation rates and the effects of intra-formational hiatuses, i.e. the net accumulation rate. Shallower slopes on the line of correlation indicate higher net accumulation rates on the West Somerset coast relative to the Devon/Dorset coast.
In contrast to the Lyme Regis section, on the West Somerset coast the much thicker Liasicus and Angulata zones compared to the Tilmanni and Planorbis zones are mirrored by the increased average thicknesses of the corresponding marl and shale beds (Fig. 1b; Section 4.c). Hence, the major decrease in the average slope of the line of correlation in Figure 8 at the base of the Liasicus Zone is interpreted as due to substantially increased net accumulation rates in West Somerset. In detail, the breaks in slope (nearly horizontal or nearly vertical segments) of the line of correlation are interpreted as due to hiatuses or intervals of exceptionally low accumulation rate, and have been labelled with the corresponding bed numbers. These breaks in slope of the line of correlation are discussed in Section 5.c. The breaks in slope are defined by multiple points, significantly reducing the likelihood that they simply result from misplacing the tie-levels owing to collection failure for key ammonites.
5.b. Minor erosion
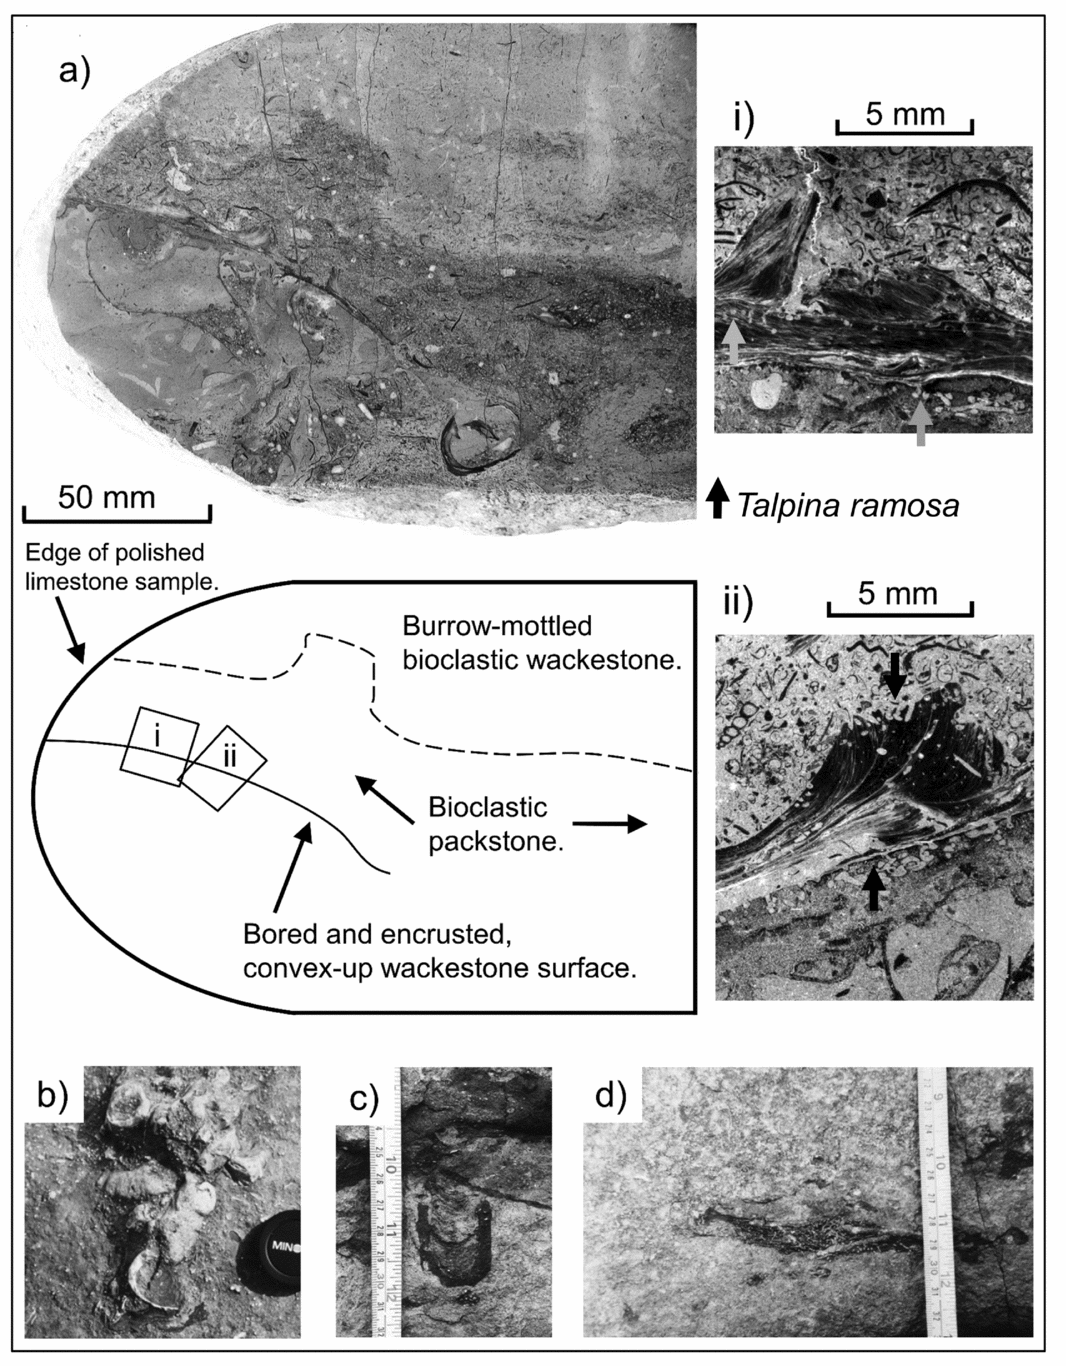
Several lines of field evidence for minor sea-floor erosion were used by Weedon (Reference Weedon1986) to argue for storm-induced bottom-water turbulence. Protrusive Diplocraterion burrow mottles, which are found only within the limestones and light marls, have been described at all four localities studied here as well as at Saltford, Avon (Fig. 9c; Sellwood, Reference Sellwood, Crimes and Harper1970; Donovan & Kellaway, Reference Donovan and Kellaway1984; Weedon, Reference Weedon1987a; Mogadam & Paul, Reference Moghadam and Paul2000; Barras & Twitchett, Reference Barras and Twitchett2007). Tiering analysis at Lyme Regis (Mogadam & Paul, Reference Moghadam and Paul2000) showed that Diplocraterion cross-cuts all other trace fossils except Chondrites, which is well known to have been produced by late-stage deposit feeders within anoxic sediments (Bromley & Ekdale, Reference Bromley and Ekdale1984). The observations of Mogadam & Paul (Reference Moghadam and Paul2000) suggest re-excavation of the vertical U-shaped burrow following rapid centimetre-scale sediment removal (Seilacher, Reference Seilacher2007).
(a) Photograph of polished limestone section showing bored and encrusted limestone intraclast with a hardground-like surface (diagrammatic description below) collected in situ from within bed 25 (Top Copper) below Devonshire Head, Lyme Regis. (ai) Photographic negative image of acetate peel showing Liostrea encrusting the intraclast surface and overlain by bioclastic packstone. Two Liostrea individuals (left and right) encrust a third individual, demonstrating at least two generations of encrustation. Short arrows indicate the Talpina ramosa Von Hagenow borings into the intraclast surface and within the encrusting Liostrea. (aii) As for (ai) but a different section of the intraclast surface (see diagram for location). (b) Limestone intraclasts on the surface of a fallen block of limestone, Monmouth Beach, Lyme Regis. The lens cap is 5 cm in diameter. (c) Protrusive Diplocraterion forming dark marl burrow-fill within limestone bed 19 (Specketty), Seven Rock Point, Lyme Regis. (d) Horizon of isolated dark marl burrow fills indicating the former presence of a bed of dark marl that has been removed locally by sea-floor erosion, bed 19, Seven Rock Point, Lyme Regis.

At Lyme Regis, dark marl beds that are only a few centimetres thick are locally missing for several metres laterally (Weedon, Reference Weedon1986). Within limestone bed 23 (‘Mongrel’), locally a thin dark marl bed is replaced laterally by centimetre-scale, metre-wide scours filled with bioclastic packstone. The former presence of a thin bed of dark marl is in some places recorded by a layer of isolated dark marl burrow mottles within what otherwise appears to be a single limestone bed (e.g. in bed 19; Fig. 9d). In West Somerset, this phenomenon is occasionally observed in thick light marl beds but more typically an opposite arrangement occurs with isolated bands of light burrow-fills within dark marls representing relics of thin light marl beds. Paul, Allison & Brett (Reference Paul, Allison and Brett2008) also noted that occasional ‘exotic’ sediment fills within uncrushed ammonites at Lyme Regis could indicate material subsequently removed by erosion.
Radley (Reference Radley2008) argued that at Southam Quarry, Long Itchington, erosion within laminated shale was linked to distal storm influences below normal storm wave-base. He described siltstone scour fills within Liasicus Zone laminated shales as well as highly elongated limestone nodules containing imbricated ammonites, which were interpreted as gutter casts. The scour fills are associated with a trace fossil indicative of a crustacean escape structure and therefore very rapid deposition (Radley, Reference Radley2008; O'Brien, Braddy & Radley, Reference O'Brien, Braddy and Radley2009). Similar presumed scour fills, full of ammonites and shell fragments, within light marl beds are also known in West Somerset, albeit mainly in the Planorbis Subzone (e.g. bed 24).
A scour fill at Lyme Regis in the top of a limestone bed, probably from the Rotiforme Subzone, Bucklandi Zone, consists of a shallow depression around 50 cm across filled with coarse shelly debris and abundant small articulated echinoids (?Diademopsis) and common articulated ophiuroids (Page collection, Bristol City Museum and Art Gallery). These echinoderms retained their articulation owing to rapid burial, presumably as waning storm-currents deposited previously suspended sediment. A second level with common, but more scattered Diademopsis in laminated mudstone bed 17 (Planorbis Zone and Subzone) near Watchet, West Somerset, may indicate a similar event, although there is no equivalent concentration of shelly debris (K. N. P. pers. obs. 2015).
Found commonly throughout the sections on the Devon/Dorset and West Somerset coast are centimetre-scale horizons with: (a) concentrated bivalve fragments; (b) lenses of echinoid debris; (c) abundant large ammonites on the surface or base of limestone beds; and/or (d) scattered large ammonites and nautiloids with encrusting oysters and/or crinoid debris on the tops of limestone beds. Some of these features have been previously recorded by Paul, Allison & Brett (Reference Paul, Allison and Brett2008) and they indicate either periods of increased sea-floor turbulence that led to winnowing of fines, fragmentation of shells and the concentration of bioclasts or periods of very slow, or halted deposition. In the latter case, epifauna such as oysters and crinoids had time to attach to the ‘benthic islands’ created by large shells. Such observations can coincide with additional evidence for significant intervals of missing strata.
5.c. Major hiatuses
The following sub-sections summarize the Shaw plot and field evidence for significant hiatuses at many levels within the Hettangian and Lower Sinemurian offshore facies of the Blue Lias of southern Britain. Note that in some cases these major hiatuses can be potentially linked to sea-level rises and in others to sea-level falls.
5.c.1. Tilmanni and Planorbis zones, Hettangian
A widespread, diachronous erosion surface across southern Britain at the base of the Blue Lias Formation has been explained in terms of latest Triassic sea-level fall followed by a rise in earliest Jurassic time (Tilmanni Zone; Donovan, Horton & Ivimey-Cook, Reference Donovan, Horton and Ivimey-Cook1979; Hallam, Reference Hallam1981, Reference Hallam1997; Wignall, Reference Wignall2001; Hesselbo, Robinson & Surlyk, Reference Hesselbo, Robinson and Surlyk2004). In the Bristol area at several localities (Filton railway cutting, Chipping Sodbury, Henleaze, Wick and Doynton), Donovan & Kellaway (Reference Donovan and Kellaway1984) recorded Johnstoni Subzone (i.e. upper Planorbis Zone) strata directly on top of the ‘Pre-planorbis Beds’ (i.e. the Tilmanni Zone). Widespread condensation by winnowing of mud-grade sediment during the Tilmanni and Planorbis zones apparently led to numerous centimetre-scale horizons of small bivalve fragments and closely spaced limestone beds at Lyme Regis, West Somerset coast, and Lavernock (Kent, Reference Kent1937; Hallam, Reference Hallam1960; Hesselbo & Jenkyns, Reference Hesselbo, Jenkyns and Taylor1995, Reference Hesselbo, Jenkyns, Hardenbol, Thierry, Farley, Jacquin, de Graciansky and Vail1998). Furthermore, Kent (Reference Kent1937) noted limestone intraclasts encrusted by serpulids as well as borings, indicative of sea-floor erosion and non-deposition, within the Tilmanni and/or Planorbis zones of Nottinghamshire (the precise stratigraphic levels not being reported).
The apparent thinness of the Neophyllites-bearing levels at the base of the Planorbis Subzone (biohorizons Hn3 and Hn4, bed 9 of Whittaker & Green, Reference Whittaker and Green1983), suggests that there is condensation at this level in West Somerset (Page, Reference Page1995; Bloos & Page, Reference Bloos, Page, Hall and Smith2000a). This supposition is confirmed by a corresponding break in slope in Figure 8. A similar break in slope, implying a gap in the West Somerset coast section, occurs at the base of the Johnstoni Subzone (bed 25). A break in slope associated with bed 25 is also found on a Shaw plot of the West Somerset coast versus Lavernock (Table 1 data, not illustrated). Currently, there is no independent biostratigraphical evidence for a gap at this level on the West Somerset coast but, as noted in Section 5.b, presumed scour fills are present in bed 24.
5.c.2. Liasicus Zone, Hettangian
Liasicus Zone strata have not provided much field evidence for stratigraphic gaps. Radley (Reference Radley2008) noted in Southam Quarry, near Long Itchington, the presence of limestone nodules encrusted by serpulids and oysters (Liostrea) with scratches and grooves attributed to crustaceans. This evidence certainly indicates sea-floor exhumation of the nodules and a period of non-deposition (though this might have been short-lived). He inferred an Angulata Zone age, assuming causal factors such as lowered sea level rather than sediment starvation. However, comparison of the stratigraphic level shown (fig. 5 of Radley, Reference Radley2008) for the encrusted nodules with Figure 3, combined with the biostratigraphy of Clements et al. (Reference Clements1975, Reference Clements1977), indicates that this erosion and non-deposition occurred during the Liasicus Zone.
Breaks in slope in Figure 8 indicate possible hiatuses within the Liasicus Zone at Lyme Regis associated with unnamed limestone beds H58 and H68. Consistent with increased bottom-water turbulence, if not direct evidence for non-deposition, is the presence of abundant macroconch Waehneroceras commonly with encrusting Liostrea on the top surface of bed H58, as well as lenses of echinoid debris, especially spines in a few centimetres of the overlying marl. Figure 8 also indicates a stratigraphic gap at the base of bed 67 at the base of the Laqueus Subzone on the West Somerset coast. Two metres below bed 67, the top of bed 65 (Fig. 5a) also yields common macroconch Waehneroceras.
Hence, there was apparently increased bottom-water turbulence at the end of the Portlocki Subzone and beginning of the Laqueus Subzone in both relatively slowly and relatively quickly subsiding areas. Since bed H68 at Lyme Regis and beds 65 to 67 on the West Somerset coast occur at the levels of increased MS (Section 3.b), the mid-Liasicus increase in bottom-water turbulence was apparently associated with a change in sediment composition. Sequence stratigraphic analysis of the marginal facies in Glamorgan (Section 4.a) led Sheppard (Reference Sheppard2006) to infer a major flooding surface in the mid-Liasicus Zone, consistent with the analysis by Hesselbo & Jenkyns (Reference Hesselbo, Jenkyns, Hardenbol, Thierry, Farley, Jacquin, de Graciansky and Vail1998) of coeval marine strata from across Britain.
5.c.3. Angulata Zone, Hettangian
Correlation of a downhole log from the borehole at Burton Row in north Somerset, 20 km northeast of Quantock's Head (Fig. 1a), with the lithological log of Weedon (Reference Weedon1987a) from the Devon coast suggested to Smith (Reference Smith1989) that a gap exists in the Angulata Zone at Lyme Regis. Deconinck et al. (Reference Deconinck, Hesselbo, Debuisser, Averbuch, Baudin and Bessa2003) inferred, using kaolinite/illite ratios from the West Somerset coast, that a stratigraphic gap occurs at Lyme Regis at the top of the Angulata Zone. Hesselbo & Jenkyns (Reference Hesselbo, Jenkyns and Taylor1995, Reference Hesselbo, Jenkyns, Hardenbol, Thierry, Farley, Jacquin, de Graciansky and Vail1998) also argued for condensation and thus reduced accumulation rates in the middle Angulata Zone at Lyme Regis, as indicated by the unusually close spacing of limestone beds and nodule-bearing horizons (e.g. bed 1 or ‘Brick Ledge’).
Figure 8 confirms the presence of stratigraphic gaps in the Angulata Zone at Lyme Regis with at least at one level in the Complanata Subzone (bed 1c within ‘Brick Ledge’) and at two levels within the Depressa Subzone (bed 7c or ‘Lower Skulls’, and bed 17 or ‘Upper White’). The Shaw plot also indicates a gap at bed 134 in the Depressa Subzone on the West Somerset coast (Fig. 8), a level characterized by abundant large macroconch ammonites (Schlotheimia), again suggesting low net accumulation rates.
5.c.4. Bucklandi Zone, Sinemurian
Direct evidence for erosion at Lyme Regis during the Conybeari Subzone, Bucklandi Zone, is provided by a limestone intraclast with the size and shape reminiscent of a small limestone nodule, but found in situ within limestone bed 25 (‘Top Copper’, Fig. 9a; Weedon, Reference Weedon1987a). The intraclast surface has the characteristics of a hardground as it is bored both by bivalves (possible Lithophaga crypts; fig. 2.5e of Weedon, Reference Weedon1987a) and by Talpina ramosa Von Hagenow (150–250 μm diameter, possibly made by phoronids). The intraclast surface is encrusted by at least two generations of Liostrea, which also have Talpina ramosa borings (Fig. 9ai, aii). The intraclast surface is directly overlain by an unusual packstone of small gastropods, benthic foraminifera and larger bivalve fragments and succeeded by normally bioturbated wackestone. Thus, it appears that a period of increased turbulence led to exhumation of a limestone nodule, exposure for sufficient time for repeated colonization and boring (over at least two years based on the two or three generations of bivalves), followed by burial whilst the turbulence was sufficient to lead to generation of the packstone (i.e. grain-supported fabric) before a return to typical carbonate mudstone and wackestone deposition.
There is no biostratigraphic evidence for missing strata at the level of bed 25 at Lyme Regis containing the limestone intraclast (Fig. 9a). However, large ammonites are common in the limestone bed 153 on the West Somerset coast, which correlates biostratigraphically with bed 24 at Lyme Regis (i.e. Biohorizon Sn3b with Metophioceras ex grp rouvillei (Reynès), etc). In Figure 8, the kink in the line of correlation at the level of bed 153 (at about 81.5 m) indicates condensation of the West Somerset section relative to Lyme Regis. Hence, erosion/non-deposition was apparently simultaneous at Lyme Regis and on the West Somerset coast during the middle part of the Conybeari Subzone. The break in slope of the line of correlation was determined more by sediment condensation at the level of bed 153 in West Somerset than by erosion associated with beds 24 and 25 at Lyme Regis.
In bed 29 at Lyme Regis (‘Top Tape’, Fig. 4), also within the Conybeari Subzone, Hallam (pp. 8, 9, Reference Hallam1960) noted the presence of glauconite, both as discrete ‘granules’ and in microfossil infills, this mineral being an indicator of reduced accumulation rate (Odin & Matter, Reference Odin and Matter1981). At beach level on either side of Seven Rock Point, west of Lyme Regis, bed 29 forms a prominent ammonite ‘pavement’ covered with large specimens of Metophioceras ex grp. conybeari (J. Sowerby) (Sn5b conybeari Biohorizon: Page, Reference Page2002, Reference Page, Lord and Davis2010b,Reference Page, Lord and Davisc), and this is matched by its correlative bed 161 in West Somerset, which has the same group of species in abundance on its base. The equivalent level is also recognizable palaeontologically near Pilton in north Somerset (pers. obs. by K.N.P., 1992) and correlates with the Calcaria Bed in the Bristol–Bath area where the widespread evidence for truncation, condensation and phosphatization of fossils has been specifically attributed to shallowing (Donovan & Kellaway, Reference Donovan and Kellaway1984). Figure 2 of Page (Reference Page1995) clearly illustrates, for the Hettangian/Sinemurian boundary interval of the West Somerset coast, Lyme Regis area and Saltford Cutting near Bristol, the way that lateral loss and condensation of biohorizons is associated with an increased proportion of limestone compared to marl and shale.
A widespread late Angulata–early Bucklandi erosive phase is also indicated by the non-sequences and condensation at this level described in eastern France, southern Germany and Austria, contrasting with the relative completeness of the Sinemurian GSSP section on the West Somerset coast (Page et al. Reference Page, Bloos, Bessa, Fitzpatrick, Hart, Hesselbo, Hylyon, Morris, Randall, Hall and Smith2000; Bloos & Page, Reference Bloos and Page2002). An indication for shallowing at this time is also provided in South Wales near Cardiff where typical offshore Blue Lias of Unit A of the Porthkerry Formation in the Angulata Zone is overlain by the near-shore Unit B facies (i.e. limestone dominated and lacking laminated shales and laminated limestones; Section 4.a). Unit B and C facies are, in turn, overlain by uppermost Angulata Zone and Bucklandi Zone oolitic marginal facies suggesting further shallowing (Waters & Lawrence, Reference Waters and Lawrence1987; Wilson et al. Reference Wilson, Davies, Fletcher and Smith1990).
In the Cardiff area, the Porthkerry Formation with Bucklandi and Semicostatum Zone ammonites is found on top of a bored surface on the oolitic marginal facies (Waters & Lawrence, Reference Waters and Lawrence1987). Similarly, near Southerndown Porthkerry Formation Unit D of the same zones (normal offshore Blue Lias with about 60% nodular limestones and marls) occurs on top of marginal facies (Wilson et al. Reference Wilson, Davies, Fletcher and Smith1990). The nature of these successions is consistent with a rise in relative sea level at the end of the Bucklandi Zone.
5.c.5. Early Semicostatum Zone, Sinemurian
As reviewed by Donovan & Kellaway (Reference Donovan and Kellaway1984, e.g. their figs 5, 6), a non-conformity in the Bristol area is overlain by phosphatized sediments and fossils with truncation of the Bucklandi Zone and successive overstepping of all the Hettangian biozones and the Rhaetian onto the Radstock Plateau to the south (i.e. approaching the Carboniferous Limestone massif of the Mendip Hills).
As evidence for coeval erosion and condensation at Lyme Regis, Hallam (Reference Hallam1960) illustrated the truncation of a Diplocraterion burrow, and noted glauconite and phosphate associated with bed 49 (‘Grey Ledge’). This level is now known to be associated with up to four missing biohorizons from the top of the Bucklandi Subzone to the base of the Scipionianum Subzone, within the lower part of the Semicostatum Zone (Page, Reference Page, Ineson and Surlyk2003, Reference Page, Lord and Davis2010b,Reference Page, Lord and Davisc). Additionally, on the Devon/Dorset coast, Gallois & Paul (Reference Gallois and Paul2009) showed that there are lateral variations in the amount of strata removed at this level from the uppermost Blue Lias Formation and that locally there is a bored surface on bed 49 and, throughout the area, deep Diplocraterion burrows are present, commonly at more than one level in beds 47–49. It should be noted, however, that the ammonite faunas recorded through this interval indicate that these levels may be of slightly different ages in different places and hence what are termed beds 47, 48 or 49 in different places may not be exactly the same lithostratigraphical entities. Hallam (Reference Hallam1981) linked the change in facies above bed 49 to both the accelerated onlap on the London Platform described by Donovan, Horton & Ivimey-Cook (Reference Donovan, Horton and Ivimey-Cook1979) and to sea-level rise.
There is no evidence for a break in sedimentation in the late Bucklandi to basal Semicostatum zones on the West Somerset coast where the biohorizon succession appears to be complete. Interestingly, however, there is a concentration of ammonites at the level of bed 247 of Whittaker & Green (Reference Whittaker and Green1983) in the Lyra Subzone (Page, Reference Page1992; biohorizon Sn 15b of Page, Reference Page, Lord and Davis2010b), which may indicate at least one phase of reduced accumulation rates in the early Semicostatum Zone. There are several levels in the 5–6 m of shale-marl/limestone alternations, below which are concentrations of shelly debris, with common large ammonites, and one prominent level of Diplocraterion burrows in bed 242 (K.N.P. pers. obs. 2013–2015). Notably, the ammonite fauna of bed 247 (e.g. Paracoroniceras ex grp charlesi Donovan) is very close in terms of biohorizonal assignment to that recorded from the top c. 6–10 cm of bed 49 at the ‘Slabs’, between Axmouth and Lyme Regis (Page, Reference Page2002), immediately below the non-sequence and with Scipionianum Subzone strata immediately above. The lower part of bed 49, however, still appears to belong the Bucklandi Subzone (and Zone) because large Arietites are common.
6. Preservation of ammonites
It has long been believed that since the macrofossils, especially ammonites and nautiloids, are largely uncrushed, and horizontal sections of burrow mottles are nearly circular in limestone beds of the Blue Lias Formation, cementation must have started prior to significant compaction, and hence was both early and at shallow depth (Kent, Reference Kent1936; Hallam, Reference Hallam1964; Weedon, Reference Weedon1987a; Arzani, Reference Arzani2006; Paul, Allison & Brett, Reference Paul, Allison and Brett2008). Since the uncrushed ammonite and gastropod shells in the limestones would have originally been aragonite, the cementation must also have pre-dated dissolution or inversion to calcite.
At Lyme Regis, ammonites completely enclosed within limestone beds typically have their originally aragonitic shells replaced by sparry calcite and the inner and outer whorls are uncrushed. By contrast, ammonites diagenetically ‘welded’ onto the surfaces of such beds usually present an uncrushed internal mould of the outer whorls with the shell entirely absent. Importantly, their inner, septate whorls are represented predominantly by an external mould on the surface of the limestone bed.
This differential preservation according to the location of the ammonite specimens can be explained by the carbonate cementation generating a framework-supporting fabric that formed first at the centres of (i.e. mid-way through) what became the limestone beds. When and where the cementation and framework support occurred before aragonite dissolution, the full three-dimensional shape of the aragonitic ammonite shell was preserved, allowing for a later sparry calcite replacement and infill. However, on the outer margins of limestone beds, cementation and framework support appears to have been later than aragonite dissolution, albeit before significant compaction. Consequently, although this later cementation could preserve the three-dimensional shape of the shell where already filled with marl (in the body chamber and, in some cases, perforated sections of the phragmocone), it could not preserve the thickness of the shell or support inner whorls that lacked internal sediment. Arzani's (Reference Arzani2006) study of the limestone micro-fabrics also showed that, despite the typically uncrushed nature of the macrofossils, cementation of the edges of the limestones did occur during compaction.
Although a cursory examination of the Devon–Dorset and West Somerset sections may give an impression that ammonites do not occur in every limestone bed, they have been recorded at far more levels than noted by Paul, Allison & Brett (Reference Paul, Allison and Brett2008) at Lyme Regis (Page, Reference Page2002). Ammonites are common only in certain beds but prolonged examination over many years by K.N.P. has led to the recovery of very rare isolated specimens from many levels throughout the Devon–Dorset and West Somerset coastal successions. The simplest explanation for the apparent lack of ammonites within some limestone beds at Lyme Regis is preservation failure caused by cementation following a combination of aragonite dissolution, burrowing and compaction that destroyed all trace of the shells. Which leads to the critical question: why do some limestones record cementation before aragonite dissolution and others do not? This issue is re-visited in Section 8.
Paul, Allison & Brett (Reference Paul, Allison and Brett2008) suggested that the apparent lack of dissolution and encrustation of uncrushed ammonite and nautiloid shells within limestone beds, given the average bed thickness, implies much more rapid sedimentation of these lithologies than the net rate for the formation as a whole. As evidence for rapid sedimentation, they cited the presence of ammonite shells preserved in a near-vertical orientation within limestone beds, as well as cases of ammonite imbrication. However, their observations were primarily based on bed 41 (‘Best Bed’, Bucklandi Zone), which has abundant small ammonites (including Vermiceras scylla (Reynès)) that would have been readily re-oriented by large burrowers. Just two additional beds in the Johnstoni Subzone in the Planorbis Zone have common small ammonites. Otherwise, the limestone beds typically have a large-bodied ammonite fauna.
In addition, although encrustation on ammonites appears to be mainly observed on the surfaces of limestone beds, its reported absence from specimens within limestone beds (Paul, Allison & Brett, Reference Paul, Allison and Brett2008) is not necessarily evidence for rapid sedimentation because biologically relevant factors may have been influential. In fact, the benthic macrofauna of the limestone beds is commonly characterized by low diversity and locally high density, indicative of either a ‘high-stress’ environment or opportunistic colonization during brief periods of ‘improved’ conditions. For example, rhynchonellid brachiopods dominate bed 11 and the tops of beds 19 and 23 at Lyme Regis, beds 147 and 151 on the Somerset coast and bed 21c at Long Itchington, whereas Gryphaea dominates at the tops of bed 13 and beds 14 to 17 and 31 at Lyme Regis and at the tops of beds 136 and 138 on the Somerset coast. It is likely that these controls on benthic colonization were due to intermittent bottom-water dysoxia, which would have also inhibited encrustation of ammonites. There are some exceptions to these general observations, however, as there is evidence that some of the rhynchonellid brachiopods may have inhabited Thalassinoides burrows preferentially. Additionally, occasional winnowing may have concentrated some of the shelly material, for instance in bed 31 at Lyme Regis. At this latter level, Gryphaea apparently show current sorting as they are dominated by the larger, heavier lower valve in random orientations throughout the bed, possibly indicative of rapid deposition after a storm (C. R. C. Paul, pers. comm. 2016).
In the light and dark marls and the black laminated shales, without the early cementation of the limestones, the aragonitic fossils were much less likely to be preserved and hence subject to compaction and early diagenetic dissolution. At Lyme Regis in particular, ammonites are absent from most of the light and dark marls, but in some of the laminated shales very poorly preserved shell-less impressions can sometimes be found. Scattered oyster xenomorphs in the marls, however, prove that ammonites were once present (Paul, Allison & Brett, Reference Paul, Allison and Brett2008). Dissolution of aragonite and bioturbation and hence destruction of any remaining trace of shell can be assumed to have removed most of the ammonites from such levels, especially when no traces of other aragonitic shells, such as bivalves, are observed (Wright, Cherns & Hodges, Reference Wright, Cherns and Hodges2003).
In West Somerset, however, the situation is more complex. White aragonitic shells persist in laminated shales through much of the succession, although they are only well preserved and iridescent at certain levels in the Planorbis and middle Liasicus zones. By analogy with calcareous nannofossil preservation (Section 4.b), the preservation of iridescent aragonite is likely to be connected to the high organic-carbon contents of the laminated shales, as has proven to be the case in other Jurassic shale sequences from the British Isles (e.g. Hall & Kennedy, Reference Hall and Kennedy1967; Hudson & Martill, Reference Hudson, Martill, Tyson and Pearson1991).
Commonly, on the West Somerset coast in the laminated shales and especially in the marls, only an impression of the shell remains, picked out by a residual brown organic film: the remains of the organic content of the shell, in particular the periostracum. This pattern of preservation indicates that the aragonite dissolution post-dated the end of bioturbation in the marls. In the upper Bucklandi and Lyra subzones, levels with white aragonite preservation can pass laterally into areas with brown calcitic shell preservation as major faults are approached. In such cases, the inversion of aragonite to calcite in the marls and shales is clearly associated with the circulation of fluids along such faults, for instance during the tectonic inversion of the basin, as described by Bixler, Elmore & Engel (Reference Bixler, Elmore and Engel1998). At some levels, both brown calcitic and white aragonitic shells may also contain pyrite, commonly associated with specific layers in the shell.
In the Burton Row borehole in north Somerset, pristine iridescent aragonite is characteristic of the laminated shales of most of the Hettangian and Sinemurian succession. On the coast, inversion to brown calcite (e.g. in parts of the Liasicus and Semicostatum zones) was due to the effects of fluids and/or raised temperatures generated during tectonic inversion (Waters & Lawrence, Reference Waters and Lawrence1987; Bixler, Elmore & Engel, Reference Bixler, Elmore and Engel1998), whereas conversion of iridescent aragonite in the laminated shales to white and powdery aragonite was probably due to near-surface weathering and/or the effects of ground-water penetration.
7. Oxygen and carbon isotopes and timing of limestone formation
7.a. Lyme Regis
Figures 2b and 10a show that, at Lyme Regis, oxygen isotopes in the centres of the limestone beds are as high as −1.5‰ VPDB (Vienna Pee-Dee Belemnite) with carbon-isotope values close to 0.0‰ VPDB. These values are not much lighter than the isotopes of unaltered benthic bivalve (Gryphaea) calcite (Weedon, Reference Weedon1987a). Hence, carbon and oxygen isotopes of the Blue Lias, combined with the near-absence of evidence for compaction of macrofossils, have long been considered consistent with early cementation (Campos & Hallam, Reference Campos and Hallam1979; Gluyas, Reference Gluyas1984; Weedon, Reference Weedon1987a; Arzani, Reference Arzani2006; Paul, Allison & Brett, Reference Paul, Allison and Brett2008). The decreases of oxygen-isotope values towards the edges of limestone beds, where calcium carbonate contents are lower, are consistent with cementation occurring progressively during the early stages of compaction (Gluyas, Reference Gluyas1984; Weedon, Reference Weedon1987a; Arzani, Reference Arzani2006; Paul, Allison & Brett, Reference Paul, Allison and Brett2008). Disseminated framboidal and euhedral pyrite found throughout the limestones and the non-ferroan nature of the calcite microspar indicate at least some carbonate generation during sulphate reduction (Gluyas, Reference Gluyas1984).
(a) Compilation of oxygen- and carbon-isotope measurements for Lyme Regis from the Angulata and Bucklandi zones. Note several data points from limestone beds (black squares) near δ18O = −4.5 and δ13C = −1.5‰ VPDB are obscured by the data for marl or laminated shale (unfilled triangles). Sources of measurements for whole-rock: Campos & Hallam (Reference Campos and Hallam1979), Gluyas (Reference Gluyas1984), Weedon (Reference Weedon1987a), Arzani (Reference Arzani2004, Reference Arzani2006), Paul, Allison & Brett (Reference Paul, Allison and Brett2008); for Gryphaea sp.: Weedon (Reference Weedon1987a). (b) Compilation of oxygen- and carbon-isotope measurements for West Somerset coast (Kilve) for the Bucklandi Zone. Sources of measurements for whole rock: Allison, Hesselbo & Brett (Reference Allison, Hesselbo and Brett2008), Price, Vowles-Sheridan & Anderson (Reference Price, Vowles-Sheridan and Anderson2008). Measurements plotted exclude atypical rock-types associated with the Bucklandi Zone mud mounds. (c) Compilation of oxygen- and carbon-isotope measurements for West Somerset coast (St Audries and Doniford) for the Tilmanni and Planorbis zones. Sources of measurements for whole rock: Arzani (Reference Arzani2004, Reference Arzani2006), Clémence et al. (Reference Clémence, Bartolini, Gardin, Paris, Beaumont and Page2010 as listed in supplementary information of Paris et al. Reference Paris, Beaumont, Bartolini, Clémence and Gardin2010); for Liostrea sp.: van Schootbrugge et al. (Reference van de Schootbrugge, Tremolada, Rosenthal, Bailey, Feist-Burkhardt, Brinkhuis, Pross, Kent and Falkowski2007, their ‘unaltered’ samples only).

Raiswell (Reference Raiswell1988) postulated that cementation of the Blue Lias limestone beds and nodules was associated with anaerobic methane oxidation by sulphate within the sulphate reduction zone. Both normal sulphate reduction and anaerobic methane oxidation generate carbonate that neutralizes the acidity produced during the precipitation of iron monosulphide and pyrite oxidation (Raiswell, Reference Raiswell1988; Bottrell & Raiswell, Reference Bottrell and Raiswell1989). Since there is a restricted depth interval involved, anaerobic methane oxidation was used by Raiswell (Reference Raiswell1988) to explain Hallam's (Reference Hallam1964) observations of the limited range of limestone bed thickness. In particular, Raiswell's model requires that shallow cementation (< 1 m burial) occurred during a pause in sedimentation.
Bottrell & Raiswell (Reference Bottrell and Raiswell1989) further demonstrated that pyrite formation occurred over a longer period in the limestones than in the light marl and dark marls. To explain the sulphur-isotope composition of the pyrite in the limestones they invoked incorporation of sulphur derived from the bioturbational oxidation of previously formed pyrite. Such a process implies limestone cementation close to the zone of burrowing and hence not greatly below the sediment–water interface. δ13C of carbonate from sulphate reduction or aerobic methane oxidation is typically less than −10.0‰ VPDB. Bottrell & Raiswell (Reference Bottrell and Raiswell1989) explained the relatively heavy carbon-isotope values of around 0.0‰ VPDB in the limestones as indicating that the bulk of the carbonate was derived from dissolution of aragonite and high-Mg bioclasts. Later authors concurred with this suggested source of carbonate (Wright, Cherns & Hodges, Reference Wright, Cherns and Hodges2003; Arzani, Reference Arzani2004, Reference Arzani2006; Paul, Allison & Brett, Reference Paul, Allison and Brett2008). Some limestone beds at Lyme Regis contain centimetre-scale cracks partly filled with bioclastic sediment, indicating that cementation and fissuring occurred close enough to the sediment–water interface to allow access to unconsolidated material, presumably following a phase of sea-floor erosion (Hesselbo & Jenkyns, Reference Hesselbo, Jenkyns and Taylor1995).
Plots of isotope ratios in the Blue Lias Formation show measurements lying near a trend-line that slopes from near the origin down towards more negative oxygen- and carbon-isotope ratios. Trends in isotope composition from heavier oxygen isotopes at the centres of nodules to lighter oxygen isotopes at the edges (Fig. 10; Weedon, Reference Weedon1987a; Arzani, Reference Arzani2006) apparently confirm the supposition that oxygen isotopes became lighter through time, most likely due to increasing pore-water temperatures. However, the carbon isotopes in limestone nodules can increase rather than decrease towards the outside of nodules and consequently do not lie along the main trend of measurements at Lyme Regis (Fig. 10a) and West Somerset (Fig. 10c).
Assuming that oxygen-isotope values only decreased during the diagenesis of the Blue Lias Formation, an explanation is needed for why the limestone beds can have average carbonate with δ18O = −4.5 and δ13C = −1.5‰ VPDB while limestone nodules can have average carbonate with the same δ18O, but δ13C = −3.0‰ VPDB (Fig. 10a). The key to this problem is to regard the main trend in the isotopes in the limestone beds as indicating a mixing line between the composition of early and late carbonate rather than as a time series.
It is now recognized that early meniscus calcite cement associated with carbonate nodule formation could have provided a supporting framework that allowed the bulk of cementation to occur much later during compaction (Curtis et al. Reference Curtis, Cope, Plant and Macquaker2000; Raiswell & Fisher, Reference Raiswell and Fisher2000). This model helps explain why it is so rare to find shallow limestone nodules forming in modern organic-rich marine sediments (Raiswell & Fisher, Reference Raiswell and Fisher2000). In the Blue Lias Formation, the very early cement in the limestones with oxygen and carbon isotopes relatively close to 0.0‰ VPDB was apparently sufficient to prevent the compaction of large macrofossils. At a later phase of diagenesis, once compaction had started in earnest, the remaining pore spaces within the limestone beds could then be partly filled with carbonate that had much lighter oxygen and, typically also lighter carbon isotopes. This model means that, if cemented relatively quickly, limestone nodules can show progressive changes in isotopes that, unlike the limestone beds, record a snapshot of the history of changing pore-water isotopic composition in concentric zones (including pore-water carbon isotopes becoming heavier while oxygen isotopes became lighter). Although Arzani (Reference Arzani2006) demonstrated that microspar growth was displacive, the cementation cannot have continued much beyond the end of occlusion of the pore spaces because the limestone beds and nodules have oxygen isotopes not lighter than about −6.0‰.
At Lyme Regis, the oxygen isotopes of the calcite microspar in the light and dark marls and the black laminated shale (−3.5 to −6.0‰ VPDB) are much lighter on average than the limestone beds (Fig. 10a). Hence, the marls and shales appear to have been cemented later than the limestone beds. However, one sample of light marl from mid-way through bed 15c (BL307, table 3B of Weedon, Reference Weedon1987a; Figs 2b, 10a) with %CaCO3 = 38.2 and %TOC = 0.61 has an oxygen-isotope value that is far heavier (δ18O = −1.99‰ VPDB) than the other marl and shale samples. This sample is interpreted to represent light marl that was cemented by early meniscus cement, as though destined to become the centre of a limestone bed or nodule, but the amount of cement was apparently insufficient to provide enough framework support to prevent compaction during burial.
Ferroan and non-ferroan calcite beef occurring near the bases of some laminated shales at Lyme Regis with δ18O less than −6‰ (Campos & Hallam, Reference Campos and Hallam1979), not shown in Figure 10a, probably formed as a result of over-pressuring during deep burial (Marshall, Reference Marshall1982).
7.b. West Somerset coast
Unaltered carbonate of Liostrea from the Tilmanni Zone of the West Somerset coast have generally much heavier carbon isotopes (+1.6 to +3.9‰, Fig. 10c; van de Schootbrugge et al. Reference van de Schootbrugge, Tremolada, Rosenthal, Bailey, Feist-Burkhardt, Brinkhuis, Pross, Kent and Falkowski2007) than those found in Gryphaea from the Angulata and Bucklandi zones at Lyme Regis (+0.5 to +2.5‰ VPDB, Figs 2b, 10b; Weedon, Reference Weedon1987a). Korte et al. (Reference Korte, Hesselbo, Jenkyns, Rickaby and Spotl2009) measured δ13C of between +1.5 and +5.0‰ VPDB for Liostrea in the Tilmanni Zone of Lavernock (not shown) with progressively lighter average values in the upper part of the Tilmanni, Planorbis and lower Liasicus zones. The different ranges of values in the Tilmanni and the Angulata–Bucklandi zones have been related to secular trends in carbon isotopes within the Hettangian rather than diagenetic factors (Korte et al. Reference Korte, Hesselbo, Jenkyns, Rickaby and Spotl2009). However, all three groups of measurements of unaltered benthic bivalve calcite indicate δ18O between about 0.0 and −2.0‰ VPDB.
The limestones on the West Somerset coast with δ18O = −4.0 to −12.5‰ VPDB have far lighter oxygen isotopes than those at Lyme Regis (compare Fig. 10a with Figs 10b and 10c). The isotopically lightest values from a limestone bed (Fig. 10b) are derived from beds associated with mud volcanoes developed in the Bucklandi Zone strata near Kilve (Cornford, Reference Cornford2003; Allison, Hesselbo & Brett, Reference Allison, Hesselbo and Brett2008; Price, Vowles-Sheridan & Anderson, Reference Price, Vowles-Sheridan and Anderson2008). Isotope values from material described as comprising the mud volcano mounds themselves (i.e. breccia, ‘tufa’, crust, etc) have been excluded from Figure 10b.
Oxygen isotopes from limestone beds from the Tilmanni and Planorbis zones on the West Somerset coast are not only lighter than the limestone beds at Lyme Regis, but also generally lighter, rather than heavier, than their associated marls and black laminated shales (Fig. 10c; Arzani, Reference Arzani2004). The much lighter oxygen isotopes suggest that the limestones were cemented later than the marls and shales. Nevertheless, large macrofossils within the limestone beds of the West Somerset coast are preserved uncrushed in the same manner as observed at Lyme Regis. Accordingly, cementation started prior to compaction. These apparently conflicting interpretations can be reconciled if it is hypothesized that the West Somerset coast limestone beds had an early framework cement with oxygen isotopes close to 0.0‰ VPDB that was joined by carbonate formed much later that had much lighter oxygen-isotope values. Thus, the marls and laminated shales became fully compacted and fully cemented at a time when there remained framework-supported pores within the limestone beds still available for later cementation by calcite with very light oxygen-isotope values.
Campos & Hallam (Reference Campos and Hallam1979) explained their observations of much heavier average oxygen isotopes in the limestones of the Lower Jurassic of Devon/Dorset compared to the Lower Jurassic of the Yorkshire coast in terms of net sedimentation rate. Their explanation is followed here with respect to the comparison of the West Somerset with the Devon/Dorset coast, assuming that the total time for cementation was approximately the same in both cases. In both areas, cementation appears to have started very early, but the limestones at Lyme Regis were buried more slowly and so their final carbonate was probably precipitated at relatively low temperatures (overall oxygen isotopes heavier than the marls and shales). The more rapidly buried limestone beds on the West Somerset coast apparently ceased full cementation at much greater depths and thus were formed from pore waters with higher temperatures (overall oxygen isotopes lighter than the marls and shales).
A prolonged cementation history on the West Somerset coast is indicated by very negative δ18O in vein calcite (−9 to −12‰ VPDB, not shown in Fig. 10), probably associated with Late Jurassic to Early Cretaceous extensional and Cenozoic compressional faulting (Bixler, Elmore & Engel, Reference Bixler, Elmore and Engel1998).
8. Synthesis
In the offshore facies, at the scale of ammonite zones, lateral and stratigraphic variations in the characteristics of the Blue Lias Formation are not due to variations in the composition of specific rock-types. Neither the water depth nor the net accumulation rate influenced the average composition of the rock-type (Fig. 1c), a conclusion that follows from the hemipelagic origin of the sediment (Section 4.b). The key variables determining the characteristics of the Formation are: (a) the average thicknesses of beds of light marl, dark marl and black laminated shale; and (b) the proportion of limestone.
Variations in the average thickness of the marls and shales are associated with variations in zonal thickness and were determined by the net accumulation rate (Section 4.c). The uniformly and relatively thin zones of the Hettangian at Lyme Regis are associated with thin beds of marls and shales. On the West Somerset coast, the younger stratigraphically thicker zones are associated with thicker beds of marls and shales whose deposition post-dated a major increase in accumulation rate at the start of the Liasicus Zone (Figs 1b, 8; Section 4.c).
On the scale of ammonite zones, the proportion of limestones was linked to the net accumulation rate as determined by rates of subsidence and sea-level variations. The abundant evidence for intra-formational hiatuses and evidence for storm-related scours and winnowing episodes (Section 5) are consistent with the overall deposition of fines limited by the storm wave-base. Raiswell's (Reference Raiswell1988) model for the formation of limestone nodules and beds within a restricted interval of anaerobic methane oxidation by sulphate during pauses in sedimentation accords with the field and geochemical evidence for cementation close to the sediment–water interface (Sections 6 and 7). However, although initiation of limestone formation started early, final cementation appears to have occurred well below the sediment–water interface (Section 7). Such a history explains the overall rarity of limestone intraclasts despite the prevalence of sea-floor erosion and re-deposition of sediments in storm events.
The restriction of protrusive Diplocraterion traces to light marls and limestone beds supports the idea that deposition of light marl, rather than dark marl or black laminated shale, was often associated with significant bottom-water turbulence. At Lyme Regis, increased proportions of angular- compared to rounded-wood particles, interpreted as indicating relatively high bottom-water turbulence, occur near the tops of many limestone beds and light marls (Waterhouse, Reference Waterhouse1999a). This observation has apparently not been tested for the West Somerset coast (e.g. Bonis, Ruhl & Kürschner, Reference Bonis, Ruhl and Kürschner2010) probably because woody material is much rarer.
The explanation of orbital-climatic (Milankovitch) control of the alternations of homogenized organic-carbon poor sediments with laminated organic-carbon-rich sediments in the offshore facies of the Blue Lias and correlatives remains popular (House, Reference House1985, Reference Hallam1986; Weedon, Reference Weedon1986, Reference Weedon1987a,Reference Weedonb; Waterhouse Reference Waterhouse1999a,b; Weedon et al. Reference Weedon, Jenkyns, Coe and Hesselbo1999; Hanzo et al. Reference Hanzo, Lathuilière, Alméras, Dagallier, Guérin-Franiatte, Guillocheau, Huault, Nori and Rauscher2000; Bonis, Ruhl & Kürschner, Reference Bonis, Ruhl and Kürschner2010; Ruhl et al. Reference Ruhl, Deenen, Abels, Bonis, Krijgsman and Kürschner2010). Intervals of increased fluvial drainage during wetter climates are likely to have led to salinity stratification, enhanced stability of the water column and increased fluxes of clay minerals from land. These factors were probably significant in promoting both higher productivity and preservation of marine organic matter in the darker laminated and more clay-rich sediments (Weedon, Reference Weedon1986; Fleet et al. Reference Fleet, Clayton, Jenkyns, Parkinson, Brooks and Glennie1987).
The precursors to the limestone beds, the light marls, were probably not only associated with a relatively dry climate compared to the dark marl and black laminated shale deposition (Weedon, Reference Weedon1986), but also stormier conditions (Waterhouse, Reference Waterhouse1999b). The increased storminess causing erosion and/or winnowing during the deposition of light marl would have frequently led to pauses in sedimentation (non-deposition and/or hiatuses) so that limestone beds could be formed. However, increases in water depth and accommodation space, such as during the Liasicus Zone, would have reduced the probability that storms would promote the formation of limestones during deposition of light marl.
The palaeo-latitude of southern Britain was about 35°N in Early Jurassic time (Smith, Smith & Funnell, Reference Smith, Smith and Funnell1994). The ‘stormier’ climate associated with deposition of light marl is envisaged as resulting from rare intense tropical cyclones, rather from than frequent mid-latitude depressions. Increased storm influence during deposition of light marl (more frequent turbulent bottom water) is consistent with a drier climate overall (less rainfall and lower flux of clay). Such storm events led to episodic increases in bottom-water turbulence well below the normal storm wave-base. Individual storm events could have led to sea-floor erosion, but multiple storms would have been necessary for the prolonged phases of non-deposition required for the initiation of limestone formation by carbonate cementation of light marls near the sediment–water interface.
In the Blue Lias Formation as a whole, beds of dark grey to black laminated limestone and layers of laminated limestone nodules are much rarer than the homogeneous limestones. This distribution of lithologies was apparently because, at the associated water depths and in the wetter climatic regime associated with the laminated shales (with high clay fluxes), storms were usually too rare and/or too weak to cause pauses in sedimentation. In the field, laminated limestone nodules at Lavernock and Southam Quarry show thicker laminae in the centres of nodules that pinch laterally into much thinner laminae within the enclosing laminated shales (Weedon, Reference Weedon1987a). Hence, laminated limestones apparently formed prior to significant compaction just like the homogeneous grey limestone beds (Weedon, Reference Weedon1986, Reference Weedon1987a; Arzani, Reference Arzani2004). However, exceptionally ‘clean’ laminated limestone beds such as bed H30 (Intruder) at Lyme Regis may represent deposition from low-density turbidity currents (Hesselbo & Jenkyns, Reference Hesselbo, Jenkyns and Taylor1995).
The observations of gutter casts and crustacean escape structures in Southam Quarry at Long Itchington prove that storms manifestly caused sea-floor erosion and re-deposition during times of laminated shale deposition (Radley, Reference Radley2008; O'Brien, Braddy & Radley, Reference O'Brien, Braddy and Radley2009). In general, laminated limestones are most abundant within the Tilmanni and Planorbis zones. Hence, during the early Hettangian, water depths were apparently shallow enough for even rare/weak storms to cause the pauses in sedimentation required to generate laminated limestone beds and laminated limestone nodule layers.
According to the Raiswell (Reference Raiswell1988) model of anaerobic methane oxidation by sulphate, limestone formation started a metre so below the sediment–water interface. The range of preservation of ammonites (Section 6) indicates that for different limestone beds the cementation formed a framework-supporting fabric: (a) before aragonite dissolution and before compaction (ammonites fully preserved); (b) after aragonite dissolution, but before significant compaction (only external moulds of sediment-free inner whorls preserved, especially on the edges of limestone beds); and (c) after aragonite dissolution and after compaction started (no ammonite shells preserved, although calcitic oyster xenomorphs may be present).
Paul, Allison & Brett (Reference Paul, Allison and Brett2008) argued that the ammonites within the limestones at Lyme Regis were preserved owing to rapid deposition, which seems plausible, given the evidence for storm-related deposition (Section 5; Weedon, Reference Weedon1986, Reference Weedon1987a; Waterhouse, Reference Waterhouse1999b; Radley, Reference Radley2008). However, not mentioned by Paul, Allison & Brett (Reference Paul, Allison and Brett2008) was that additionally an interval of non-deposition after the rapid burial by light marl seems also to have been necessary to initiate limestone formation. Given the homogenization of the light marl by burrowers prior to limestone formation, the non-deposition and cementation apparently did not immediately follow rapid sedimentation. However, unless non-deposition occurred before aragonite dissolution (i.e. within a few thousand years), cementation would not have been early enough to preserve the ammonites.
The Blue Lias Formation is well known for fully articulated ichthyosaur and plesiosaur fossils (e.g. Milner & Walsh, Reference Milner, Walsh, Lord and Davis2010). Skeletons enclosed by laminated shale were probably protected from scavengers by bottom-water anoxia. However, given that many fully articulated skeletons that somehow avoided disarticulation by scavengers are found also in the marls and homogeneous limestones, rapid burial of carcasses during storms could also explain their preservation.
Normally, the aragonite of ammonites buried within accumulating light marl would have dissolved and left no trace unless pyritized (very rare in the Blue Lias Formation) or preserved as external moulds in oyster xenomorphs. Limestone beds that do not preserve ammonites were apparently formed during phases of non-deposition that did not quickly follow an episode of rapid light marl deposition.
9. Conclusions
In the offshore hemipelagic facies of the Blue Lias Formation, the spacing of individual limestones within zones and the varying limestone proportions of limestones from zone to zone and from site to site, can all be related to the bottom-water turbulence. The model adopted represents a synthesis of several key papers accompanied by the new biostratigraphic and sedimentological data presented here.
There is abundant evidence for winnowing, non-deposition and sea-floor erosion within the formation, as indicated by the Shaw plot (Fig. 8) and the field evidence (Section 5). Initiation of limestone formation is explained by periods of non-deposition causing cementation of the zone of anaerobic methane oxidation by sulphate close to the sediment–water interface (Raiswell, Reference Raiswell1988; Bottrell & Raiswell, Reference Bottrell and Raiswell1989). This mechanism explains the decoupling of limestone bed thickness from lateral and stratigraphic variations in net accumulation rate (Hallam, Reference Hallam1964; Raiswell, Reference Raiswell1988). The periods of increased sea-floor erosion or non-deposition that initiated the formation of individual limestone beds and horizons of limestone nodules can be attributed to storms (Weedon, Reference Weedon1986, Reference Weedon1987a; Waterhouse, Reference Waterhouse1999b; Radley, Reference Radley2008).
Deposition of light marl was associated with a drier climate characterized by much stronger and/or more frequent, though possibly still rare, major storms whereas more tranquil conditions were typical for the deposition of dark marl and laminated shale (Waterhouse, Reference Waterhouse1999b). Thus, limestone beds and nodule horizons were much more likely to form within light marl beds. However, occasionally during deposition of laminated shale, storms did lead to non-deposition and formation of laminated limestone beds and laminated limestone nodule horizons (Radley, Reference Radley2008). Relatively shallow water depths during the Tilmanni and Planorbis zones, and thus greater influence of storms on bottom-water turbulence during laminated shale deposition, explains the concentration of laminated limestones within this interval. Conversely, relatively greater water depths, for example during the Liasicus Zone, meant that storm-related bottom-water turbulence was reduced and thus less likely to cause non-deposition and the formation of homogeneous limestone beds and nodule horizons within the light marls.
A strong storm influence on deposition in the offshore Blue Lias Formation is not surprising, given the well-known storm-related deposition of the ‘marginal facies’ (Johnson & McKerrow, Reference Johnson and McKerrow1995; Simms, Reference Simms, Simms, Chidlaw, Morton and Page2004; Sheppard, Reference Sheppard2006) and of the near-shore facies of the Blue Lias in South Wales (Section 4.a; Sheppard, Houghton & Swan, Reference Sheppard, Houghton and Swan2006). Storm influences have also been documented from Hettangian and Lower Sinemurian strata, of Blue Lias character, in the Paris Basin (Hanzo et al. Reference Hanzo, Lathuilière, Alméras, Dagallier, Guérin-Franiatte, Guillocheau, Huault, Nori and Rauscher2000).
In the Lower Pliensbachian of Yorkshire, Van Buchem, McCave & Weedon (Reference Van Buchem, McCave, Weedon, de Boer and Smith1994) showed that the orbitally forced cycles of grain size were related to varying storm intensity. The coeval Belemnite Marls of Dorset (or Stonebarrow Marl Member of the Charmouth Mudstone Formation of Page, Reference Page, Lord and Davis2010b) exhibit orbitally controlled alternations of light and dark marls (Weedon & Jenkyns, Reference Weedon and Jenkyns1999). Similar orbitally controlled cyclicity has been documented in the Pliensbachian strata of the Mochras borehole at Llanbedr, Wales (Ruhl et al. Reference Ruhl, Hesselbo, Hinnov, Jenkyns, Xu, Riding, Storm, Minisini, Ullmann and Leng2016). Sellwood (Reference Sellwood, Crimes and Harper1970) believed the rhythms of the Belemnite Marls indicated cycles in bottom-water turbulence but invoked short-term changes in sea level as a primary forcing mechanism. However, similarly to the Blue Lias, the changes in sediment composition in the Belemnite Marls can be linked to orbital-climatic cycles (Weedon & Jenkyns, Reference Weedon and Jenkyns1999), with indications of varying bottom-water turbulence (variations in characteristics of and types of burrow traces; Sellwood, Reference Sellwood, Crimes and Harper1970) linked to cycles in storminess. Deeper water conditions compared to the depositional environment of the Blue Lias may explain the lack of non-sequences and consequent lack of limestones except at the base and top of the Belemnite Marls (Hesselbo & Jenkyns, Reference Hesselbo, Jenkyns and Taylor1995; Weedon & Jenkyns, Reference Weedon and Jenkyns1999).
Normally, ammonites in the Blue Lias are not preserved in the light marls unless represented by crushed specimens, commonly with associated organic films; or their former presence may be indicated by oyster xenomorphs. Ammonites preserved within limestone beds required rapid burial under light marl (Paul, Allison & Brett, Reference Paul, Allison and Brett2008), most likely caused by storm-related re-deposition (Section 5; Radley, Reference Radley2008). However, preservation would only normally occur when rapid burial was followed fairly quickly by a period of non-deposition that initiated limestone formation. Non-deposition was probably also linked to storm activity and occurred after homogenization of the sediment by burrowers, but before aragonite dissolution. If non-deposition or hiatus formation did not quickly follow rapid deposition, formation of limestone beds devoid of ammonites took place, as a combination of aragonite dissolution, bioturbation and early compaction removed all trace of the shells. Ammonites within the laminated shales on the west coast of Somerset are preserved as: (a) shell-less impressions, (b) impressions with residual brown films, (c) as white aragonite, (d) as brown calcite near faults or (e) as pristine (i.e. iridescent) aragonite that is likely to have owed its survival to the protective effects of organic matter.
To account for the stable-isotope signatures of the limestone beds, it is suggested that initially early carbonate cementation produced framework-supporting fabrics that were usually strong enough to resist compaction of large macrofossils such as ammonites (if not previously dissolved). However, the final oxygen- and carbon-isotope signatures within the limestones represent a mixture of the early plus much later cement that filled the micrograde framework pores. At Lyme Regis, owing to the low net accumulation rate and the relatively shallow depths at which cementation finished, the oxygen isotopes in the limestone beds are heavier than those of marls and shales. By contrast, on the West Somerset coast, the much higher net accumulation rates ensured that final cementation of the limestone beds occurred much deeper in the sediment pile so that the overall oxygen-isotope values are generally lighter than the associated marls and shales and also lighter than the limestones at Lyme Regis.
Acknowledgements
The Royal Society provided a grant to G.P.W. in the early 1990s for the purchase of a Bartington MS meter. Stuart Robinson kindly supplied 38 ‘SAB’ samples (Hesselbo, Robinson & Surlyk, Reference Hesselbo, Robinson and Surlyk2004) from the Tilmanni and Planorbis biozones from St Audries Bay for MS analysis to supplement the collection obtained by Weedon (Reference Weedon1987a). Simon Robinson provided helpful advice on interpretations of MS. Our thanks go to Chris Paul for his constructive review. K.N.P. thanks the Orchard-Wyndham estate, including the late Dr Catherine Wyndham, and the East Quantoxhead Estate, including the late Colonel Sir Walter Luttrel, for ongoing permission to sample on the Estate's foreshore areas in West Somerset. Bob Cornes and Tom Sunderland of Natural England provided help and advice regarding permission for sampling in West Somerset and within the Axmouth-Lyme Regis National Nature Reserve, west of Lyme Regis, respectively. Raymond Roberts of Natural Resources Wales (formerly Countryside Council for Wales) advised on the St Mary's Well Bay section at Lavernock. K.N.P. would also like to thank María-José Bello-Villalba and Joseph Bello-Page for assistance in the field.