1. Introduction
How do social security (SS) systems affect aggregate effective labor supply? Answering this question is important to quantify the welfare effects of SS systems, which represent a large component of economic policy in developed economies. It is also important because the SS systems of these economies will need to be reformed to face a declining share of working-age individuals in their population. The literature typically provides answers to this question based on structural models featuring exogenous productivity profiles. This approach faces two issues. First, it requires estimating the productivity of old individuals, which is a task complicated by selection issues. Second, this approach abstracts from the possible changes in productivity levels in the counterfactual economy. In this paper, we estimate a quantitative overlapping generations (OLG) model on US data in which productivity is endogenous to assess the impact of SS on aggregate effective labor supply. Afterwards, we build variants of this model with fixed productivity to quantify the two aforementioned issues.
Our baseline model is an incomplete markets framework in which individuals make decisions on consumption and labor supply at both the intensive and extensive margins. The productivity of individuals is positively linked to their human capital, which evolves according to a Learning-By-Doing (LBD) mechanism. Individuals differ ex-ante in their initial human capital and in their ability, a variable that controls how their labor supply augments their future human capital. They face idiosyncratic shocks to their human capital, taste shocks, and health shocks, all of which affect their disutility of work. The government raises revenue from various taxes to finance its purchases, make transfers to low-income individuals, and finance a SS system modeled to mimic the US system. We estimate the model using indirect inference with US data to reproduce various life-cycle profiles.
We first remove the SS system to assess its effect on aggregate effective labor supply. We find that removing the SS in this economy creates a large positive effect on aggregate effective labor supply (
 $+10.31\%$
). We decompose the effect of the SS on aggregate effective labor supply and show that the main channel is the removal of SS benefits. This stimulates old-age labor supply via an income effect and spurs individuals to accumulate more human capital from middle age to be productive at old ages.Footnote
1
Observing large changes in human capital, and thus productivity, in our experiment does not suffice to conclude that the effect would be smaller in a model with fixed human capital. Additional mechanisms and different magnitudes of the other channels at play could offset the changes in human capital. We build a first variant of our LBD model with exogenous accumulation of human capital to determine the quantitative role played by endogenous human capital in our result. We refer to this variant as the exogenous model. We build the human capital profiles of this model using the panel of simulated individuals from our LBD model such that, conditional on ability and age, the average human capital is identical between the two models. It is particularly important that the levels of human capital are similar in the two models to isolate its role. Indeed, the larger the human capital at old ages, the greater the labor supply reaction of individuals in the experiment, regardless of how human capital accumulates. We calibrate the remaining parameters for the exogenous model to reproduce the same moments targeted to estimate our LBD model. We then repeat our main experiment and find that removing the SS in the exogenous model only increases aggregate effective labor supply by
 $5.10\%$
. Hence, the effect found in the model with endogenous human capital is more than twice the effect found with fixed human capital. This happens because old individuals have a low (and fixed) level of human capital in the exogenous model, so they do not increase their labor supply significantly when the SS benefits are removed. This is particularly true for individuals with a low endowment. Compared to the LBD model, the effective labor supply response of these individuals is much smaller. As these individuals have a particularly low level of human capital at old ages, they face negative tax rates due to transfers, which makes them unresponsive to the removal of SS benefits.
We also demonstrate the significance of this disparity between the two models when evaluating SS reforms in the context of an aging population. We modify the demographic structure of the models and we adjust the SS benefits to achieve budgetary balance. The difference in labor supply response at old ages between the two models leads to a substantial divergence in the change of aggregate effective labor supply, particularly given the significant proportion of elderly individuals in the population.
We then quantify the second issue, the selection bias issue, that researchers face when they assess the effect of SS reforms from structural models. This issue relates to the fact that the productivity process used in these models is likely biased because it is typically estimated on a sample of workers. This bias may contaminate the result of the experiments performed with the model. To assess this issue, we proceed as follows. We assume that the LBD model is the data generating process (DGP) and we build two models, the selection bias model and the No selection bias model, which are similar to our LBD model except that the productivity of individuals is a standard AR(1) process with an age-dependent mean. For the No selection bias model, we estimate the age-productivity profile from a panel of individuals simulated from the LBD model. Thus the productivity profile used in the No selection bias does not suffer from the selection bias issue. For the selection bias model, we estimate the age-productivity profile from a panel of workers simulated from the LBD model. Thus the productivity profile used in the selection bias model does suffer from the selection bias issue. We then calibrate the remaining parameters of these variants and we compare the result of our experiment between these two models to assess the magnitude of the selection bias issue. We find that aggregate effective labor supply increases by
 $7.00\%$
in the selection bias model and by
 $5.20\%$
in the No selection bias model. This happens because the selection bias implies that old individuals are more productive in the selection bias model so they increase more their labor supply after the removal of their SS benefits. The difference of result is smaller between the selection bias model and the No selection bias model than between the exogenous model and the LBD model. This means that the endogeneity issue is quantitatively more important than the selection bias issue. Moreover, given that the result of our experiment is closer in the selection bias model than in the selection bias model, it may be preferable not to correct the selection bias to analyze SS reforms if the productivity is assumed to be exogenous.
We explain how we complement the papers linked to our work in the next section, Section 2. In Section 3, we present the LBD model we use for our analysis. In Section 4, we detail the estimation of our LBD model. In Section 5, we present the result of our main experiment and we quantify the role of endogenous human capital in this result. In Section 6, we quantify the selection bias issue. In Section 7, we illustrate our findings in the context of population aging. Finally, we conclude in Section 8.
2. Literature
We make three contributions to the large literature studying the effects of the SS system.Footnote
2
Our first contribution is to assess the effect of the SS on aggregate effective labor supply in a rich OLG model and to show that this effect is large. Papers studying the elimination of the SS typically do not report a large effect on aggregate effective labor supply. For instance, Nishiyama and Smetters (Reference Nishiyama and Smetters2007) find that removing the SS increases aggregate effective labor supply by
 $3.5\%$
. Imrohoroglu and Kitao (Reference Imrohoroglu and Kitao2009) find a small effect of the SS on aggregate effective labor supply, between
 $-0.4\%$
and
 $0.35\%$
, for a large class of preferences. One exception is McGrattan and Prescott (Reference McGrattan and Prescott2017). They report that aggregate effective labor supply increases by
 $5\%$
in a counterfactual economy without the SS and with an older population. Hence, the sole effect of the removal of the SS on aggregate effective labor supply is likely large in their model. This happens for distinct reasons.Footnote
3
First, they use a different definition of physical capital, which implies that it increases by a greater amount in the experiment. This translates into a greater increase in the wage rate and, consequently, a greater increase in labor supply via a greater substitution effect. Second, the aggregate Frisch elasticity of labor supply in their baseline economy is considerably larger, 2.6, than in our LBD model, 0.44.Footnote
4
This also implies a greater substitution effect.Footnote
5
One reason behind the small effect found by Nishiyama and Smetters (Reference Nishiyama and Smetters2007) and Imrohoroglu and Kitao (Reference Imrohoroglu and Kitao2009) is the absence of an old-age labor supply decision. Laun and Wallenius (Reference Laun and Wallenius2016), Erosa et al. (Reference Erosa, Fuster and Kambourov2012), Alonso-Ortiz (Reference Alonso-Ortiz2014) include such a decision in their analysis. Although they do not assess the effect of eliminating the SS on aggregate effective labor supply, they show that differences in SS rules explain a large part of the differences in old-age employment rates across countries. They perform this cross-country exercice assuming that the productivity profile is identical in all countries. In contrast, our paper highlights how the size of a SS system affects the productivity of old individuals, suggesting that differences in SS rules could explain a larger share of the variation in old-age employment rates across countries.
Our second contribution is to demonstrate that the effect of SS on aggregate effective labor supply is much smaller in a model with fixed and unbiased levels of human capital. A seminal paper by Imai and Keane (Reference Imai and Keane2004) underlines the importance of human capital to understand labor supply decisions. A paper by Keane and Wasi (Reference Keane and Wasi2016) examines the effect of human capital accumulation on labor supply behavior. Our contribution directly complements the findings of Fan et al. (Reference Fan, Seshadri and Taber2024). These authors estimate a life-cycle model with human capital accumulation à la Ben-Porath. Their goal is to build a model explaining both the labor supply and wages of individuals over the life-cycle. They focus on the fit of different model variants, with or without endogenous human capital, to the data, whereas here our focus is on how different model variants change the result of the counterfactual analysis. This different objective implies different estimation strategies for the variants between their paper and ours. Given that Fan et al. (Reference Fan, Seshadri and Taber2024) are primarily interested in the performance of the fit of their exogenous model compared with that of their model with endogenous human capital, they estimate the accumulation law of human capital of the exogenous model independently of their model with endogenous human capital. The levels of human capital of old individuals may differ significantly between the two models with this approach. The reason behind this is that the accumulation law is identified from moments before age 65 and that the levels of human capital at old ages are out-of-sample predictions of the models. The large Frisch elasticity at old ages and the large income effect due to the removal of SS benefits they report for their exogenous model may indicate larger levels of human capital at old ages than in their model with endogenous human capital. Differently, we build our variant with exogenous human capital such that conditional on ability and age its human capital levels are identical to those of our LBD model. These differences imply that contrary to our paper, Fan et al. (Reference Fan, Seshadri and Taber2024) do not report a large difference in labor supply change after the removal of SS between their model with endogenous human capital and a variant with exogenous human capital.
There are other papers studying the characteristics of the SS in models with endogenous accumulation of human capital. For example, Kindermann (Reference Kindermann2015) shows that the SS encourages human capital accumulation and studies the welfare effects of removing this distortion. Blandin (Reference Blandin2021) also stresses the importance of human capital to assess the effect of a SS reform. However, the question he addresses is different from ours as he is interested in the consequences of removing the SS tax cap. More importantly, the channel he highlights is different from ours. In his analysis, human capital plays a key role because removing the tax cap increases the marginal tax rates on labor earnings, which discourages human capital investments by high-income individuals.Footnote 6 In contrast, human capital primarily affects the behavior of low-income individuals in our experiment.
Iskhakov and Keane (Reference Iskhakov and Keane2021) examine the consequences of removing the australian SS system in a life-cycle model with endogenous human capital. There are two main differences with our work. First, our analysis takes into account and quantifies general equilibrium effects. Second, and more importantly, we contrast our results with a specification with exogenous human capital. Wallenius (Reference Wallenius2013) studies the effect of SS rules in a model with endogenous human capital. However she does not contrast her results with a specification with exogenous human capital as we do to understand and quantify its role. Moreover, her model is quite different from ours given that it is a representative agent model.
Our third contribution is to show that using the productivity of workers in a structural model partly compensates for the omission of endogenous accumulation of human capital. French (Reference French2005) and Erosa et al. (Reference Erosa, Fuster and Kambourov2012) propose methods to correct the selection bias issue in dynamic structural models. To the best of our knowledge, we are the first to use the simulation of a model with endogenous human capital to quantitatively study the consequences of the selection bias.
Finally, our paper also relates to a large literature studying the economic consequences of population aging.Footnote 7 Ludwig et al. (Reference Ludwig, Schelkle and Vogel2012) and Vogel et al. (Reference Vogel, Ludwig and Borsch-Supan2017) show that taking into account endogenous human capital mitigates the adverse effects of demographic change. There are several differences between our work and these papers. First, in terms of modeling. These papers use representative agent models and abstract from an extensive margin of labor supply. Second, they abstract from old-age labor supply, while we show that old-age labor supply is the key reason behind the significant difference in labor supply change between a model with endogenous human capital and a model with exogenous human capital.
3. Model economy
We present our LBD model in this section. The latter will be used to assess the effect of the SS on aggregate effective labor supply and to develop variants to gauge the endogeneity and the selection bias issues.
3.1. Demographics
Time is discrete. The economy is populated by overlapping generations of individuals. Their age is indexed by
 $j=1,..,J$
. Lifetime is uncertain. Individuals reach the age
 $j$
with the probability
 $Q_{j}$
and survive to the next period with probability
 $q_{j}$
at that age. The size of each new cohort grows at the rate
 $\nu$
. The population of age
 $j$
is noted
 $L_{j}$
and obeys the following recursion:
 $L_{j}=\frac{q_{j-1}L_{j-1}}{1+\nu }$
.
3.2. Preferences
Individuals derive utility from consumption and leisure, which is the amount of time not spent on working. More precisely, they make decisions to maximize the following lifetime expected utility:Footnote 8
 \begin{equation} \mathbb{E}_{1}\biggl [\sum _{j=1}^{J}Q_{j-1}\beta ^{j-1}\Bigl (q_{j}\bigl (u(c_{j},l_{j})+\sigma _{S}\epsilon _{j,l_{j},\Upsilon '_{j}}\unicode{x1D7D9}_{j\leq J_{W}}\bigr ) + (1-q_{j})v(a_{j+1}) \Bigr ) \biggr ]\\[5pt] \end{equation}
Where
 $\beta$
is the discount factor,
 $c_{j}$
represents the amount of consumption, and
 $l_{j}$
represents the number of hours worked at age
 $j$
.
 $\Upsilon '_{j}\in \mathbb{C}_{j}(\Upsilon _{j})$
is a binary variable indicating whether an individual claims her SS benefits at age
 $j$
or not. The choice set
 $\mathbb{C}_{j}(\Upsilon{j})$
is described below. As in Keane and Wasi (Reference Keane and Wasi2016), the choice of hours worked is restricted to a discrete set
 $\mathbb{D}_{j}$
. Individuals can participate in the labor market up to age
 $J{W}$
, meaning that
 $\mathbb{D}_{j}=\{0\}$
if
 $j\gt J{W}$
. Otherwise,
 $\mathbb{D}_{j}$
consists of five different levels, including the possibility of not working.
 $u(c,l)$
is the utility derived from consuming
 $c$
units of goods and working
 $l$
hours. It has the following functional form:
 \begin{equation} u(c,l)=\frac{c^{\alpha _{L}(1-\sigma )}(1-l)^{(1-\alpha _{L})(1-\sigma )}}{1-\sigma }-\chi _{\eta } \unicode{x1D7D9}_{l\gt 0} \end{equation}
Where
 $\sigma$
is the coefficient of relative risk aversion for total utility.
 $\alpha _{L}$
determines the weight on consumption relative to leisure.
 $\chi _{\eta }$
is a fixed cost associated to labor market participation. It depends on the health status
 $\eta$
of the individual. This health status variable is described below.
 $((\epsilon _{j,l,\Upsilon '})_{l\in \mathbb{D}_{j},\Upsilon ' \in \mathbb{C}_{j}(\Upsilon )})_{j\in [\![1,J_{W}]\!]})$
are taste shocks to the discrete decisions of the individual. They are independent and identically distributed according to a type-I distribution. As shown by Iskhakov et al. (Reference Iskhakov, Jørgensen, Rust and Schjerning2017), these taste shocks are useful to smooth the value function, which would otherwise present a kink at the points of indifference between two levels of hours worked. We interpret them as error terms capturing omitted factors influencing the labor supply decision of individuals.
 $\sigma _{S}$
controls the scale of these taste shocks.
Finally, the last term of (1) is a warm-glow bequests motive. We assume the following functional form for
 $v(:)$
:
 $v(a) =B_{eq}\frac{a^{\alpha _{L}(1-\sigma )}}{1-\sigma }$
(see for example Hosseini (Reference Hosseini2015)). This bequest motive is useful to avoid that individuals decumulate their assets too quickly during the retirement period (Nardi et al. (Reference De Nardi, İmrohoroğlu and Sargent1999)).
3.3. Human capital accumulation
Human capital evolves according to a Learning-By-Doing (LBD) mechanism: the more individuals work today, the more productive they are tomorrow. The effectiveness of this mechanism depends on the ability
 $A$
of individuals, which is constant over the life-cycle. Hence the marginal effect of labor supply on next period human capital is positive and positively depends on the ability of the individual. Human capital is also subject to a depreciation rate
 $\delta _{H}$
and to idiosyncratic shocks
 $(\Psi _{j})_{j \in [\![1,J_{W}]\!]}$
. These shocks are independent and follow a log-normal distribution,
 $\log (\Psi _{j}) \sim \mathcal{N}(0,\sigma _{\Psi }^{2})$
. The evolution of the human capital
 $h_{j}$
of an individual working
 $l_{j}$
hours is then given by:
 \begin{equation} h_{j+1}=\Psi _{j}(h_{j}(1-\delta _{H})+A(h_{j}l_{j})^{\theta }) \end{equation}
 $\theta$
is a parameter belonging to
 $(0,1)$
, so much that the LBD mechanism has decreasing returns-to-scale. Blandin (Reference Blandin2018) and Blandin and Peterman (Reference Blandin and Peterman2019) employ a specification very similar to (3).Footnote
9
As shown by Huggett et al. (Reference Huggett, Ventura and Yaron2006), heterogeneity across the endowment space
 $(A,h_{1})$
is necessary to reproduce the dispersion of labor earnings over the lifecycle. Thus we allow individuals to differ both in their ability
 $A$
and in their initial human capital
 $h_{1}$
. Following Blandin (Reference Blandin2018), we assume that the distribution
 $\Lambda$
of this endowment is log-normal,
 $(\log (h_{1}),\log (A)) \sim \mathcal{N}(\mu _{a},\mu _{h_{1}},\sigma _{a}^{2},\sigma _{h_{1}}^{2},\rho )$
.
3.4. Earnings
An individual with human capital level
 $h$
working
 $l$
hours earns the following labor income:
 \begin{equation} W(h,l)=whl\max (1,(\frac{l}{\overline{l}})^{\psi }) \end{equation}
Where
 $w$
is the wage rate. The last term of (4) is an adjustment factor penalizing part-time work.Footnote
10
 $\overline{l}$
is the amount of hours worked corresponding to full-time work. Note that the productivity of individuals confounds with their human capital. Thus, we use the two terms interchangeably throughout the remainder of the paper. We define effective labor supply at the individual level as the product of human capital/productivity, labor supply and the part-time penalty (
 $hl\max (1,(\frac{l}{\overline{l}})^{\psi })$
).
3.5. Health
A non-negligible share of old individuals is in bad health condition, which limits their possibility to supply labor. Thus, abstracting from health in the model would lead to overestimate the labor supply response of old individuals in our experiment. Therefore, we include a health status variable
 $\eta$
. Individuals are either in bad health,
 $\eta _{j}=0$
, or in good health,
 $\eta _{j}=1$
. The evolution of
 $\eta _{j}$
is governed by age-dependent transition probabilities. Bad health lowers labor supply via a greater disutility of work.Footnote
11
Hence we assume that
 $\chi _{A,0}\gt \chi _{A,1}$
.
3.6. Retirement System
The SS benefits of an individual depends on two factors: her Average Indexed Monthly Earnings (AIME) and the age at which she claims her SS benefits
 $j_{claim}$
. Individuals claim their SS benefits between the ages
 $J_{1}$
and
 $J_{2}$
. They are allowed to continue to work while receiving their SS benefits and the claiming decision is irreversible. Thus, the choice set
 $\mathbb{C}_{j}(\Upsilon _{j})$
of the claiming decision
 $\Upsilon '_{j}$
at age
 $j$
depends on the current claiming status
 $\Upsilon _{j}$
as follows:
 \begin{align} \begin{split} \mathbb{C}_{j}(\Upsilon _{j})&= \left \{ \begin{array}{l@{\quad}l} \{0\}& \mbox{if } j\lt J_{1}\\[5pt] \{0;\;1\}& \mbox{if } J_{1} \leq j \leq J_{2} \mbox{ and } \Upsilon _{j}=0\\[5pt] \{1\} & \mbox{otherwise} \end{array} \right . \end{split} \end{align}
We approximate the AIME by the value at age
 $j_{claim}$
of the variable
 $\overline{e}_{j}$
, which is defined by the following equation:
 \begin{align} \begin{split} \overline{e}_{j+1}&= \left \{ \begin{array}{l@{\quad}l} \frac{j\overline{e}_{j}+\min (W(h,l),\hat{e})}{j+1}& \mbox{if } j\lt J_{1}\\[5pt] \max (\overline{e}_{j}, \frac{j\overline{e}_{j}+\min (W(h,l),\hat{e})}{j+1})& \mbox{if } J_{1} \leq j \leq J_{2} \\[5pt] \overline{e}_{j} & \mbox{otherwise} \end{array} \right . \end{split} \end{align}
And
 $\overline{e}_{1}=0$
. This approximation follows French (Reference French2005) among others. It means that before age
 $J_{1}$
, the AIME is computed as the average of labor earnings up to the SS tax cap
 $\hat{e}$
. From ages
 $J_{1}$
to
 $J_{2}$
, the AIME is updated only if labor earnings allow an increase of the AIME.
The SS benefits
 $p$
of an individual then write:
 $p=\gamma (j_{claim})P(\overline{e}_{j_{claim}})$
. Where
 $P(.)$
is the benefit-earnings rule and
 $\gamma (.)$
adjusts SS benefits according to the claiming age:
 \begin{align} \begin{split} \gamma (j)& \left \{ \begin{array}{l@{\quad}l} \lt 1 & \mbox{if } j\lt NR\\[5pt] =1 & \mbox{if } j=NR\\[5pt] \gt 1 & \mbox{if } j\gt NR \end{array} \right . \end{split} \end{align}
Where
 $NR$
is the normal retirement age. Finally, before age NR, individuals who have already claimed their SS benefits are subject to the Earning Test. Hence their SS benefits
 $p$
are reduced by the quantity
 $ET(p)$
, which is given by the following expression:
 \begin{equation} ET(p)=\min (p,\tau _{ET}\max (0,W(h,l)-y_{ET})) \end{equation}
Where
 $y_{ET}$
is the earning test threshold. In the same time, their AIME is increased by
 $ET(p)$
. In practice, to simplify the exposition, note that the state variables of the indiviudals with respect to her SS status are
 $(\overline{e}_{j},p,\Upsilon _{j})$
, where
 $\overline{e}_{j}$
is relevant if and only if
 $\Upsilon _{j}=0$
, while
 $p$
is relevant if and only if
 $\Upsilon _{j}=1$
. And the next period values of these two state variables can be written as:
 $\overline{e}_{j+1}=f(\overline{e}_{j},W(h,l), \Upsilon _{j},j)$
and
 $p'=g(p,W(h,l),\Upsilon _{j},j)$
.
3.7. Government
In addition to providing SS benefits, the government spends an amount of resources equal to
 $G$
and realizes transfers between individuals. The government levies resources through the confiscation of accidental bequests, a corporate tax, a consumption tax, the taxation of income and the payroll tax. Corporate and consumption taxes are linear taxes respectively on positive capital income and consumption purchases. Their respective rates are
 $\tau _{K}$
and
 $\tau _{C}$
. The payroll tax,
 $T_{S}(.)$
, is composed of the SS tax, a linear tax at rate
 $\tau _{S}$
on labor earnings below the SS tax cap, and the Medicare tax, a linear tax at rate
 $\tau _{med}$
on all labor earnings W,
 $T_{S}(W)=\tau _{med}W+\tau _{S}\min (W,\hat{e})$
.
We now detail the tax and transfer schedule that incorporates both the taxation of income and the transfers to individuals. Taxable income is the sum of capital income net of corporate tax, labor earnings net of half of the SS tax and SS benefits. The post-tax and transfer income
 $T(a,W,p)$
associated to a level of assets
 $a$
, labor earnings
 $W$
and SS benefits
 $p$
(net of the earning test) is given by:Footnote
12
 \begin{equation} T(a,y,p)=\min (ra,0)+\max (T_{0}((1-\tau _{K})\max (ra,0)+y-0.5T_{S}(y)+p)^{1-\tau _{1}}-0.5T_{S}(y),\underline{y}) \end{equation}
The first term inside the max operator of (9) is the tax and transfer functional form highlighted by Heathcote et al. (Reference Heathcote, Storesletten and Violante2017). These authors show that this function provides a good fit to the US tax and transfer schedule. A limitation of this function, that they acknowledge, is that the government does not provide any transfer to individuals without any resources. To remedy this, we inspire from Hubbard et al. (Reference Hubbard, Skinner and Zeldes1995) and augment our tax and transfer schedule with an income floor
 $\underline{y}$
, the second term of (9). Yum (Reference Yum2018) and del Rio (Reference del Rio2015) both stress the importance of including such transfers to low-income individuals to capture well their labor supply behavior. This ingredient also appears of first importance for our main experiment. Poor-wealth and old individuals mainly rely on their SS benefit to finance their consumption. Consequently, they are particularly hit by their removal. By abstracting from transfers to low-income individuals, the model would thus overestimate their labor supply reaction. Finally, we note that our formulation of the tax and transfer schedule (9) excludes the possibility for individuals to borrow against the income floor.
3.8. Markets
Markets are incomplete. Individuals cannot purchase insurance contracts against the various shocks they face. However, they can hold assets that pay a risk-free interest rate
 $r$
.Footnote
13
Individuals aged below
 $J_{1}$
can borrow at the risk free rate up to an exogenous limit
 $\underline{a}_{j}=\underline{a}$
. Individuals older than
 $J_{1}$
face a tight budget constraint,
 $\underline{a}_{j}=0$
.
3.9. Production
The final good is produced by a representative firm with Cobb-Douglas technology:
 \begin{equation} Y=BK^{\alpha }H^{1-\alpha } \end{equation}
Where
 $Y$
is output and
 $K$
is the physical capital input.
 $H$
is the aggregate effective labor supply, hence the sum across individuals of effective labor supply. It is the quantity of interest of the paper. We assume that the total factor productivity
 $B$
is constant over time.
 $\alpha \in (0,1)$
is the capital share. Physical capital depreciates at rate
 $\delta$
. Production factors are paid at their marginal productivity. Noting
 $k=\frac{K}{H}$
, the physical to human capital ratio, we obtain:
 \begin{equation} w=(1-\alpha )k^{\alpha } \end{equation}
 \begin{equation} r=\alpha k^{\alpha -1}-\delta \end{equation}
3.10. Equilibrium
At each age
 $j$
, an individual is characterized by a state vector
 $\Omega =(a,h,\overline{e},p,\eta, A,\Upsilon, ((\epsilon _{j,l,\Upsilon '})_{l\in \mathbb{D}_{j},\Upsilon ' \in \mathbb{C}_{j}(\Upsilon )})))$
where
 $a$
is the amount of assets held,
 $h$
is the human capital stock,
 $\overline{e}$
is the average of past labor earnings,
 $p$
is the SS benefits,
 $\eta$
is the health status of the individual,
 $\Upsilon$
is a binary variable indicating whether SS benefits have been claimed or not and
 $A$
denotes the ability of the individual. Initially,
 $a$
and
 $\overline{e}$
are both equal to
 $0$
, while
 $h$
and
 $A$
are drawn from their joint distribution
 $\Lambda$
.
 $\eta$
is initially drawn from its empirical distribution and then evolves according to age-dependent transition probabilities.
 $\Upsilon$
is worth 0 before age
 $J_{1}$
, and 1 after age
 $J_{2}$
.
 $((\epsilon _{j,l,\Upsilon '})_{l\in \mathbb{D}_{j},\Upsilon ' \in \mathbb{C}_{j}(\Upsilon )})_{j\in [\![1,J_{W}]\!]})$
are independently drawn from a Type-I value distribution. At age
 $j$
the distribution over
 $\Omega$
is written
 $\mu _{j}(\Omega )$
. The value of being in the state
 $\Omega$
at age
 $j$
is
 $V_{j}(\Omega )=\max _{l\in \mathbb{D}_{j}, \Upsilon '\in \mathbb{C}_{j}(\Upsilon )}(\tilde{V}_{j}(a,h,\overline{e},p,\eta, A,\Upsilon, l,\Upsilon ')+\sigma _{S}\epsilon _{j,l,\Upsilon '})$
, where
 $\tilde{V}_{j}(a,h,\overline{e},p,\eta, A,\Upsilon, l,\Upsilon ')$
satisfies the following Bellman equation:
 \begin{align} \begin{split} \tilde{V}_{j}(a,h,\overline{e},p,\eta, A,\Upsilon, l,\Upsilon ')&=\max _{a', c}(u(c,l)+\beta q_{j}\mathbb{E}_{j}[V_{j+1}(\Omega ')]+\beta (1-q_{j})v(a'))\\[5pt] s.t.&\\[5pt] a'&\geq \underline{a}_{j}, c\gt 0\\[5pt] a'&=a+T(a,W(h,l),\Upsilon (p-\unicode{x1D7D9}_{j\lt NR}ET(p,h,l))) -c(1+\tau _{c})\\[5pt] h'&=\Psi (h(1-\delta _{H})+A(hl)^{\theta })\\[5pt] \overline{e}'&=f(\overline{e},W(h,l), \Upsilon, j)\\[5pt] p'&=g(p,W(h,l),\Upsilon, j) \end{split} \end{align}
For a variable
 $z$
of the problem (13), we note
 $z_{j}(\Omega )$
the optimal value of
 $z$
at the state
 $\Omega$
and at the age
 $j$
. We define a stationary competitive equilibrium as follows:
-
• Individuals solve the problem (13) at each age.
-
• The representative firm chooses capital stock
 $K$
and human capital input
$H$
to maximize profits given the production function (10).
-
• Capital and labor markets clear:
(14)
\begin{equation} K=\sum _{j=1}^{J}L_{j}\int a_{j}(\Omega )\mu _{j}(d\Omega ) \end{equation}
(15)
\begin{equation} H=\sum _{j=1}^{J}L_{j}\int h_{j}(\Omega )l_{j}(\Omega )\max (1,(\frac{l_{j}(\Omega )}{\overline{l}})^{\psi })\mu _{j}(d\Omega ) \end{equation}
-
• The budget of the government is balanced:
(16)
\begin{align} G&=\tau _{C}\sum _{j=1}^{J}L_{j}\int c_{j}(\Omega )\mu _{j}(d\Omega )+wH+rK-\nonumber \\[5pt] &\quad \sum _{j=1}^{J}L_{j}\int T(a_{j}(\Omega ),W(h_{j}(\Omega ),l_{j}(\Omega ),\unicode{x1D7D9}_{j\geq J_{R}}P(\overline{e}_{J_{R}}(\Omega )))\mu _{j}(d\Omega ) \end{align}
-
•
$(\mu _{j})_{1\leq j\leq T}$
is consistent.


3.11. Resolution
Solving the problem of the individuals is challenging for two main reasons. The first issue relates to the dimension of the state space: in addition to the age, ability and health variables, the problem features three continuous state variables. The second issue is due to the non-concavity of the problem because of the discrete labor supply decision and the LBD technology. We follow Iskhakov and Keane (Reference Iskhakov and Keane2021) and we note that conditional on the choice of hours worked, the problem of individuals only features one endogenous state variable. Thus we can implement a very fast solution algorithm by using the extension of the endogenous grid method to problems with discrete and continous choices (Iskhakov et al. (Reference Iskhakov, Jørgensen, Rust and Schjerning2017)). Appendix A provides details on the resolution.
4. Data and estimation
We proceed in two steps for the stationary equilibrium to reproduce various moments of the US economy in 2015. We first assign values to a first set of parameters using data and the literature. Then, we estimate the value of the remaining parameters by indirect inference. Tables 1 and 2 summarize the values of the parameters of the LBD model.
Pre-set parameters

Notes: the table displays the values of the parameters set without solving the LBD model.
 $\overline{y}$
is the average of labor earnings.
Estimates in the Learning-By-Doing (LBD) model and in the exogenous model
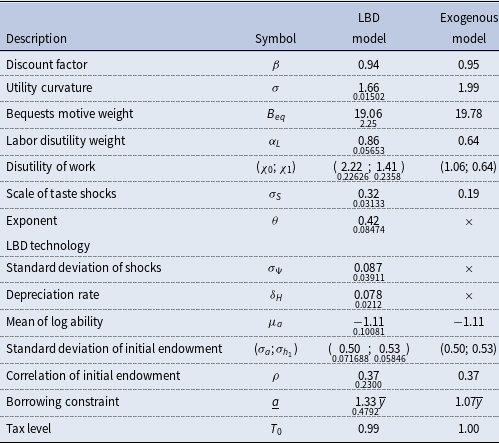
Notes: the table displays the values of the parameters set jointly to reproduce the targeted moments. For the estimated parameters, the standard error is reported below the value of the estimate.
4.1. Parameters Set Externally
4.1.1. Demographics
We solve the model at a biannual frequency.Footnote
14
Individuals live at most 38 periods,
 $J=38$
. They start making decisions at the age of 24–25, so much that the maximal age they can reach is 99–100. They are allowed to work during the first 28 periods,
 $J_{W}=28$
, or equivalently up to age 78–79. We use the 2015 survival probabilities
 $(q_{a})_{25\leq a\leq 99}$
for both sexes of the human mortality database. We choose the annual population growth rate
 $\nu$
for the ratio of individuals aged more than 65 to individuals aged between 24 and 64 to be equal to the value reported by the UN population database for 2015 (
 $28\%$
). We find
 $\nu =1.3\%$
.
4.1.2. Production
We set the capital share
 $\alpha$
to the standard value of
 $0.35$
.
We choose the depreciation rate of physical capital
 $\delta$
for the annual interest rate to be equal to
 $4\%$
. Given that at the equilibrium, the annual capital to output ratio will be equal to
 $3$
, this requires that
 $\delta =\frac{\alpha }{\frac{K}{Y}}-r=\frac{0.35}{3}-0.04=7.67\%$
. The TFP
 $B$
is chosen to normalize the wage rate
 $w$
.
4.1.3. Endowment
The possible levels of hours worked are, for
 $j\leq J_{W}$
,
 $\mathbb{D}_{j}=\{0;\;0.5\overline{l};\;0.85\overline{l};\;\overline{l};\;1.15\overline{l}\}$
, where
 $\overline{l}$
is the mean of hours worked conditional on working in the PSID. Considering an endowment of
 $5,110$
hours in a year, we obtain
 $\overline{l}=0.44$
. The exponent of the part-time penalty is set to the value of Aaronson and French (Reference Aaronson and French2004),
 $\psi =0.415$
. We normalize the parameter
 $\mu _{h_{1}}$
.
4.1.4. Health
We adopt a logit specification for the health transition probabilities:
 \begin{equation} \log \left (\frac{\mathbb{P}(\eta '=1|\eta, j,time)}{\mathbb{P}(\eta '=0|\eta, j,time)}\right )=\sum _{age=24-25}^{age=78-79}(\varkappa _{0,age}1_{age=j}+\varkappa _{1,age,\eta }1_{age=j})+\varkappa (time) \end{equation}
Where
 $\varkappa (time)$
is a full set of time dummies. We estimate (17) using the PSID dataset, considering as unhealthy individuals self-reporting a poor or a bad health condition. Figure 1 reports the estimated health transition probabilities.
Health data.

4.1.5. Social security
The SS tax cap is set to 2.47 times the average of labor earnings as in Huggett and Ventura (Reference Huggett and Ventura1999),
 $\hat{e}=2.47\overline{y}$
. Concerning the function
 $P(.)$
, we use the US benefit-earnings rule. The latter is a concave and piecewise linear function with three bend points:
 \begin{align} P(\overline{e}_{R})&=(0.9-0.32)\min (\overline{e}_{R}-0.2\overline{y},0)+(0.32-0.15)\min (\overline{e}_{R}-1.24\overline{y},0)\nonumber\\[5pt] &\quad +0.15\min (\overline{e}_{R}-2.47\overline{y},0) \end{align}
Where
 $(0.9;\; 0.32;\; 0.15)$
are the replacement rates, and
 $0.2\overline{y},1.24\overline{y}$
and
 $2.47\overline{y}$
are the estimates of the bend points of Huggett and Ventura (Reference Huggett and Ventura1999).
We use the value of Imrohoroglu and Kitao (Reference Imrohoroglu and Kitao2012) for the Earning Test tax rate,
 $\tau _{ET}=0.5$
. According to the values reported by Jones and Li (Reference Jones and Li2018), the Earning Test threshold,
 $y_{ET}$
is linked to the SS tax cap
 $\hat{e}$
by the relationship
 $y_{ET}=\frac{\hat{e}}{7.52}$
. Individuals are allowed to claim their SS benefits from period
 $J_{1}=20$
to period
 $J_{2}=23$
. The normal retirement period NR is set to 22, this corresponds to an actual age equal to 66-67. The adjustment coefficients
 $\gamma (.)$
are computed as the two-year average of the annual values reported by Bagchi (Reference Bagchi2015). Finally, the SS tax rate
 $\tau _{S}$
is set to
 $10.6\%$
, while the Medicare tax rate
 $\tau _{med}$
is set to
 $2.9\%$
.
4.1.6. Government
We set the consumption tax rate
 $\tau _{C}$
to
 $5\%$
. For the corporate tax rate,
 $\tau _{K}$
, we follow Guner et al. (Reference Guner, Lopez-Daneri and Ventura2016) to determine its value. These authors report that corporate taxes amount to
 $1.7\%$
of GDP on the period 1987-2007. Given the value of the capital to output ratio in our economy, the tax rate consistent with this value is
 $14.2\%$
. The level of government expenditures
 $G$
is equal to
 $15.5\%$
of GDP as in Bakis et al. (Reference Bakis, Kaymak and Poschke2015). Regarding the tax function (9), we first set the value of the progressivity parameter to the value estimated by Heathcote et al. (Reference Heathcote, Storesletten and Violante2017),
 $\tau _{1}=0.181$
. We set the income floor to
 $15\%$
of the average of labor earnings,
 $y_{floor}=0.15\overline{y}$
. This value is very close to that of Kopecky and Koreshkova (Reference Kopecky and Koreshkova2014) and is in the range of values, from
 $10$
to 20
 $\%$
of
 $\overline{y}$
, that these authors judge appropriate.
4.2. Second-Stage Estimation
The remaining parameters,
 $(\beta, \tau _{0},B_{eq},(\chi _{\eta })_{\eta \in \{0;1\}},\alpha _{L},\sigma, \delta _{H},\theta, \sigma _{S},\sigma _{\Psi })$
and the distributional parameters
 $(\mu _{a},\sigma _{a}^{2},\sigma _{h_{1}}^{2},\rho )$
, are determined internally. We constrain the model to match an annual capital-to-output ratio equal to
 $3$
by iterating over the discount factor
 $\beta$
. We balance the budget of the government via the parameter
 $T_{0}$
.
We compute the other parameters for our model to reproduce several life-cycle profiles of the US economy. The identification of the parameters governing human capital accumulation follows Huggett et al. (Reference Huggett, Ventura and Yaron2006) and Blandin (Reference Blandin2018). The variance of the initial log human capital,
 $\sigma _{h_{1}}^{2}$
, is identified by the variance of the log wage at early ages. The higher the variance of the log ability,
 $\sigma _{a}^{2}$
, the greater the increase in wage dispersion over the lifecycle. Thus,
 $\sigma _{a}^{2}$
is mostly identified by the variance of the log wage at old ages. A higher value of
 $\sigma _{\Psi }$
shifts the variance of the log wage upwards at all ages. Thus, this parameter is identified by the level of this profile. A higher average of the log ability
 $\mu _{a}$
implies a greater growth in wages over the lifecycle. Thus,
 $\mu _{a}$
is mainly identified by the peak of the log wage profile. The correlation between ability and initial human capital,
 $\rho$
, influences the shape of the variance of the log wage profile: low values produce a U-shaped profile, while values close to 1 produce an increasing profile. Thus,
 $\rho$
is identified by the shape of the variance of the log wage profile. The parameter
 $\theta$
tends to rotate the log wage profile: a lower value of
 $\theta$
implies a higher growth rate of wages at the beginning of the lifecycle. Thus,
 $\theta$
is identified by the shape of the log wage profile. At old ages the evolution of human capital tends to be driven by its depreciation since older individuals work fewer hours. Thus,
 $\delta _{H}$
is identified by the shape of the log wage profile at old ages.
The parameters
 $(\chi _{0}, \chi _{1})$
influence the labor market participation decision. Thus, they are identified by the lifecycle profile of the employment rate conditional on health. As
 $\sigma _{S}$
tends to infinity, the employment rate converges toward
 $0.5$
at all ages. Thus, a higher value for
 $\sigma _{S}$
rotates the employment profile counterclockwise, and this parameter is identified by the employment rate profile. The parameter
 $\alpha _{L}$
is identified by the lifecycle profile of hours worked conditional on working. The parameter
 $\underline{a}$
influences the shape of the consumption profile at young ages when the mass of poor-wealth individuals is large. The parameter
 $\sigma$
affects both the slope of the consumption and the assets profile. Finally, the parameter
 $B_{eq}$
is identified by the assets profile at old ages.
The wage, hours, employment and assets profiles are computed from the PSID, while the consumption profile is computed from the CEX. Details on the computation of the moments are relegated in Appendix C. The objective we minimize is the squared distance between the moments computed from the data and their model counterparts. Formally, let
 $\gamma =(B_{eq},(\chi _{\eta })_{\eta \in \{0;1\}},\alpha _{L},\sigma, \delta _{H},\theta, \sigma _{S},\sigma _{\Psi },\mu _{a},\sigma _{a}^{2},\sigma _{h_{1}}^{2},\rho )$
the set of estimated parameters,
 $m=(m_{i})_{i\in I}$
the set of targeted moments and
 $M(\gamma )=(M_{i}(\gamma ))_{i\in I}$
their model counterparts. The indirect inference estimate of
 $\gamma$
is :
 \begin{equation} \hat{\gamma }=\textrm{argmin}_{\tilde{\gamma }}(G(\tilde{\gamma }))=\textrm{argmin}_{\tilde{\gamma }}((m-M(\tilde{\gamma }))'W^{-1}(m-M(\tilde{\gamma }))) \end{equation}
The weighting matrix
 $W$
is diagonal. Appendix B details how we perform the minimization of the function
 $G(.)$
. Table 2 reports the obtained values. Appendix C details how we compute the standard errors of the estimated parameters.
4.2.1. Backfitting
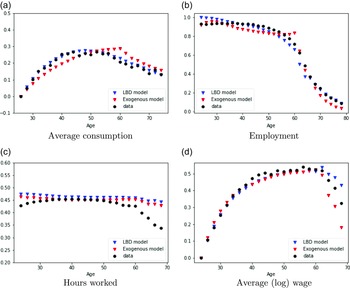
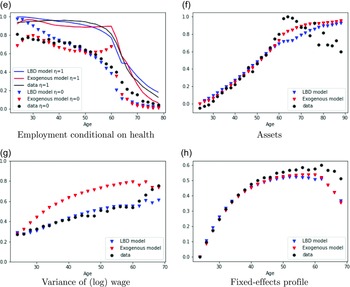
From Figure 2 and 3, we see that the LBD model reproduces quite well the targeted profiles. This happens without using a large number of parameters. Table 3 also reveals that the LBD model reproduces well the various macroeconomic targets.
Life-cycle profiles in the data, in the LBD model and in the exogenous model.

Life-cycle profiles in the data, in the LBD model and in the exogenous model.
Notes: the figures 2 and 3 display the life-cycle profile of various variables in the LBD model, in the data and in the exogenous model. For figure (a) the data source is the CEX. For the remaining figures, the data source is the PSID. Wages and hours worked are conditional on labor market participation. The series of figure (a), (d), (f) and (h) are normalized by their initial value.

4.2.2. Labor supply elasticities
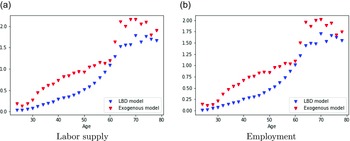
We also examine the Frisch elasticity of labor supply in our model. This is useful for interpreting some of our results and assessing the realism of labor supply behavior in the model. The left panel of Figure 4 shows the Frisch elasticity of labor supply by age, while the right panel displays the Frisch elasticity of labor market participation by age. The magnitude of the Frisch elasticity is consistent with values reported in other papers using dynamic structural models. For instance, in a model with exogenous productivity, Jones and Li (Reference Jones and Li2018) report a Frisch elasticity of labor supply ranging from 0.15–2.02. In a model with endogenous accumulation of human capital, Fan et al. (Reference Fan, Seshadri and Taber2024) report values ranging from slightly less than 0.2–1.
The magnitude is also broadly consistent with econometric estimates. The aggregate Frisch elasticity of employment in the LBD model, 0.56, falls within the range of values reported by Chetty et al. (Reference Chetty, Guren, Manoli and Weber2011), who report a value of 0.28. We obtain an aggregate Frisch elasticity of labor supply equal to 0.61 in the LBD model, while Chetty et al. (Reference Chetty, Guren, Manoli and Weber2011) report a slightly higher value of 0.82.
5. The effect of the SS on aggregate effective labor supply: the role of human capital
In this section, we assess the effect of the SS on aggregate effective labor supply in our LBD model, and we examine the role played by endogenous human capital accumulation in our results. To achieve this, we construct a variant of our LBD model, hereafter referred to as the exogenous model, in which human capital evolves exogenously. We will first discuss the development of this variant before presenting our findings.
5.1. A variant with exogenous human capital
We build the variant as closely as possible to the LBD model for the differences in results between the two models to only reflect the different mechanism of human capital accumulation. For this, we assume that the variant is identical to the LBD model except that the law of accumulation (3) is now given by the following equation:
 \begin{equation} h_{j+1}=e^{\Psi _{j}}h_{j}\gamma _{j}(A) \end{equation}
Where
 $\Psi _{j} \sim \mathcal{N}(0,\,\sigma _{\Psi, j,A}^{2})$
and
 $\gamma _{j}(A)$
are coefficients that depend on age and ability. Importantly, (20) does not depend on any choice variable.
To calibrate the parameters of the exogenous model, we target the same moments used to estimate the LBD model. However, the set of targeted moments does not include any moments from the unconditional distribution of wages because the latter is unobserved. This is problematic here because the levels of human capital need to be similar between the two models to isolate the role played by the endogenous accumulation of human capital. Indeed, the larger the human capital at old ages, the greater the labor supply reaction of individuals in the experiment, independently of the way human capital accumulates. To avoid this, we impose restrictions on the parameters of the variant to ensure that the unconditional distribution of wages is similar between the models. First, we assume that the initial endowment distribution is the same as in the LBD model. Second, we choose
 $\gamma _{j}(A)$
for the average of the log growth rate of human capital conditional on ability and age to be equal in the two models,
 $\gamma _{j}(A)=\mathbb{E}[\log (\frac{h_{j+1}}{h_{j}})|A,j]$
. Third, we choose
 $\sigma _{\Psi, j,A}$
for the variance of the log growth rate of human capital conditional on ability and age to be equal in the two models,
 $\sigma _{\Psi, j,A}^{2}=$

 $[\log (\frac{h_{j+1}}{h_{j}})|A,j]$
. These restrictions, in particular, imply that the wage profiles conditional on ability are identical in the two models.Footnote
15
A drawback of this approach is that it is more challenging for the exogenous model to replicate the moments of the wage distribution conditional on working. This is because most parameters governing the wage process have been fixed by our previous restrictions. This is evident in the fit of the exogenous model (Figure 3). We observe that the variance of the log wage is higher in the exogenous model compared to the data. However, the exogenous model replicates the other moments quite well. Alternatively, we could specify functional forms for
 $\gamma _{j}(A)=f_{1}(\tilde{\gamma _{1}},j,A)$
and
 $\sigma _{\Psi, j,A}=f_{2}(\tilde{\gamma _{2}},j,A)$
, where
 $f_{1}$
and
 $f_{2}$
are given functions, and
 $\tilde{\gamma _{1}},\tilde{\gamma _{2}}$
are additional parameters to be estimated. Then we would calibrate the exogenous model to reproduce the previous moments as well as moments from the unconditional distribution of the wage of the LBD model. However, this approach is more computationally demanding because there are more parameters to calibrate. Moreover, it is unclear which moments of the unconditional distribution of the wage we should include. For these reasons, we choose to pursue our first approach.
Finally, we also note that Fan et al. (Reference Fan, Seshadri and Taber2024) follows a different approach as they similarly estimate their exogenous model and their model with endogenous human capital. The reason is that their goal is to compare the ability of both models to fit the data, not to highlight the role of endogenous human capital accumulation in the difference of results between their two models.
Figure 2 and 3 report the fit of the exogenous model. Figure 4 reports the value of the Frisch elasticity by age. The aggregate Frisch elasticity of labor supply and labor market participation are respectively 0.96 and 0.87. Hence, the Frisch elasticity in the LBD model is lower than in the exogenous model. This is particularly true at young ages where the dynamic payoff of labor supply, its effects on future labor earnings, dominates its contemporaneous payoff.
Model performance
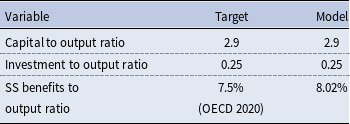
Notes: the table compares the values of certain moments in the Learning-By-Doing model to their target.
Labor supply elasticities.
Notes: the left figure displays the elasticity of labor supply to a transitory and anticipated increase of the wage rate in the LBD model and in the exogenous model. The right figure displays the elasticity of labor supply at the extensive margin to a transitory and anticipated increase of the wage rate.

5.2. Results
In this subsection, we assess the effect of removing the SS on aggregate effective labor supply in the LBD model and determine the role of human capital in our result by performing the same experiment in the exogenous model. To implement this experiment, we set the SS tax rate
 $\tau _{S}$
and the level of SS benefits to 0. The level of government spending,
 $G$
, and all other parameters, except
 $T_{0}$
, remain unchanged. The parameter
 $T_{0}$
adjusts to balance the government’s budget. Table 4 reports the impact on the main aggregate variables in the three models. Figures 5 and 6 report the behavioral reactions of individuals. We observe that removing the SS system has a strong positive effect on aggregate effective labor supply in the LBD model (
 $10.31\%$
). For comparison, Imrohoroglu and Kitao (Reference Imrohoroglu and Kitao2009) find an effect ranging from
 $-0.4\%$
to
 $0.35\%$
, while Nishiyama and Smetters (Reference Nishiyama and Smetters2007) find an effect equal to
 $3.5\%$
. This is more than twice the impact observed in the exogenous model (
 $5.10\%$
). This contrasts with the findings of Fan et al. (Reference Fan, Seshadri and Taber2024). They present three models with endogenous human capital in which the effect of removing the SS on the lifetime output of individuals ranges from
 $-0.043\%$
to
 $+1.298\%$
, while in their exogenous model, the effect is
 $-0.308\%$
(Table D3 in the Appendix D of Fan et al. [Reference Fan, Seshadri and Taber2024]). As previously mentioned, their strategy to calibrate their exogenous model is different from ours. It implies that the human capital profiles of their main model and their exogenous model might diverge at old ages, which could confound the role of human capital accumulation in the difference of results of the experiment.
Macroeconomic effects

Notes: the table reports the relative change of the main macroeconomic variables when we eliminate the social security. For the interest rate, we report its annual value in the counterfactual economy. In the baseline economy of both models, the value of the annual interest rate is
 $4\%$
. The CEV is computed as
 $(\frac{\mbox{Welfare(counterfactual)}-\mbox{Utility bequests(baseline)}}{\mbox{Welfare(baseline)}-\mbox{Utility bequests(baseline)}})^{\frac{1}{\alpha _{L}(1-\sigma )}}-1$
.
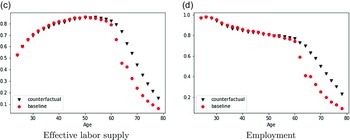
Life-cycle profiles in the baseline and in the counterfactual economies: LBD model.

Life-cycle profiles in the baseline and in the counterfactual economies: exogenous model.

We can see from Figure 5 and Figure 6 that the result stems from a larger increase in old-age effective labor supply in the LBD model compared to the exogenous model. This is the result of both higher employment rates and greater levels of human capital at those ages. To better understand the difference in results between the two models, we decompose the effect of the SS on aggregate effective labor supply into the following five channels:
-
(i) the removal of SS benefits
-
(ii) the removal of the SS tax
-
(iii) the decrease in the level of the income tax
-
(iv) the increase in the wage rate
-
(v) the decrease in the interest rate
In Table 5, we report how each of these effects changes aggregate effective labor supply in each model. We observe that the removal of SS benefits drives the increase in effective labor supply in both models. Additionally, we can see that this effect is much larger in the LBD model than in the exogenous model. Since this effect encourages old-age labor supply through an income effect, it motivates individuals to accumulate more human capital to be productive at these ages. Conversely, the incentive to work more at old ages is weakened in the exogenous model since older individuals have a lower level of human capital at those ages.Footnote 16
We briefly comment on the other channels. The removal of the SS tax decreases labor supply in both models through a wealth effect, and this effect is greater in the LBD model. The difference in results with respect to income taxation is due to the difference in the change in the level of the income tax between the two models. In the LBD model, the government budget is almost unchanged after the removal of the SS, which explains the negligible impact of the change in income taxation on
 $H$
. The loss of the surplus of the SS is compensated by the increase in labor income and a small increase in capital income due to the increase in the capital stock. In the exogenous model, the increase in labor income is smaller, and capital income decreases. Thus, the government needs to increase the level of the income tax to balance its budget, which increases labor supply through a wealth effect. This wealth effect also explains the sign of the labor supply change caused by the increase in the wage rate and the decrease in the interest rate.
It is instructive to look at the effective labor response across initial types. Let us first focus on the LBD model. We compute the lifetime effective labor supply change across the endowment space. We first observe from Table 6 that there is a substantial effective labor supply response by all individuals. The response is monotonically decreasing with respect to initial human capital. Indeed, individuals at the bottom of the initial human capital distribution tend to be the poorest ones. Thus, they are particularly affected by the removal of SS benefits. The effective labor supply response with respect to ability is not monotonic. This reflects two opposite effects. On the one hand, the lower
 $A$
the poorer the individual, the higher the income effect due to the removal of SS benefits. On the other hand, the lower
 $A$
the less effective the individual is at augmenting their human capital at old ages, and the lower the effective labor supply responses at those ages.
We repeat this exercise for the exogenous model. We observe from Table 6 that the decline in the effective labor supply response is the largest for individuals with either low ability or a low initial human capital level. The reason is that individuals with a low endowment have a particularly low level of human capital at old ages in the baseline economy of the LBD model and also in the exogenous model This is a direct consequence of this endowment. Individuals with lower ability accumulate less human capital over the life-cycle, and are thus less productive at old ages. It is also due to the fact that individuals with a low endowment leave the labor force earlier. This happens because the low level of human capital is an incentive to leave the labor force, and because the negative income effect of SS benefits is stronger for individuals with low assets. Thus, the potential wage of older individuals with a bad endowment is low in the exogenous model. Because of the transfers, the reservation wage of such individuals remains greater than their potential wage for any value of their SS benefits.
5.2.1. Welfare
We also examine the welfare effects due to the removal of the SS. From Table 4, we note that the CEV is greater in the LBD model than in the exogenous model. Without the SS system, individuals finance their old-age consumption via greater savings and greater labor earnings at old ages. If human capital is fixed, then the second channel is limited because individuals have a low level of human capital at those ages. Conversely, individuals equipped with the LBD technology can more easily obtain resources on the labor market at old ages. This shows that endogenous human capital is also important for computing the welfare effects of SS systems.
Decomposition

Notes: the table reports the change of aggregate effective labor supply,
 $H$
, due to each effect. For example, the last column reports the change of
 $H$
when we set the interest rate to its value of the counterfactual economy.
Lifetime effective labor supply in the endowment space

Notes: the table reports the lifetime effective labor supply change according to the endowment of the individual. Low (respectively high) ability individuals are in the bottom (respectively top)
 $27\%$
of the ability distribution. Individuals with a low (respectively high) level of initial human capital are in the bottom (respectively top)
 $ 25\%$
of the initial human capital distribution.
6. The effect of the SS on aggregate effective labor supply: the role of the selection bias
6.1. Two variants to isolate the role of the selection bias
In this section, we investigate a second issue that researchers face when they assess the effect of SS reforms from a structural model. The typical approach is to specify a structural model similar to our LBD model where labor earnings are still given by equation (4),
 $W(h,l)=whl\max (1,(\frac{l}{\overline{l}})^{\psi })$
, except that the productivity
 $h_{i, a}$
of an individual
 $i$
of age
 $a$
is an exogenous process specified by the following equation:
 \begin{equation} \log (h_{i, a})=\gamma _{a} +\eta _{i}+\epsilon _{i,a} \end{equation}
 \begin{equation} \epsilon _{i,a+1}=\rho \epsilon _{i,a}+u_{i,a} \end{equation}
Where
 $\eta _{i}$
represents an individual fixed effect, and
 $\epsilon _{i,a}$
and
 $u_{i,a}$
are error terms. We refer to
 $(\gamma _{a})_{a}$
as the log productivity profile. Similar specifications are used for example in Alonso-Ortiz (Reference Alonso-Ortiz2014), Imrohoroglu and Kitao (Reference Imrohoroglu and Kitao2012), Kopecky and Koreshkova (Reference Kopecky and Koreshkova2014). In these papers, the parameters of the process defined by (21) and (22) are estimated using wage data and then incorporated into the model to conduct the experiment (or alternatively the estimates are taken from other papers). However, a problem arises because the wages of individuals are only observed when they are employed. Consequently, the estimated parameters are likely affected by selection bias, which in turn contaminates the results of the experiment. We refer to this issue as the selection bias issue. We quantify this selection bias problem as follows. We assume that the LBD model is the DGP, and we draw two samples from this DGP. The first sample is a random sample of the DGP that includes both workers and non-workers. Thus, it is a sample in which the estimation of the parameters of the process (21) and (22) is not subject to selection bias. The second sample is a random sample of the DGP that includes only observations of workers, mimicking real-world datasets. For each of these two samples, we estimate the parameters of the process (21) and (22). We then use these estimates in our structural model and calibrate the remaining parameters. Finally, we compare the results of our experiment using both samples, which allows us to quantify the extent of the selection bias problem (Figure 7).
Productivity profiles.
Notes: the figure displays the productivity profile
 $(e^{\gamma _{a}})_{a}$
in the selection bias model and in the No selection bias model.

Life-cycle profiles in the selection bias model and in the No selection bias model.

Life-cycle profiles in the selection bias model and in the No selection bias model.
Notes: the figures display the life-cycle profile of various variables in the selection bias model and in the No selection bias model.

We refer to selection bias model(respectively No selection bias model) as the model calibrated with the productivity process that does (respectively does not) suffer from the selection bias issue. There are two issues related to the calibration of these two variants that are worth discussing. First, the selection bias concerns the log productivity by age
 $(\gamma _{a})_{a}$
, the fixed effects distribution (which is discretized with the same number of ability levels as in the LBD model), and the parameters governing the AR(1) process (
 $\rho$
and
 $\sigma _{u}$
). We found that the estimates of the parameters
 $\rho$
and
 $\sigma _{u}$
were quite close in both samples. Moreover, the estimate of
 $\rho$
is a bit larger than the values reported in other studies. Thus, we choose to set
 $\rho$
and
 $\sigma _{u}$
to standard values (the values used by Kitao (Reference Kitao2014)) for both models. Second, the set of targeted moments used to calibrate the remaining parameters is restricted compared to the estimation of the LBD model. More precisely, we do not target any moments of the wages process: the log wage profile (with and without fixed effects) and the variance of the log wage profile. Indeed the parameters of this process (equations (21) and (22)) are already estimated on our two samples without having to use the model. This is consistent with the two-stage approach employed in similar models such as Kitao (Reference Kitao2014).Footnote
17
Figure 8 and Figure 9 show the fit of the two models with respect to the targeted moments. Table 7 reports the values of the parameters of the two models. Figure 10 reports the Frisch elasticity of labor supply and labor market participation by age. Figure 7 compares the productivity profile in the two variants. It reveals that the selection bias is particularly important at old ages: the selection bias leads to an overestimate of the wage by
 $15\%$
at age 75.
Model parameters

Notes: the table displays the values of parameters set jointly to reproduce the targeted moments in the selection bias model and in the No selection bias model.
Labor supply elasticities.
Notes: the left figure displays the elasticity of labor supply to a transitory and anticipated increase of the wage rate in the selection bias model and in the No selection bias model. The right figure displays the elasticity of labor supply at the extensive margin to a transitory and anticipated increase of the wage rate.

6.2. Results
In this subsection, we replicate our previous experiment in the selection bias model and in the No selection bias model. The impact on the main macroeconomic variables is reported in Table 4. We observe that the impact on
 $H$
in the No selection bias model is very similar to what was found inthe exogenous model. This is not surprising because the productivity process in both the exogenous model and in the No selection bias model is constructed from the unconditional distribution of the human capital process in the LBD model. Consequently, older individuals exhibit relatively low productivity, and as a result, they do not significantly increase their labor supply after the removal of the SS. In contrast, the selection bias model features older individuals with higher productivity due to the contamination of their productivity estimates by the selection bias issue. This explains why the increase in
 $H$
is greater in the selection bias model compared to the No selection bias model. However, this difference is smaller than the one observed between the LBD model and the exogenous model. Part of the reason for this lies in the higher disutility of labor in the selection bias model compared to the No selection bias model, as evidenced by the larger value of the parameter
 $\alpha _{L}$
. Since individuals are more productive in the selection bias model, a greater disutility of labor is necessary for the model to align with the observed data.
In summary, we find that:
 $(i)$
the endogeneity issue, assessed by comparing the results of the experiment between the exogenous model and the LBD model, leads to an underestimation of the impact on
 $H$
by
 $50.53\%$
.
 $(ii)$
the selection bias issue, assessed by comparing the results of the experiment between the selection bias model and the No selection bias model, leads to an overestimation of the impact on
 $H$
by
 $34.6\%$
. Consequently, the endogeneity of human capital appears to be the more significant issue. Moreover, some of the results of the experiment in the selection bias model are closer to those of the LBD model than those of the No selection bias model. Given that the LBD model is not subject to the selection bias issue and the endogeneity issue, its results are likely closer to the true results than those of our different variants. Thus, when predicting the impact of SS reforms on
 $H$
or GDP, the best model between the selection bias model and the No selection bias model is the selection bias model. Hence, it may be more judicious not to correct for the selection bias. However, this does not hold true for assessing the impact of SS reforms on welfare. Indeed, we observe that the CEV of the No selection bias model is closer to the CEV of the LBD model. The reason for this is that the disutility of labor is greater in the selection bias model. Consequently, the increase in labor supply due to the removal of the SS has a more negative impact on the welfare of individuals.
7. Revisiting the effect of population aging on aggregate effective labor
We illustrate our results from the previous subsections by considering more realistic SS reforms. In light of the ongoing demographic changes, SS rules must adapt. Two potential adjustments are: (1) increasing the SS tax rate and (2) reducing the level of SS benefits. We examine here how these two adjustments impact aggregate effective labor supply in our four models.
The demographic change we consider is as follows (see Figure 11). We use the predicted survival probabilities for 2100 from Bell and Miller (Reference Bell and Miller2005), and we set the population growth rate to 0. This results in a dependency ratio, which is the number of individuals aged over 65 to those aged between 25 and 65, equal to
 $46.68\%$
, compared to the baseline economy where it is equal to
 $27.6\%$
. In scenario 1, we adjust the SS tax to achieve a balanced SS budget. In scenario 2, we adjust the SS benefits to achieve a balanced SS budget. In both cases, the parameter
 $T_{0}$
also adjusts to balance the rest of the government budget. We report the changes in the main macroeconomic variables in Table 8.
The comparison across models is consistent with our results from the previous section. First, in all models, the reduction in
 $H$
is smaller in scenario 2 than in scenario 1, and this difference is more pronounced in the LBD model. In the LBD model, the decrease in
 $H$
in scenario 2 is equal to
 $54.2\%$
of the decrease in scenario 1. In the exogenous model, the selection bias model, and the No selection bias model, this corresponds to
 $80.1\%$
,
 $73.9\%$
and
 $80\%$
, respectively. Second, when it comes to predicting the effect on
 $H$
, the best model between the selection bias model and the No selection bias model is the selection bias model. It predicts a smaller decline in
 $H$
than the No selection bias model, and the difference in
 $H$
between the two scenarios is also closer to that of the LBD model. Finally, we also observe that the selection bias model produces results on welfare close to those of the LBD model. This contrasts with our results from the main experiment, where the CEV of the No selection bias model is closer to the CEV of the LBD model compared to the selection bias model. The comparison of the welfare effects between the selection bias model and the No selection bias model depends mainly on two factors. On the one hand, the reduction in resources is greater in the No selection bias model, which reduces individual welfare more significantly. On the other hand, for a given level of resources, a larger labor supply of individuals decreases welfare more in the selection bias model because of the higher disutility of labor. We can see that the first factor dominates in these experiments.
Macroeconomic effects

Notes: the table reports the relative change of the main macroeconomic variables when we eliminate the social security. For the SS tax rate,
 $\tau _{SS}$
, we report its value in the counterfactual economy. To compute the CEV, we follow Ludwig et al. (Reference Ludwig, Schelkle and Vogel2012) and we compute the lifetime expected utility of the counterfactual economy using the survival probabilities of the baseline economy.
Demographic change.

8. Conclusion
In this paper, we studied the impact of the SS system on aggregate effective labor supply. For this, we estimated a quantitative OLG model on US data, which includes labor supply decisions at both the intensive and extensive margins, as well as endogenous accumulation of human capital. When we eliminated the SS system, we found a large positive impact on aggregate effective labor supply (
 $+10.31\%$
).
We then constructed variants of this model to address two common issues that researchers face when performing the same experiment in a structural model with an exogenous productivity process: (i) the productivity profile is not a structural parameter, and (ii) the estimation of the productivity profile is subject to selection bias.
To quantify issue (i), we built a variant of our LBD model, the exogenous model, which is similar to our LBD model except that human capital accumulation is exogenous. Eliminating the SS in this variant increased aggregate effective labor supply by only
 $5.10\%$
, highlighting the quantitative importance of the endogeneity issue.
To quantify issue (ii), we built two variants, the selection bias model and the No selection bias model which are similar to our LBD model except that productivity follows a standard AR(1) process with an age-dependent mean. For the selection bias model, we estimated the productivity profile using a panel of individuals simulated from our LBD model. For the No selection bias model, we estimated the productivity profile using a panel of workers simulated from our LBD model. As a result, the productivity profile in the No selection bias model suffers from the selection bias issue, while the one in the selection bias model does not. Eliminating the SS system respectively increased aggregate effective labor supply by
 $5.2\%$
and
 $7.0\%$
in the selection bias model and in the No selection bias model. This demonstrates that the selection bias issue tends to overestimate the effect of the SS on aggregate effective labor supply, although it is quantitatively less significant than the endogeneity issue.
We also illustrated our results by altering the demographics of the models and considering various adjustments to SS rules to balance its budget. We demonstrated the importance of endogenous human capital in evaluating potential adjustments. Furthermore, we showed that No selection bias model produces results quite similar to those of the LBD model. Hence, it may be preferable not to correct the selection bias when studying SS reforms in a model with fixed human capital.
Our work has a natural extension. We emphasized the role of human capital through experiments on the stationary equilibrium of our models. A comprehensive examination of transitional dynamics would be necessary to evaluate potential SS reforms in response to ongoing demographic changes. Conducting such an exercise in a model with endogenous accumulation of human capital could provide new insights into this question.
Acknowledgements
I am grateful to Xavier Fairise, François Langot, Anthony Terriau, Thomas Weitzenblum, two anonymous referees and the associate editor for their helpful comments.
Appendix A
In this section, we explain how we compute the decision rules of the problem (13). During the retirement period, the problem is standard, therefore we focus on the working-age period. At age
 $j\leq J_{W}$
, an individual in the state
 $(a,h,\overline{e},p,\eta, A,\Upsilon, (\epsilon _{j,l,\Upsilon '})_{l\in \mathbb{D}_{j},\Upsilon ' \in \mathbb{C}_{j}(\Upsilon )}))$
chooses a number of hours worked and a claiming status equal to:
 \begin{equation} \mathop{\textrm{argmax}}\limits_{l\in \mathbb{D}_{j}, \Upsilon '\in \mathbb{C}_{j}(\Upsilon )}(\tilde{V}_{j}(a,h,\overline{e},p,\eta, A,\Upsilon, l,\Upsilon ')+\sigma _{S}\epsilon _{j,l,\Upsilon '}) \end{equation}
Where
 $\tilde{V}_{j}(a,h,\overline{e},p,\eta, A,\Upsilon, l,\Upsilon ')$
is given by the following problem:
 \begin{align} \begin{split} \tilde{V}_{j}(a,h,\overline{e},p,\eta, A,\Upsilon, l,\Upsilon ')=\max _{c\geq 0,a'\geq \underline{a}_{j}}( u(c,l)+\beta (1- q_{j})v(a')+&\\[5pt] \beta q_{j}\mathbb{E}_{j}[ \int V_{j+1}(a',e^{\zeta _{j}}H,\overline{e}',p',\eta ',A,\Upsilon ',(\epsilon '_{\hat{l}, \hat{\Upsilon }})_{\hat{l}\in \mathbb{D}_{j+1},\hat{\Upsilon } \in \mathbb{C}_{j+1}(\Upsilon ')})&\prod _{\hat{l}\in \mathbb{D}_{j+1},\hat{\Upsilon } \in \mathbb{C}_{j+1}(\Upsilon ')}g_{I}(\epsilon '_{\hat{l},\hat{\Upsilon }})d\epsilon '_{\hat{l},\hat{\Upsilon }}])\\[5pt] s.t.&\\[5pt] a'=a+T(a,W(h,l),\Upsilon (p-\unicode{x1D7D9}_{j\lt NR}ET(p,h,l)))-(1+\tau _{C})c&\\[5pt] H=(1-\delta _{H})h+A(hl)^{\theta }&\\[5pt] \overline{e}'=f(\overline{e},W(h,l), \Upsilon, j)&\\[5pt] p'=g(p,W(h,l),\Upsilon, j)& \end{split} \end{align}
Where
 $g_{I}(.)$
is the probability density function of the type-I distribution. The expectation with respect to the taste shocks in the previous equation can be analytically computed thanks to the log-sum formula:
 \begin{align} &\int V_{j+1}(a',e^{\zeta _{j}}H,\overline{e}',p',\eta ',A,\Upsilon ',(\epsilon '_{\hat{l}, \hat{\Upsilon }})_{\hat{l}\in \mathbb{D}_{j+1},\hat{\Upsilon } \in \mathbb{C}_{j+1}(\Upsilon ')})\prod _{\hat{l}\in \mathbb{D}_{j+1},\hat{\Upsilon } \in \mathbb{C}_{j+1}(\Upsilon ')}g_{I}(\epsilon '_{\hat{l},\hat{\Upsilon }})d\epsilon '_{\hat{l},\hat{\Upsilon }}\nonumber \\[5pt] &\qquad\qquad\qquad\qquad\qquad\qquad\qquad= \nonumber \\[5pt] &\qquad\qquad\qquad \sigma _{S}\log \left(\sum _{\hat{l}\in \mathbb{D}_{j+1},\hat{\Upsilon }\in \mathbb{C}_{j+1}(\Upsilon ')}e^{\frac{\tilde{V}_{j+1}(a',e^{\zeta _{j}}H,\overline{e}',p',\eta ',A,\Upsilon ',\hat{l},\hat{\Upsilon })}{\sigma _{S}}}\right)\nonumber \\[5pt] &\qquad\qquad\qquad\qquad\qquad\qquad\qquad\hat{=}\nonumber \\[5pt] &\qquad\qquad\qquad\qquad\qquad\qquad\qquad\qquad\qquad \hat{V}_{j+1}(a',e^{\zeta _{j}}H,\overline{e}',p',\eta ',A,\Upsilon ') \end{align}
As observed by Iskhakov and Keane (Reference Iskhakov and Keane2021), the problem (24) only features one endogenous state variable. Thus, the problem can be solved using the endogenous grid method, particularly its extension to non-concave problems (Iskhakov et al. (Reference Iskhakov, Jørgensen, Rust and Schjerning2017), Druedahl and Jorgensen (Reference Druedahl and Jorgensen2017)).
The solution to (24) necessarily satisfies the following first-order condition:
 \begin{equation} \alpha _{L}{c}^{\alpha _{L}(1-\sigma )-1}(1-l)^{(1-\alpha _{L})(1-\sigma )}=(1+\tau _{C})\beta (q_{j}\mathbb{E}_{j}[\frac{\partial \hat{V}_{j+1}}{\partial a'}]+(1-q_{j})v'(a')) \end{equation}
We then work with a grid for the end-of period assets
 $(a'_{i})_{i\in N'}$
. From (26), we can deduce the consumption level
 $c_{j}(a'_{i})$
. The associated beginning-of-period level of assets
 $a_{j}(a'_{i})$
is then given by the budget constraint:
 \begin{equation} a_{j}(a'_{i})+T(a_{j}(a'_{i}),W(h,l),\Upsilon (p-\unicode{x1D7D9}_{j\lt NR}ET(p,h,l)))=(1+\tau _{C})c_{j}(a'_{i})+a'_{i} \end{equation}
It is easy to observe that equation (27) has a unique solution. The latter does not admit a closed-form expression so we employ a rootfinding procedure to compute
 $a_{j}(a'_{i})$
. We then follow Druedahl and Jorgensen (Reference Druedahl and Jorgensen2017) and specify an exogenous grid
 $(x_{i})_{i \in N}$
for the beginning-of-period level of assets. At each of these points, we first set
 $\tilde{V}_{j}(x_{i},h,\overline{e},p,\eta, A,\Upsilon, l,\Upsilon ')$
to the value of being wealth constrained:
 \begin{align} &\tilde{V}_{j}(x_{i},h,\overline{e},p,\eta, A,\Upsilon, l,\Upsilon ')=u(\frac{x_{i}+T(x_{i},W(h,l),\Upsilon (p-1_{j\lt NR}ET(p,h,l)))-\underline{a}_{j}}{1+\tau _{C}},l)\nonumber \\[5pt] &\quad +\beta q_{j}\mathbb{E}_{j}[\hat{V}_{j+1}(\underline{a}_{j},e^{\zeta _{j}}H,\overline{e}',p',\eta ',A,\Upsilon ')]+\beta (1-q_{j})v(\underline{a}_{j}) \end{align}
We then work with our endogenous grid and search for points
 $x_{i}$
belonging to segments of the form
 $[\min (a_{j}(a'_{i}),a_{j}(a'_{i+1}),\max (a_{j}(a'_{i}),a_{j}(a'_{i+1})]$
. For such points, we compute the consumption level by linear interpolation and the associated value function. If the latter is greater than the current value of
 $\tilde{V}_{j}(x_{i},h,\overline{e},p,\eta, A,\Upsilon, l,\Upsilon ')$
, we update our decision rule at this point.
Appendix B
In this Appendix, we explain more precisely how we achieve the calibration of the model. We first discretize the initial endowment space
 $(A,h_{1})$
into
 $7\times 25$
cells. As we normalize the log average of
 $h_{1}$
, the grid for
 $h_{1}$
is centered around this value and fixed once for all. A contrario the grid for
 $A$
is recomputed for each new pair
 $(\mu _{A},\sigma _{A})$
according to a Rouwenhorst method. For each cell, we simulate
 $2,000$
history of shocks. Together with the policy rules we can then compute the various moments conditional on the initial endowment. The unconditional moments are obtained by averaging across cells.
To minimize the function (19), we follow Huggett et al. (Reference Huggett, Ventura and Yaron2011) and we partition the vector
 $\gamma$
as
 $(\gamma _{1},\gamma _{2})$
with
 $\gamma _{1}=(B_{eq},(\chi _{\eta })_{\eta \in \{0;1\}},\alpha _{L},\sigma, \delta _{H},\theta, \sigma _{S},\sigma _{\Psi })$
and
 $\gamma _{2}=(\mu _{A},\sigma _{A},\sigma _{H},\rho )$
. Given
 $\gamma _{1}$
we compute
 $G(\gamma )$
through the following steps:
-
1. We make a guess on
$(\mu _{A},\sigma _{A},\beta, T_{0},\overline{e})$
. -
2. We discretize the levels of ability.
-
3. We solve for the policy rules using the algorithm detailed in Appendix A.
-
4. Let
$\tilde{m}_{1}$
and
$\tilde{m}_{2}$
be respectively the life-cycle profile of the average and the variance of log wage in the data, let
$\tilde{M}_{1}(\gamma _{1},\gamma _{2})$
and
$\tilde{M}_{2}(\gamma _{1},\gamma _{2})$
be their model counterpart. We compute our update
$\gamma _{2}'$
of
$\gamma _{2}$
as:(29)With
\begin{align} \gamma _{2}'&=\textrm{argmin}_{\gamma _{2}}((\tilde{m}_{1}-\tilde{M}_{1}(\gamma _{1},\gamma _{2}))'W_{1}^{-1}(\tilde{m}_{1}-\tilde{M}_{1}(\gamma _{1},\gamma _{2}))\nonumber \\[5pt] &\qquad +(\tilde{m}_{2}-\tilde{M}_{2}(\gamma _{1},\gamma _{2}))'W_{2}^{-1}(\tilde{m}_{2}-\tilde{M}_{2}(\gamma _{1},\gamma _{2})) \end{align}
$W_{i}=\textrm{diag}((\tilde{m}_{i,j}^{2})_{j=24,..60})$
.
-
5. Given the computed values of the distributional parameters, we compute the capital to output ratio, the average labor earnings
$\overline{e}'$
and the deficit of the government budget
$D$
. -
6. If the quantities
$|\overline{e}-\overline{e}'|, |\frac{K}{Y}-2.9|, |D|,|\mu _{A}-\mu _{A}'|$
and
$|\sigma _{A}-\sigma _{A}'|$
are greater than our tolerance threshold, then we update our guesses by the Broyden method and we return to step 2. Otherwise we compute
$G((\gamma _{1},\gamma _{2}'))$
and we terminate.


To determine
 $\gamma _{1}$
, we draw a Sobol sequence of length 3,000 and we compute
 $G(\gamma )$
at all those points. We repeat this two times in the region containing the best 30 points. Finally, we use a simplex algorithm around our four best points.
Appendix C
In this appendix, we explain how we compute the standard errors of the LBD model parameters’estimates. Let
 $n$
be the number of individuals observed in the PSID. As
 $n$
tends to infinity, we assume that the size of the CEX linearly grows in
 $n$
. Then,
 $\sqrt{n}(\hat{\gamma }-\gamma )$
is asymptotically normal with the following covariance matrix:
 \begin{equation} V=(1+\frac{n}{n_{S}})(D'WD)^{-1}D'W\Omega WD(D'WD)^{-1} \end{equation}
Where
 $n_{S}$
is the number of simulated individuals, which is equal to
 $7\times 25\times 2,000=350,000$
.
 $\Omega$
is the covariance matrix of the moments. We assume that the PSID and the CEX are two independent samples. Then
 $\Omega$
is block diagonal. Its elements are computed using 1,000 bootstrap replications of each dataset.
 $D$
is the jacobian matrix of the moments with respect to
 $\gamma$
, which is computed by finite difference.
Appendix D
In this Appendix, we explain how we compute the data moments targeted in the estimation. The employment, hours, wage and assets profiles are computed from the PSID. The health status variable is only available from the 1984 wave. Thus we use the waves from 1984 to 2019. Before 1999, the assets are only available for the years 1984, 1989 and 1994. We use the consumer price index to compute real earnings and real assets. As in Huggett et al. (Reference Huggett, Ventura and Yaron2011), we restrict the sample to males. We define a worker as an individual reporting at least 468 hours worked in a year and earning at least
 $\$2,000$
in
 $2019$
dollars. The wage of an individual is computed from her labor earnings and her hours worked according to equation (4) and assuming an endowment of 5,110 hours in a year. We convert the age of an individual to take into account the biannual frequency of the model. We then obtain the age profiles by regressing the variable of interest on a full set of age and year dummies. The consumption profile is computed from the CEX. We use the dataset of Aguiar and Hurst (Reference Aguiar and Hurst2013). The data is at the household level. To take into account the changes of household composition over the life-cycle, we transform our consumption variable using the OECD scale equivalence. We then obtain the profiles with a full set of age and year dummies as regressors.
Appendix E
In this Appendix, we explain how we smooth the tax function (9). This is necessary to implement our solution algorithm detailed in Appendix A, which is based on the differentiability of the value function with respect to the level of assets.Footnote
18
We subsitute
 $\widetilde{min}$
and
 $\widetilde{max}$
in (9). Formally,
 \begin{equation} \widetilde{min}(x,y)=-\sigma _{C}\log (e^{-\frac{x}{\sigma _{C}}}+e^{-\frac{y}{\sigma _{C}}}) \end{equation}
 \begin{equation} \widetilde{max}(x,y)=\sigma _{C}\log (e^{\frac{x}{\sigma _{C}}}+e^{\frac{y}{\sigma _{C}}}) \end{equation}
With
 $\sigma _{C}=0.07$
.
Appendix F
In this appendix, we compare the life-cycle profiles of the selection bias model and the No selection bias model to the data.
Baseline versus counterfactual profiles in the selection bias model and in the No selection bias model.