I. Introduction
The positioning of a product and its assignment to a product category is a key step in marketing strategy. Marketers are faced with a conflict as they try to reconcile technical processes, regulatory standards, and consumer perception. In the case of low-alcohol wines, difficulties rise from technical aspects (preserving organoleptic qualities), regulation (alcohol content must exceed 8.5%) (OIV, 2014) and consumers who believe that low-alcohol wine must have an alcohol content of 3–8% (Saliba et al., Reference Saliba, Ovington and Moran2013) or even be alcohol-free.Footnote 1 Moreover, consumer perception and attitudes toward a new food product (e.g., low-alcohol wine) can derive from sensory and nonsensory information. A cue such as “if taste remains the same” may increase the acceptability of low-alcohol wine by around 24% (Saliba et al., Reference Saliba, Ovington and Moran2013). Masson et al. (Reference Masson, Aurier and d'Hauteville2008) underline the disparity between sensory and nonsensory evaluations, and the negative expectations provoked by the nonsensory information: “low-alcohol content.” Hence, the adoption of new products involves uncertainty and risks.
This study examines how consumers categorize a new product (low-alcohol wine), according to whether information about its new attribute (low alcohol content) is acquired sensorily (blind tasting) or nonsensorily (written information). We can ascertain the category to which the new product is attributed and whether the choice of a category based on nonsensory information (concept definition) is the same as that based on sensory information (product experience).
II. Theoretical Framework
The evaluation of a product is influenced by existing knowledge about its attributes and the category. A new item is assigned to a cognitive category according to its similarity with the existing members, on the basis of a conscious or unconscious process (Hartman et al., Reference Hartman, Price and Duncan1990). Once categorized, the new item will benefit from the affect and knowledge developed toward the category, depending on its typicality or family resemblance with the category, that is, the degree to which it shares attributes in common with other members (Loken and Ward, Reference Loken and Ward1987; Nedungadi and Hutchinson, Reference Nedungadi and Hutchinson1985; Rosch and Mervis, Reference Rosch and Mervis1975). This transfer of attitudes and knowledge is illustrated in brand extension research, where it is shown that extension evaluation is positively related with brand evaluation, specifically when the extension is perceived to be close to the brand-based cognitive category (Bhat and Reddy, Reference Bhat and Reddy2001).
In the case of a food product, the perceived typicality is based on sensory or nonsensory experience (e.g., tasting experience and advertising information) and by comparing with different tastes usually encountered in the category. It follows the possibility that these two modes do not lead to the same categorization.
Our goal is to determine whether organoleptic qualities as well as information on a wine whose alcohol content is reduced take the new product (low-alcohol wine) out of the cognitive wine category. Research shows that these two types of information have a different influence on product evaluation (Lange et al., Reference Lange, Martin, Chabanet, Combris and Issanchou2002; Siret and Issanchou, Reference Siret and Issanchou2000). Under sensory conditions (blind tasting), it is shown that product evaluations are generally very close, whereas under nonsensory conditions (written information), there are greater disparities. This suggests that nonsensory information could be more discriminating than sensory information. Assimilation versus contrast theory can explain this result (Anderson, Reference Anderson1973; Schifferstein et al., Reference Schifferstein, Kole and Mojet1999). Based on the above considerations, we propose the following hypotheses:
H1a
The assignment of a new product to a cognitive category based on a sensory stimulus (blind tasting) is different from that one based on a nonsensory stimulus (written information).
H1b
A new product is perceived as more typical of its reference cognitive category after a nonsensory stimulus (written information) than after a sensory stimulus (blind tasting).
H2
Nonsensory information provided about an attribute of a new product will lead to larger deviations in typicality judgments than sensory information.
According to Love and Sloman (Reference Love and Sloman1995), innovation appears to be a continuous process resulting from the mutability of the attribute affected by the innovation, that is, involving the progressive appearance (or elimination) of a new (old) feature. Variation of an attribute considered central to category membership (wine alcohol content), which is therefore hardly mutable, can make it difficult to ensure that the new product continues to be classified in the reference category (wine). This difficulty might depend on the gap in comparison to the reference standard (11–13% alcohol for a red wine),Footnote 2 thus reflecting the ease with which acquired knowledge is transferred to new products. Therefore, we propose:
H3a
As more changes are made to a central attribute of the category, the new product will be less frequently assigned to its reference cognitive category, regardless of whether the information is given sensorily or nonsensorily.
H3b
As more changes are made to a central attribute of the category, the new product will be increasingly perceived as less typical of its reference cognitive category, regardless of whether the information is given sensorily or nonsensorily.
III. Methodology
Low-alcohol wine (which has some of its alcohol removed) is interesting because the alcohol content of wine has increased in recent decades, due to quality improvements or climatic conditions (Alston et al., Reference Alston, Fuller, Lapsley and Soleas2011; Conibear, Reference Conibear2006). At the same time, some consumers feel uncomfortable consuming wines with an alcohol content of 14% and above.
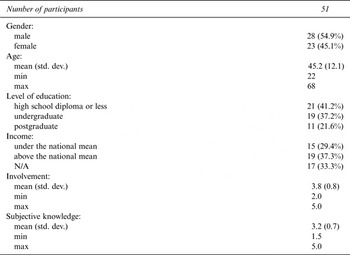
Participants in the experiment (n = 51) were recruited through advertisements placed in free newspapers. We studied only regular red wine consumers (“daily” or “almost daily”) because they had to be familiar with red wine to be able to taste numerous wine samples (i.e., to avoid sensory fatigue). Participants (45% female, average age 45 years) have a level of education and income slightly above average (Table 1). The level of involvement and subjective knowledge (measured using respectively Aurier and N'Gobo (Reference Aurier and N'Gobo1999) and Flynn and Goldsmith (Reference Flynn and Goldsmith1999) five-point Likert scales) are rather high. We used four products: a standard wine with alcohol content of 12.5% and three low-alcohol wines, with alcohol content of 9%, 6% and 0.2% (products that are currently on the market). The wines with alcohol content of 12.5% and 9% had a very similar level of quality and were selected by oenologists who indicated that almost the only difference between them is their alcohol content. The other two wines (alcohol content of 6% and 0.2%) exhibit the same typicityFootnote 3 but differ from each other and from the first two. They were selected in order to study a wide range of alcohol contents.
Sample Description

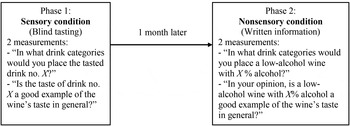
Each participant was exposed to two experimental conditions (Figure 1), referred hereafter as “sensory” or “nonsensory” (within-subject experimental design). The sensory part was based on a blind tasting of the four products. We asked the participants to indicate in which drink categories they would place the tasted drink and whether they thought that its taste was representative of wine. One month after this sensory phase, we asked the same participants the same questions under the nonsensory condition, that is, using only written information (without any tasting, only specifying the alcohol content of each product: “low-alcohol wine with 0.2%, 6%, 9% and 12.5% alcohol”).
Experimental Design

Under both conditions (sensory and nonsensory), the drink assignment to a category used a multiple choice question proposing: “wine,” “other wine-based drink,” “grape juice,” “premix,”Footnote 4 “new alcoholic drink,” or “new non-alcoholic drink.” Perceived typicality was assessed using a 100-millimeter unstructured scale anchored by “No, it is a bad example” and “Yes, it is a very good example” (Loken and Ward, Reference Loken and Ward1987).
On this basis, we obtained typicality judgments and assignment to a category based on sensory information (blind tasting) and then on nonsensory information (written information about the various alcohol contents), for the four drinks and using the same participants.
During the nonsensory phase, it should be noted that participants could not make connections with the sensory phase, since it was carried out blind and one month earlier. Therefore, they did not know that the same four wines were presented.
IV. Results
A. Comparisons Between Sensory and Nonsensory Stimulation
The subjects' task involved assigning the four drinks to one of the following categories: “wine,” “other wine-based drink,” “grape juice,” “premix,” “new alcoholic drink,” and “new nonalcoholic drink.” To make the results easier to read, we retained the “wine” category, which was of particular interest, and regrouped the others in “other alcoholic drinks” and “other nonalcoholic drinks.”
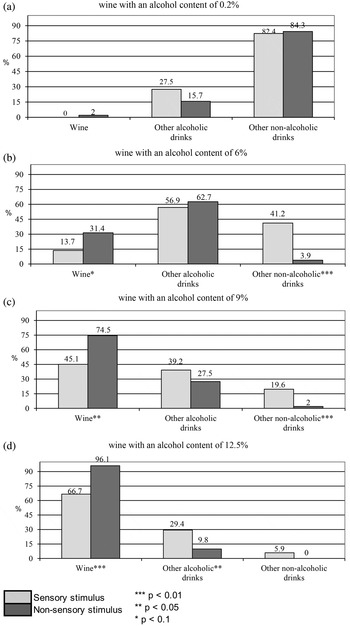
The categorizations are very similar for the 0.2% alcohol wine under sensory versus nonsensory conditions (percentages are not significantly different; see Figure 2a).
Assignment of Wines to the Drink Categories

The 6% alcohol wine generated greater differences (Figure 2b). Under sensory conditions, participants appeared to be perplexed, and their responses are divided between “other alcoholic drinks” (56.9%) and “other nonalcoholic drinks” (41.2%). Under nonsensory conditions, the words “6% alcohol” clearly encouraged participants to assign the product to alcoholic drink categories: 31.4% compared to 13.7% under sensory conditions. Similarly, 3.9% of participants placed the 6% alcohol wine in the “other nonalcoholic drinks” category under nonsensory conditions, compared to 41.2% under sensory conditions.
The 9% alcohol wine generated even greater differences (Figure 2c). Under nonsensory conditions, it was essentially assigned to the “wine” category: 74.5% compared to 45.1% in the sensory conditions, even though its organoleptic properties are similar to those of traditional wine. Similarly, under sensory conditions, 19.6% assigned it to the “other nonalcoholic drinks” category (even though it has an alcohol content of 9%!), compared to only 2% in the nonsensory conditions.
The 12.5% alcohol wine was categorized as “wine” by significantly fewer participants under sensory conditions (66.7%), compared to nonsensory conditions (96.1%) (Figure 2d).
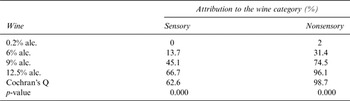
These results square with H1a: products are assigned to a cognitive category in a different way when using a sensory stimulus compared to a nonsensory stimulus. All the wines, except the one with an alcohol content of 0.2%, were assigned by significantly more participants to the “wine” category under nonsensory conditions (Figures 2a to 2d).
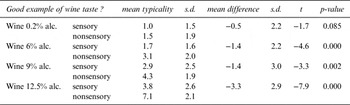
For all (four) products, we observe significant differences of perceived typicality under sensory versus nonsensory conditions (Table 2). For example, the 6% alcohol wine has a rating of 1.7 under sensory conditions, compared to 3.1 under nonsensory conditions. Wines with a lower alcohol content are perceived to be more typical of the “wine” category under nonsensory rather than sensory conditions, lending support to H1b.
Typicality Judgments
Student's t-test for paired samples

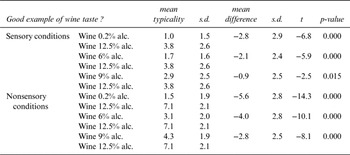
Table 3 suggests that the typicality deviations between the four products tend to be greater under nonsensory conditions. For example, the difference in typicality ratings between the wines of 0.2% alcohol and 12.5% alcohol is equal to 2.8 under sensory conditions, compared with 5.5 under nonsensory conditions. Nonsensory information appears to have a greater influence on typicality judgments, which is in line with H2.
Comparison Between Deviations in Typicality Judgments
(Student's t-test for paired samples)

B. Observation on Assignment of Products to Their Reference Cognitive Category
Table 4 shows that the lower the alcohol content of the wine is, the less likely it is to be assigned to the “wine” category, regardless of whether under sensory or nonsensory conditions. For example, under sensory conditions, the 0.2% alcohol wine was not assigned to the “wine” category by a single participant, whereas they were 7 for the 6% alcohol wine, 23 for the 9% alcohol wine and 34 for the 12.5% alcohol wine. This is in line with H3a: the more a core attribute of the category is modified (lower alcohol content), the less likely it is that the new product will be assigned to its reference cognitive category.
Comparison of Percentages of Assignment to the “Wine” Category
(Cochran's Q test for several linked samples and dichotomous variables)

Similarly, the lower the alcohol content of wine, the less likely it is to be considered typical of its cognitive reference category (“wine”). The average figure for typicality judgments decreases with alcohol content: 2.9 for the 9% alcohol wine, 1.7 for the 6% alcohol wine and 1 for the 0.2% alcohol wine under sensory conditions (Tables 3 and 5). This observation also applies to nonsensory conditions and supports H3b: the more a core attribute (one that is not easily changeable) is modified, the more likely the new product is to be perceived as atypical of its reference cognitive category.
Comparison Between Typicality Judgments for Low-Alcohol Wines and Traditional Wine
(sensory and nonsensory conditions; Student's t-test for paired samples)

V. Comments
Consumers do not assign products to the same cognitive category when responding to sensory (tasting) or nonsensory (indication of alcohol content) information. The question raised here was related to the uncertainties induced by the different ways of accessing identical information about a new product. Our results suggest that there is a risk of cognitive dissonance due to the association with an inappropriate product category, which can in turn lead to incorrect product evaluations and rejection. Nonsensory information is more informative and discriminatory than sensory information. The disconfirmation of expectations literature suggests that consumers perceive only small differences between products when tasting blind, compared to nonsensory information such as brand, geographic origin, production method (Lange et al., Reference Lange, Martin, Chabanet, Combris and Issanchou2002; Masson et al., Reference Masson, Aurier and d'Hauteville2008; Schifferstein et al., Reference Schifferstein, Kole and Mojet1999; Siret and Issanchou, Reference Siret and Issanchou2000; Tuorila et al., Reference Tuorila, Meiselman, Cardello and Lesher1998). A research on blended meat products shows that only 17% of the subjects correctly identified the dog food among the five samples after a blind tasting (Bohannon et al., Reference Bohannon, Goldstein and Herschkowitsch2009). In the same vein, half the participants in a triangle test were unable to distinguish the two wines (Weil, Reference Weil2007).
Even though consumers declare in surveys that it is not crucial in choosing wine (Aurier and N'Gobo, Reference Aurier and N'Gobo1999; Cohen et al., Reference Cohen, d'Hauteville and Sirieix2009; Goodman et al., Reference Goodman, Lockshin, Cohen, Fenterseifer, Ma, d'Hauteville, Sirieix, Orth, Casini, Corsih, Jaeger, Danaher, Brodie, Olsen, Thach and Perrouty2008), the alcohol content appears to be a central attribute of the wine category (and is not easily changeable). Yet, at the time of choosing, consumers hypothesize that the considered product contains the properties of the category. Our findings encourage future research on the cognitive processes at work under sensory conditions: perceptions are not unequivocal but are based on the interaction between many sensory mechanisms (Pangborn, Reference Pangborn1960).
This study has several limitations. The tested products represent a wide range of alcohol levels, and there must be certain sensitivity thresholds in terms of taste and psychological perceptions (the perceived difference between alcohol contents of 12% and 9% may not the same as the difference between alcohol contents of 9% and 6%). A narrower range of alcohol levels should be tested. Moreover, our participants knew that the experiment was related to wine: it would be interesting to provide no indication about the drink and use an open question to observe whether participants spontaneously assign low-alcohol wines to the wine category. However, due to French law, this was not possible. Furthermore, under sensory conditions, individuals are known to make categorization errors (Chollet et al., Reference Chollet, Lelièvre, Abdi and Valentin2011; Recchia et al., Reference Recchia, Monteleone and Tuorila2012; Urdapilleta et al., Reference Urdapilleta, Parr, Dacremont and Green2011; Wadhera and Capaldi, Reference Wadhera and Capaldi2012). Even expert judgments can be plainly flawed (Hodgson, Reference Hodgson2008, Reference Hodgson2009). This might explain why the 12.5% alcohol wine was assigned to the wine category by only 66.7% of participants, compared to 96.1% under nonsensory conditions.
From a managerial point of view, we suggest that manufacturers of food products ensure consistency between the nonsensory and sensory methods of accessing the information carried by their products. This could help avoid the disconfirmation of consumer expectations and the so-called contrast phenomenon (Anderson, Reference Anderson1973). Typicality judgment can be used to help choose the product position that will best allow it to be perceived as typical of its category. For instance, positioning low-alcohol wines in a new category (or subcategory) could help to clearly define this new concept and avoid the risk of poor evaluations due to comparisons with an inappropriate reference, that is, “traditional wine.”