INTRODUCTION
The common squid Loligo vulgaris Lamarck, 1798 is a commercially important species in the International Council for the Exploration of the Sea area, and is particularly valuable in the Portuguese market where it attains the highest first sale value of all finfish and mollusc species (Pilar-Fonseca et al., Reference Pilar-Fonseca, Campos, Afonso-Dias, Fonseca and Mendes2009). This long-finned squid is a fast-growing shallow water species found in the Mediterranean Sea and in the Atlantic Ocean from the North Sea (55°N) to the African coast (20°S). There is considerable geographical variability in life history traits across its distribution-range. The physiology of squid enables them to rapidly change their growth rates in response to environmental changes (O'Dor & Webber, Reference O'Dor and Webber1986; Jackson & Domeier, Reference Jackson and Domeier2003). This plasticity in growth results in squid changing their life-history features in accord with seasonal changes in their environment (e.g. L. gahi, Hatfield, Reference Hatfield2000; L. pealei, Brodziak & Macy, Reference Brodziak and Macy1996; Sepioteuthis lessoniana, Jackson & Moltschaniwskyj, Reference Jackson and Moltschaniwskyj2002; L. forbesi and L. vulgaris, Rocha & Guerra, Reference Rocha and Guerra1999).
In waters of the north-west Portuguese shelf, located within the Canary Current Upwelling System, L. vulgaris has two main spawning seasons, one in late autumn/winter and the other in late spring (Moreno et al., Reference Moreno, Pereira, Arvanitidis, Robin, Koutsoubas, Perales-Raya, Cunha, Balguerías and Denis2002), which results in two main hatching seasons (or cohorts) (Moreno et al., Reference Moreno, Dos Santos, Piatkowski, Santos and Cabral2009). Consequently, the early life stages of the two cohorts develop under very different environmental conditions. Previous studies have shown important differences between the so-called ‘cold cohort' and ‘warm cohort', namely in terms of age at maturity (Moreno et al., Reference Moreno, Pereira and Cunha2005), growth trajectories (Moreno et al. Reference Moreno, Azevedo, Pereira and Pierce2007), fecundity and egg size (Boavida-Portugal et al., Reference Boavida-Portugal, Moreno, Gordo and Pereira2010). The results of these studies, which analyse the effects of environmental conditions on the juvenile and adult phases, raised questions regarding the impact of such environmental factors (notably temperature) on growth during the early life stages of L. vulgaris in Portuguese waters.
Experiments in captivity have shown that the duration of the embryonic development of L. vulgaris is negatively correlated with temperature (Villanueva, Reference Villanueva2000a; Sen, Reference Sen2005a). At the same time, the weight, mantle and statolith length of newly hatched paralarvae are positively correlated with the duration of the embryonic development (Villanueva Reference Villanueva2000a, Reference Villanuevab). Salinity is another important environmental variable that may impose physiological limits on the embryonic development of cephalopods (Cinti et al., Reference Cinti, Barón and Rivas2004). Within the tolerance limits, lower salinity values have been reported to maximize the hatching success of L. vulgaris eggs and to produce larger hatchlings in captivity (Sen, Reference Sen2005b). However, embryo survival appears to be drastically reduced at salinities below 32 or above 38 and any large fluctuations in salinity may also be lethal for the eggs (Sen, Reference Sen2005b). Steer et al. (Reference Steer, Pecl and Moltschaniwskyj2003) demonstrated that larger hatchlings of Sepioteuthis australis within a given cohort have better survivorship than smaller hatchlings.
Post-hatching growth in length is usually described as exponential and is strongly correlated with temperature, with the initial growth rate ranging between 0.05 mm.d−1 at 11°C and 0.17 mm.d−1 at 19.2°C (Villanueva, Reference Villanueva2000b). As hypothesized by Forsythe (Reference Forsythe, Okutani, O'Dor and Kubodera1993), small changes in temperature during the early growth phase (90 days) of the life of a squid can result in marked differences in size-at-age.
Loligo vulgaris hatchlings range in size from 2 to 3 mm mantle length (ML) and are planktonic for at least 3 months (González et al., Reference González, Otero, Pierce and Guerra2010). Squid swim actively by jet propulsion as soon as they hatch, and fin beating plays only a minor role in the general locomotion (Boletzky, Reference Boletzky2003). In loliginids, the transition from the paralarval to the juvenile phase is not characterized by an abrupt morphological change (as in ommastrephids) or a marked habitat change (as in octopodids), yet involves important anatomical and physiological changes. There is an ontogenetic shift in the squid locomotory system, from the dominance of mitochondria-rich and fatigue-resistant muscle fibres, which power the jetting movements of paralarvae, to the use of mitochondria-poor muscle fibres for escape- and attack-jetting movements in the nektobenthic juveniles and adults, a shift which delivers the increased acceleration power required by larger individuals (Preuss et al., Reference Preuss, Lebaric and Gilly1997). The arrangement and volume of intramuscular collagen fibres of the outer tunic also changes during ontogeny, affecting the kinematics of mantle movement and elastic energy storage during jet locomotion (Thompson & Kier, Reference Thompson and Kier2001). In Loligo opalescens the relative proportion of the different types of muscle fibres typical of adults is achieved by 8 weeks post-hatching (Preuss et al., Reference Preuss, Lebaric and Gilly1997) and in Sepioteuthis lessoniana the organization and volume fraction of collagenous connective tissues of adult is achieved at 15 mm ML (Thompson & Kier, Reference Thompson and Kier2001).
Although squid paralarval growth and survival depend mainly on temperature and food availability in culture conditions (Vidal et al., Reference Vidal, DiMarco and Wormuth2002), in the wild, the faster the hatchlings grow the greater their chances of avoiding predation. As the duration of planktonic (jetting) paralarval phase (PLD, by analogy to fish) is apparently to some extent size-dependent, it will be indirectly dependent on water temperature. Therefore, the PLD of each L. vulgaris cohort is expected to be different, with implications for their survival.
Environmental changes and life cycle transitions affect individual metabolism and/or growth, and are thus recorded chronologically in the microstructure of calcified structures, such as the squid statoliths. The lack of resorption or alteration of the material deposited within the statoliths, allows features of their microstructure to be used as natural tags, as has been the case for fish otoliths (Campana & Neilson, Reference Campana and Neilson1985). Individual history can be analysed either visually (e.g. checks, increment width and contrast) or chemically (e.g. minor elements, trace elements and stable isotopes) (Arkhipkin, Reference Arkhipkin2005; Semmens et al., Reference Semmens, Pecl, Gillanders, Waluda, Shea, Jouffre, Ichii, Zumholz, Katugin, Leporati and Shaw2007). Villanueva (Reference Villanueva2000a, Reference Villanuevab) examined the statolith microstructure of L. vulgaris embryos and age-validated paralarvae (up to 60 days old), demonstrating the usefulness of these structures to reconstruct events during the early part of the squid life cycle in wild populations. Villanueva et al. (Reference Villanueva, Arkhipkin, Jereb, Lefkaditou, Lipinski, Perales-Raya, Riba and Rocha2003) went on to examine the part of the statolith corresponding to the embryonic stage and to make inferences about the ambient temperatures experienced during embryonic development in wild L. vulgaris populations.
Based on their results on ages of L. vulgaris paralarvae obtained from the wild, González et al. (Reference González, Otero, Pierce and Guerra2010) suggested that squid age may be underestimated by as much as 3 months when counting the increments in statoliths of adult specimens. Implicit in their conclusion was the idea that some increments corresponding to early growth become obscured as the squid becomes older.
Ontogenetic shifts have been identified in the statolith growth pattern of some squid species, apparently related to the transition from the paralarval stage to the juvenile stage (Arkipkin, 2005). The age at which a change is seen in the width of daily increments (i.e. the growth inflection) in fish otoliths is widely used as an indicator of the duration of the planktonic larval stage (Sponaugle, Reference Sponaugle2010). By analogy, analysis of the statolith accretion pattern could represent a useful tool to determine PLD in L. vulgaris.
In the present study we aim to provide a better understanding of recruitment processes in L. vulgaris in north-west Portuguese shelf waters, using juvenile and adult statoliths as records of early-life events. We ask two main questions: (1) what are the effects of temperature and salinity on embryonic and post-hatching growth in L. vulgaris?; and (2) is there evidence of a growth inflection in the statolith accretion pattern (i.e. the sequence of increment widths), which might represent the ontogenetic shift from planktonic to nektobentonic life and could thus represent a measure of the planktonic paralarval phase duration (PLD)? In addition, we examine evidence that statolith increments representing early growth become unreadable, resulting in underestimates of age, as proposed by González et al. (Reference González, Otero, Pierce and Guerra2010).
MATERIALS AND METHODS
Biological data
Juveniles and adults of L. vulgaris (ML ranging between 21 and 465 mm) were captured every month between January 1993 and March 2000 over the north-west Portuguese shelf, and their statoliths removed. To facilitate age readings, a transverse section of each statolith was obtained by grinding on both sides. Counts and measurements of increments were made on digitized mosaic images of statoliths, using the image analysis software TNPC 4.1 (Noesis). Prepared statoliths were screened to identify those in which the natal ring (the first prominent check, which is formed at hatching) was identifiable and the increments in the rostrum area were clearly visible. In addition we aimed to obtain adequate samples of squid living under distinct environmental conditions (>25 statoliths per hatching trimester, independently of hatching year). This led to a final selection of 161 statoliths. For each statolith 5 to 9 images, with slight changes of the focus plane, were used to build a mosaic, which guarantees that the final mosaic image allows correct interpretation of the statolith microstructure (avoiding two increments being interpreted as one or incorporation of sub-daily increments, etc.). The standardized procedures for age determination of squid using statoliths are detailed in Moreno (Reference Moreno2002).
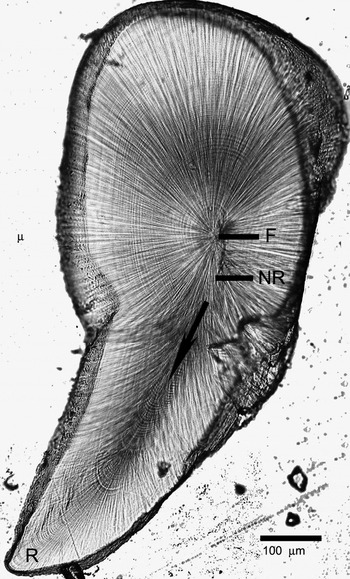
In each statolith (N = 161) the total number of increments was counted from the natal ring to the tip of the rostrum. Age was determined as the total number of increments, assuming that statolith increment deposition has a daily rhythm, as previously found in L. vulgaris paralarvae (Villanueva, Reference Villanueva2000b) and in cultured juveniles and adults of the subspecies L. vulgaris reynaudii (Durholtz et al., Reference Durholtz, Lipinski and Field2002). The hatching date of each individual was back-calculated as the capture date minus the age in days. The distance between the focus and the natal ring (Figure 1), i.e. the statolith radius at hatching measured along the rostrum (RH, mm), was used to estimate growth during the embryonic phase.
Light micrograph of a Loligo vulgaris statolith showing the focus (F), the natal ring (NR) and the growth axis where increments counting and measurements were made on the rostrum (R).

The statolith accretion pattern after hatching was analysed by measuring the maximum increment widths from the natal ring to the 126th increment (~18 weeks old) along the rostrum growth axis. At this stage the sample was reduced to 130 statoliths. Individuals younger than 126 days (incomplete record) and those in which the microstructure was not clear along the rostrum growth axis were not included.
The significant correlation between age, statolith size and dorsal mantle length in L. vulgaris suggests that somatic growth and statolith growth are related (Moreno et al., Reference Moreno, Azevedo, Pereira and Pierce2007), as in other squid species (Hatfield, Reference Hatfield2000). Therefore, measurements of the daily growth increments provide a measure of individual growth rates from hatching. The statolith growth in the first 3 months of life (R90d, mm) was estimated for each individual (N = 130) as the sum of the first 90 post-hatching increment widths. The choice of this number of days was based on the modelling of temperature effects on early growth by Forsythe (Reference Forsythe2004) and on the maximum age of L. vulgaris paralarvae recorded in plankton samples by González et al. (Reference González, Otero, Pierce and Guerra2010).
Temperature and salinity data
Average sea bottom temperature (SBTH) and bottom salinity (SBSH) were computed for the month before hatching of each individual. This was used as a proxy of the conditions for the duration of the embryonic phase, to test for effects on RH. Average sea surface temperature (SST) and average sea bottom temperature (SBT) were also computed for the first 30, 60 and 90 days post-hatching (SST30d, SST60d, SST90d, SBT30d, SBT60d and SBT90d), to test for effects on statolith growth during early life (R90d).
Sea bottom temperature and SBS data were obtained from CTD casts extracted from IPIMAR, NODC and ICES databases. Weekly (8 days) mean satellite-derived SST data were obtained from the AVHRR Pathfinder V.5 provided by NASA-JPL-Physical Oceanography Distributed Active Archive Center (PO.DAAC). These data were spatially averaged for a region over the Western Iberia continental shelf between 41.5° and 38.5°N and between the 35 m and 125 m isobaths using NOAA PMEL Ferret software.
Data analysis
We tested the proposal by González et al. (Reference González, Otero, Pierce and Guerra2010) that early increments are ‘lost' due to their close proximity to each other rendering them unreadable by calculating the relationship between the number of increments counted in the first 0.36 mm post-hatching (NIR1) and statolith size (hatching ring to the tip of rostrum, R), since we would expect a decrease in NIR1 as a function of (increasing) R if there was a loss of readable rings.
To explore the effect of temperature and salinity on growth during embryonic development and early life, generalized additive models (GAMs: Hastie & Tibshirani, Reference Hastie and Tibshirani1990) were fitted to RH and R90d data. Hatching year (Hyear) was included in models (as a nominal variable) to account for interannual differences unrelated to temperature or salinity. Histograms of the response variables were used as guidance to the appropriate family distribution and link function: a normal distribution seemed to be appropriate and an identity link function was therefore used. The assumptions of homogeneity of variance and normality (of the RH and R90d series) were verified, and data were checked for influential observations (Zuur et al., Reference Zuur, Ieno and Elphick2010). Bi-variate and multivariate collinearity between the explanatory variables were checked. Effects of explanatory variables were fitted as smoothers, using the thin plate regression spline method and limiting the number of ‘knots' (k) in the smoother by setting a maximum value of 5 (which limits degrees of freedom to 4 or less) to avoid fitting unrealistically complex relationship (i.e. to avoid overfitting). Smoothing parameters were estimated using generalized cross validation (GCV) (Gu & Wahba, Reference Gu and Wahba1991) subject to the above-mentioned constraint on k. To validate each model, residuals were checked for patterns and departures from normality.
A backwards selection process was used for the model of RH, starting with a full model (i.e. including all candidate explanatory variables: Hyear, SSTH, SBTH and SBSH) and sequentially removing explanatory variables with non-significant partial effects. There were very few observations for years 1995, 1997 and 1998 (N = 9 in total) and these were excluded to allow evaluation of interannual differences. For R90d, due to the larger number of candidate explanatory variables and the high collinearity of the different temperature series, a stepwise forwards procedure was carried out, fitting models sequentially with one, two and three explanatory variables, choosing the best model at each step as the building block for the subsequent step. In this case, post-hatching SST and SBT were included in models at different time lags (30, 60 or 90 days), to determine which time-lag had the strongest effect on R90d. For both SST and SBT, only one of the three possible time-lags could be included in the model (due to high collinearity in SST at different time-lags, as for SBT). Explanatory variables with non-significant partial effects were dropped from models. The Akaike information criterion (AIC) was used to choose the best fitting model (lowest AIC) for each response variable, subject to the other criteria mentioned previously.
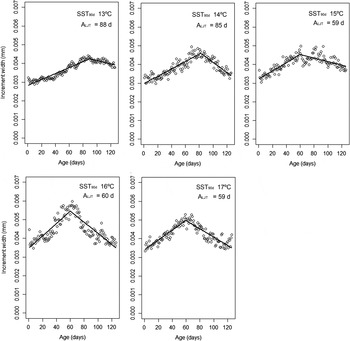
The statolith accretion pattern in the first 126 days of life (~18 weeks) was analysed to determine if the increment widths changed abruptly at a given age, which could be related to the age of the transition from paralarvae to juvenile (ALJT). To achieve this, the sample was split into 1°C SST90d classes (i.e. classes based on the explanatory variable with strongest effect on R90d), thus creating 5 classes (SST90d =13, 14, 15, 16 and >17°C). For each of these groups, a piecewise (segmented) linear regression (PLR) was fitted to the mean statolith increment width (IW) by age (A) data, to test the hypothesis that the data can be represented by two linear segments with different slopes, connected at ALJT:
 $$\eqalign{\hbox{IW} &={\rm \beta} _{\hbox{o}}+{\rm \beta} _{1}\hbox{A} \quad \hbox{when A} \,\,{\rm \le} \hbox{A}_{\hbox{LJT}}\cr \hbox{IW} &={\rm \beta} _{\hbox{o}}+{\rm \beta} _{1}\hbox{A}+{\rm \beta} _{2}(\hbox{A}-\hbox{A}_{\hbox{LJT}}) \quad \hbox{when A} \,\, {\rm \gt} \hbox{A}_{\hbox{LJT}}}$$
where βo is the intercept, β1 is the slope of the left linear segment, β2 is the difference in slopes, and ALJT is the breakpoint. The model parameters were estimated by means of simple iterative fitting of linear models as described in Muggeo (Reference Muggeo2003, Reference Muggeo2008). Smoothed scatter plots of the IW ~ A relationships (for each SST90d class) were used as a guide to setting appropriate starting values for ALJT. Wald-based 95% confidence intervals (CI 95%) were calculated for each parameter.
Computations and analyses were performed using R (2008, http://www.R-project.org) and the packages mgcv (Wood, Reference Wood2000) and segmented (Muggeo, Reference Muggeo2008).
RESULTS
Growth during the embryonic phase
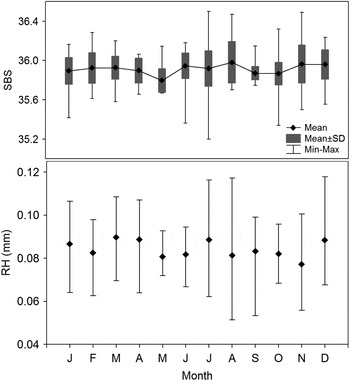
The statolith radius at hatching (RH), measured along the rostrum, ranged between 0.052 and 0.118 mm, with slight monthly variation (Figure 2). No significant bi-variate or multi-variate collinearity was found between possible explanatory variables, and weak correlations were seen between each explanatory variable and the response variable RH. These relationships were explored further with GAMs, using a Gaussian distribution with identity link. A full GAM model showed no significant effects of temperature, either SSTH or SBTH, on the statolith growth during the embryonic development (Table 1). The best-fit GAM explains about 16% of deviance and included effects of year and bottom salinity. It has the form:
 $$\hbox{RH}\sim 1 + \hbox{factor}(\hbox{Hyear}) + \hbox{s}(\hbox{SBS}_{\hbox{H}})$$
Monthly variation of the statolith rostrum size at hatching (RH) and sea bottom salinity (SBS).

Results for the generalized additive models fit to radius at hatching. Estimates, SE, t-ratio and associated parameters are given for the nominal variable Hyear (hatching year); 1992 is the reference Hyear. Edf, F statistic and associated probabilities are given for the smoother and for overall Hyear.

SE, standard error; Edf, estimated degrees of freedom; AIC, Akaike information criterion; ns, not significant.
A significantly larger statolith radius at hatching was seen in 1993 and 1994, compared to 1993 (Table 1). SBSH has a negative linear (partial) effect on RH. The model indicates faster embryonic statolith growth at lower salinities, although the relationship is clearest (confidence limits are narrowest) in the 35.75–35.95 range, i.e. where we have most data.
Growth during the first 3 months
In relation to the hypothesis of González et al. (Reference González, Otero, Pierce and Guerra2010), we found no significant relationship between the number of increments counted in the first 0.36 mm post-hatching (NIR1) and statolith size (hatching ring to the tip of rostrum, R). The slope parameter (b = 7.813) not only was not-significant (N = 126, r2 = 0.023, P = 0.0862), it was also not negative. We therefore assume that we did not underestimate the age of juvenile and adult specimens.
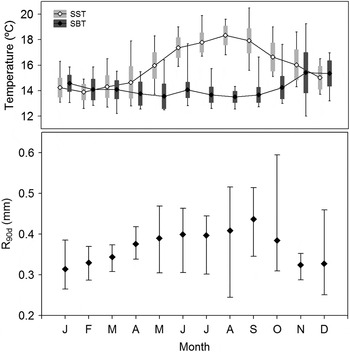
Seasonal variation can be observed in early statolith growth, with higher R90d seen in squid hatched in summer months (Figure 3). The SST variables at different time-lags were highly correlated with each other and this was also true for SBT. Therefore, a series of models was fitted, each including one of the SST or SBT variables, enabling us to determine which SST and which SBT had the strongest effects on R90d. Additionally, strong collinearity was verified between SST30d and SBT90d and between SST60d and SBT90d, and these pairs of variables were therefore not included in the same model. The models implemented with one, two and three explanatory variables and the criteria for the selection of the optimal set of explanatory variables are listed in Table 2. The best-fit GAM for R90d explains about 57% of deviance and has the form:
 $$\hbox{R}_{90\hbox{d}}\sim 1 + \hbox{factor}(\hbox{Hyear}) + \hbox{s}(\hbox{SST}_{90\hbox{d}}) + \hbox{s}(\hbox{SBT}_{90\hbox{d}})$$
Monthly variation of the statolith growth during the first 90 days post-hatching (R90d), sea surface temperature (SST) and sea bottom temperature (SBT). Dots represent the mean, the whiskers the size-range and the boxes the standard deviation.

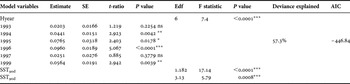
Results for the generalized additive models fit to R90d. Estimates, SE, t-ratio and associated parameters are given for the nominal variable Hyear (hatching year); 1992 is the reference hatching year. Edf, F statistic and associated probabilities are given for smoothers and for overall Hyear.
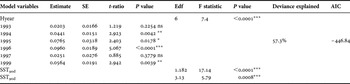
SE, standard error; Edf, estimated degrees of freedom; AIC, Akaike information criterion; ns, not significant.
Residuals were not exactly normally distributed although all other diagnostic plots indicated a good model fit. Transformation of R90d (e.g. square root or log) did not improve their distribution and we therefore continued with untransformed data. Ideally interaction terms should be tested. Indeed, inclusion of an interaction between the effects of SST90d and Hyear (by allowing separate smoothers for SST90d in each Hyear) improved goodness of fit (F test, P < 0.0001). However, there were insufficient data in some years to adequately describe the effect of temperature and we therefore present only the simpler model.
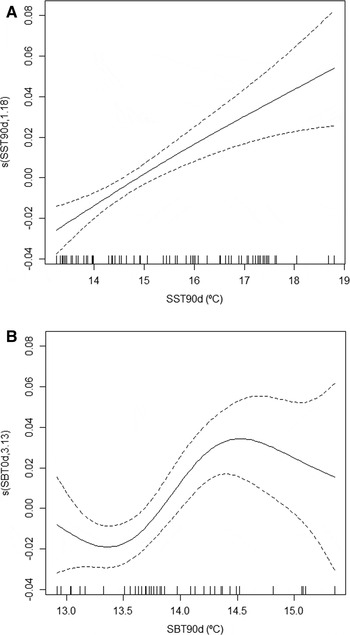
Inter-annual differences were detected and there was significantly higher statolith growth at 90 days post-hatching in squid hatched in 1994, 1995, 1996 and 1999 than in 1992 and 1993 (Table 2). The strongest effect of temperature on R90d was observed when considering temperatures (both SST and SBT) measured 90 days post-hatching. The partial effect of SST90d on R90d is positive and almost linear (df =1.2), indicating higher statolith growth during the early life under the highest SSTs (Figure 4A). Similarly, the partial effect of SBT90d is also positive, between 13.3 and 14.4°C, but shows a peak around 14.5°C, i.e. statolith growth during the first 90 days of life is fastest when SBT 90 days after hatching is around 14.5°C. Outside this range of SBT90d there were too few data to be confident about the form of the relationship, nevertheless the best fit for SBT is clearly non-linear (Figure 4B). The partial effect of SST90d on the post-hatching growth is stronger than that of SBT90d, consistent with paralarvae being pelagic.
Generalized additive model result: smoothing curve for partial effect of (A) sea surface temperature (SST90d) and (B) of sea bottom temperature (SBT90d) on the statolith growth during the first 90 days post-hatching (R90d). Dashed lines indicate 95% confidence intervals around the main effects.

Duration of the paralarvae stage
Analysis of the statolith accretion pattern in the first 126 days of life (~18 weeks) showed a similar pattern in all the different SST90d classes, with an increase in the increment width post-hatching to a maximum, followed by a decrease (Figure 5). Average statolith increment widths varied with temperature: increments are wider (faster growth) in squid living under higher temperatures (SST90d ≥ 16°C) and narrower (slower growth) in squid living under lower temperatures (SST90d ≤ 14°C). These differences are clearly seen during the first 90 days of post-hatching growth: statolith growth is generally slow during the first month after hatching and reaches a maximum after two to three months, depending on temperature. The ALJT values estimated from the break-point in the fitted segmented regressions were 85–88 days for squid which experienced SST90d < 15°C and 59–60 days for squid which experienced SST90d ≥15°C (Table 3).
Statolith growth pattern during the first 18 weeks post-hatching. Segmented regression models fitted to statolith increment width and squid age data for animals grouped by SST90d 1°C classes. Breakpoints for each relationship (ALJT) are highlighted.

Summary of parameter estimates for the segmented (piecewise) regressions (PLR) fitted to the statolith increment width pattern for each SST90d group.

ALJT, age of the transition from paralarvae to juvenile; CI (95%), Wald-based 95% confidence intervals; β1, slope of the left linear segment.
DISCUSSION
Previous work has highlighted the importance of the statoliths as chronological records of past events in the life of an animal (see Arkhipkin, Reference Arkhipkin2005 for a review). The periodic deposition of incremental bands of material with contrasting light properties not only allows determination of age but can also provide information on the environmental conditions experienced by the animal and on its physiological development (e.g. using the relative width and darkness of the bands). González et al. (Reference González, Otero, Pierce and Guerra2010) subsequently expressed concern that this record might be somewhat compromised by the occlusion of early incremental bands in adult statoliths. However, we found no evidence of ontogenetic change in the number of rings in the immediate vicinity of the natal ring, suggesting that rings are not lost.
Growth during the embryonic phase
The variability in the statolith size at hatching was weakly (but significantly) related to salinity and unrelated to temperature. There are several possible interpretations for this: it could be that most variation is not environmentally driven (Villanueva, Reference Villanueva2000a), that squid search for environmentally similar grounds on which to lay their eggs (Villanueva et al., Reference Villanueva, Arkhipkin, Jereb, Lefkaditou, Lipinski, Perales-Raya, Riba and Rocha2003), that temperature and salinity were not measured at a sufficiently small spatial or temporal scale to be directly relevant to the individual squid, and/or that most variation is due to other environmental factors that were not considered in the GAMs.
Our results showed that lower salinity values tend to produce larger statoliths, similarly to the findings of Sen (Reference Sen2005a) for hatchlings in captivity. There is very limited information concerning the effect of salinity changes on embryos of squids. Nevertheless, within their tolerance limits, marine animals living in lower salinities spend less energy for osmoregulation and therefore have more energy for somatic growth (Boeuf & Payan, Reference Boeuf and Payan2001).
The interaction between the positive influence of temperature on statolith growth rate (Villanueva, Reference Villanueva2000b) and its negative influence on embryonic development duration (e.g. Sen, Reference Sen2005a), could have balanced the statolith size at hatching under cold versus warm conditions and thus masked any temperature effects. On the other hand, the low amount of variability in statolith size at hatching in our study can be an indication that most of the squid sampled spent the egg stage at rather constant conditions of temperatures and salinity. Relatively stable sea bed environmental conditions for egg laying are found between 35 and 125 m throughout the year. In this zone, mean monthly bottom temperatures vary between 13.5 and 15.4°C (Figure 3) and extreme variations in bottom salinity are episodic (Figure 2). Inshore of the 35 m isobath, salinity may be quite variable and will sometimes reach lethal levels due to rainfall and river runoff. It is therefore plausible that squid search for environmentally similar (and environmentally stable) spawning grounds, as suggested by Villanueva et al. (Reference Villanueva, Arkhipkin, Jereb, Lefkaditou, Lipinski, Perales-Raya, Riba and Rocha2003).
Growth during the first 3 months and the duration of the paralarvae stage
The western Portuguese coast is in the northernmost part of the Canary Current Upwelling System. Here, upwelled cold deep water moves onto the shelf, usually from April to October and more intensely from June to August (Wooster et al., Reference Wooster, Bakun and McLain1976). Given this, the seasonality of ocean temperature over the shelf is quite different from the pattern seen in non-upwelling areas at the same latitude. Since temperature has been described as the main abiotic factor influencing loliginid statolith growth during early life stages under experimental conditions in captivity (Villanueva et al., Reference Villanueva, Moltschaniwskyj and Bozzano2007), we modelled effects of temperature, both SST and SBT, on the post-hatching growth. The results of the present study confirm the significant influence of temperature on the early life stages of wild L. vulgaris. A higher correlation was detected between statolith growth and SST than between statolith growth and SBT. This is consistent with the fact that the paralarvae are essentially planktonic and thus SST should be a better predictor of early growth. Nevertheless, some influence of SBT was also expected because paralarvae are found near the bottom during part of the day (Moreno et al., Reference Moreno, Dos Santos, Piatkowski, Santos and Cabral2009). Because SBT decreases during the upwelling season (spring–summer) and increases after its end, while SST increases from winter to summer (although less than expected owing to upwelling) (Figure 3), there are differences in the seasonal patterns of SBT and SST, modulated by upwelling, and thus the influence of temperature on growth is described by a complex model with an almost linear effect of SST and a non-linear effect of SBT.
Inspection of the statolith accretion pattern revealed an inflection point in the increment widths occurring at 60–90 days post-hatching. This age corresponds to the occurrence of important anatomical changes in the mantle muscles in other loliginids (Preuss et al., Reference Preuss, Lebaric and Gilly1997; Thompson & Kier, Reference Thompson and Kier2001), which mark the end of paralarval swimming characteristics. We therefore tentatively propose that this represents a measure of the duration of the paralarval stage, while recognizing that further verification is needed. In relation to the timing of this growth inflection (and regardless of its biological significance), there were differences of the order of 1 month between squids living at SST90d < 15°C and at SST90d ≥ 15°C. This difference of up to ~1 month is quite significant considering the short (~1 year) life span of the squid (Moreno et al., Reference Moreno, Azevedo, Pereira and Pierce2007). We therefore argue that these observations justify viewing the squid population as comprising a cold cohort with slower early growth and a longer planktonic paralarval phase, and a warm cohort with a faster early growth and a shorter planktonic phase.
The western Portuguese coast is characterized by optimum conditions for phytoplankton blooms and consequent high zooplankton abundance (Arístegui et al., Reference Arístegui, Álvarez-Salgado, Barton, Figueiras, Hernández-León, Roy, Santos, Brink and Robinson2006). On the north-west coast, the zooplankton biomass is high from April until November (Cunha, Reference Cunha2001). Therefore, L. vulgaris individuals from the warm cohort which comprise the second peak of paralarval abundance over the course of the year (in August: Moreno et al., Reference Moreno, Dos Santos, Piatkowski, Santos and Cabral2009) live in the plankton during a period of very high prey density. This high prey abundance can, in turn, fuel the higher metabolic demands of the warm season. Higher growth rates will allow these individuals to acquire the full flexibility and fine coordination of the locomotory system at a younger age. Thus, the life strategy of this cohort potentially favours its own survival by reducing the duration of the more vulnerable planktonic phase. This of course begs the question of why there is a second annual cohort (the cold cohort). There may also be selective advantages to this alternative life-cycle strategy (assuming that there is some genetic component to the seasonality of spawning) or the separation into two cohorts may be an unavoidable environmentally driven consequence of the life cycle biology—see Boyle et al. (Reference Boyle, Pierce and Hastie1995) for discussion of this theme in relation to Loligo forbesii.
Otoliths are frequently used to determine the timing and duration of ontogenetic events in fish (Sponaugle, Reference Sponaugle2010) but statolith increment widths have seldom been used to determine the duration of a cephalopod life-cycle stage (e.g. Arkhipkin, Reference Arkhipkin2004). We investigated the possibility of using statoliths as an alternative way to estimate the transition from paralarva to juvenile (PLD) because there is still no precise morphological or ecological definition for this transition in loliginids. By using piecewise linear regression (PLR), we found a very clear breakpoint in the growth pattern, with differences at a cohort level.
There is a need to study other morphological indicators in the early life stages of squid, such as changes in the allometric growth of some body parts and modifications in the mantle musculature, to see whether they are related to the timing of the breakpoint in the statolith increment pattern. The estimation of breakpoints in the growth trajectories of morphologic characters in some squid species has proved useful to relate ontogenetic shifts with rapid ecological changes (Shea & Vecchione, Reference Shea and Vechione2002).
Life-history strategy and climate change
The significant effect of hatching year on RH and R90d provided an indication of some additional environmental influence not captured by the environmental variables included in the model. This influence may still be related to temperature to some extent, since colder years (1992–1994) could be correlated to larger size at hatching and lower post-hatching growth, in opposition to the effects of the following warmer years. Nevertheless, inter-annual variation in other environmental/biological conditions (e.g. prey density) may also have an important role in early growth, which may in turn affect mortality rates and consequent cohort survival and recruitment.
Under a scenario of global warming, our results suggest that squid will experience a shorter paralarval stage, undergo faster growth, and mature younger and at a smaller size, similar to the warm cohort life strategy. This would apparently ultimately enhance survival, and favour recruitment and rapid turnover of the local L. vulgaris population, as well as of other inshore squid populations. However, while this could be viewed as a beneficial effect of climate change, the situation is probably far more complicated. At an individual level, elevated temperatures pose limitations to individual metabolism, namely concerning oxygen and food requirements (Pecl & Jackson, Reference Pecl and Jackson2008). At the population level, density may increase to the point that density-dependent effects (e.g. increased intraspecific competition, higher levels of predation) come into play.
ACKNOWLEDGEMENTS
We are grateful to Pedro Mendonça for assistance with the biological sampling and to Professor Henrique Cabral for his helpful comments on the draft manuscript. Samples were obtained under the PNAB/DCF framework. This study was partially supported by the project LongUp (PTDC/AAC-CLI/105296/2008) funded by FCT. G.J.P. acknowledges support from the ANIMATE project (MEXC-CT-2006-042337). We also thank two anonymous referees for their comments on the previous version of this paper.