




1 Introduction
Dense gases (DGs) have been widely studied during the past forty years because of their increasing use as working fluids in organic Rankine cycles (ORCs), which collect heat from low-temperature heat sources (solar, geothermal, biomass combustion, etc.) in order to produce electricity. Using DGs in ORC power plants has many benefits (lower operating pressure, reduction of blade corrosion, large heat capacities, etc.), the main one being the lower boiling temperature compared with water, which enables operation with targeted lower-temperature heat sources. For comparable reasons, DGs are also used in Stirling engines (Invernizzi Reference Invernizzi2010), hypersonic and supersonic wind tunnels (Wagner & Schmidt Reference Wagner and Schmidt1978; Anders, Anderson & Murthy Reference Anders, Anderson and Murthy1999) and chemical transport and processing (Kirillov Reference Kirillov2004).
Dense gases are single-phase vapours characterized by long chains of carbon atoms and by a medium to large molar mass. In the vicinity of the critical point, DGs exhibit an unusual behaviour compared with classical gases. In this study, specific DGs called Bethe–Zel’dovich–Thompson (BZT) gases are considered. The name BZT was given by Cramer (Reference Cramer1991) to acknowledge the pioneering works of Bethe (Reference Bethe1942), Zel’dovich (Reference Zel’dovich1946) and Thompson (Reference Thompson1971) on these gases which are also widely used in industry. Examples of BZT gases include hydrocarbons, perfluorocarbons and siloxanes. The BZT gases display an ‘inversion zone’, that is, a thermodynamic region where the fundamental derivative of gas dynamics becomes negative ( $\unicode[STIX]{x1D6E4}<0$).
The fundamental derivative of gas dynamics was introduced by Hayes (Reference Hayes and Emmons1958), and then rewritten by Thompson (Reference Thompson1971) as
 $$\begin{eqnarray}\unicode[STIX]{x1D6E4}=\left.\frac{v^{3}}{2c^{2}}\frac{\unicode[STIX]{x2202}^{2}p}{\unicode[STIX]{x2202}v^{2}}\right|_{s}=\left.\frac{c^{4}}{2v^{3}}\frac{\unicode[STIX]{x2202}^{2}v}{\unicode[STIX]{x2202}p^{2}}\right|_{s}=1+\left.\frac{\unicode[STIX]{x1D70C}}{c}\frac{\unicode[STIX]{x2202}c}{\unicode[STIX]{x2202}\unicode[STIX]{x1D70C}}\right|_{s},\end{eqnarray}$$
where  $v$ is the specific volume,
 $\unicode[STIX]{x1D70C}$ the density,
 $c=\sqrt{\unicode[STIX]{x2202}p/\unicode[STIX]{x2202}\unicode[STIX]{x1D70C}|_{s}}$ the speed of sound,
 $p$ the pressure and
 $s$ the entropy. The term ‘fundamental’ emphasizes the importance of
 $\unicode[STIX]{x1D6E4}$ in the determination of the nonlinear behaviour of DGs. This physical quantity is a measure of the rate of change of the speed of sound in an isentropic transformation. It is directly related to the curvature of isentropic curves in the
 $p$–
 $v$ diagram
 $(\unicode[STIX]{x2202}^{2}p/\unicode[STIX]{x2202}v^{2}|_{s})$.
There are three main regimes depending on the value of the fundamental derivative:
(i) Regime
 $\unicode[STIX]{x1D6E4}>1$ corresponds to classical ideal gas behaviour. For thermally and calorically perfect gases, the fundamental derivative is a constant and given by $\unicode[STIX]{x1D6E4}=(\unicode[STIX]{x1D6FE}+1)/2$.
(ii) Regime
$0<\unicode[STIX]{x1D6E4}<1$ corresponds to classical non-ideal gas behaviour. In this regime, the speed of sound decreases in isentropic compressions $(\unicode[STIX]{x2202}c/\unicode[STIX]{x2202}\unicode[STIX]{x1D70C}|_{s}<0)$.(iii) Regime
$\unicode[STIX]{x1D6E4}<0$ corresponds to non-classical behaviour referred to as the BZT effect. It is a narrow region in the $p$–$v$ diagram as shown in figure 1. In that zone, because of the negative sign of the fundamental derivative, rarefaction shock waves can occur.


The initial thermodynamic state and its evolution over time are represented in the non-dimensional  $p$–
 $v$ diagram for FC-70. The DG zone (
 $\unicode[STIX]{x1D6E4}<1$) and the inversion zone (
 $\unicode[STIX]{x1D6E4}<0$) are plotted for the Martin–Hou equation of state. Parameters
 $p_{c}$ and
 $v_{c}$ are, respectively, the critical pressure and the critical specific volume. The initial value of the fundamental derivative of gas dynamics is
 $\unicode[STIX]{x1D6E4}_{initial}=-0.284$. The normalized distribution of thermodynamic states at
 $\unicode[STIX]{x1D70F}=1700$ (beginning of the self-similar period) is coloured along the corresponding adiabatic curve.

Bethe (Reference Bethe1942) and Zel’dovich (Reference Zel’dovich1946) were the first to justify this possible occurrence of expansion shock waves in BZT flows. Such unusual features can only be modelled when using a sufficiently complex equation of state (EoS). The simplest EoS enabling the prediction of expansion shock waves is the van der Waals EoS. In the vicinity of the critical point, the isothermal curves (for example the critical one) display a negative curvature (concave), so that  $\unicode[STIX]{x2202}^{2}p/\unicode[STIX]{x2202}v^{2}|_{T}<0$. Using one of Maxwell’s relations:
 $$\begin{eqnarray}\left.\frac{\unicode[STIX]{x2202}T}{\unicode[STIX]{x2202}v}\right|_{s}=-\left.\frac{\unicode[STIX]{x2202}p}{\unicode[STIX]{x2202}s}\right|_{v}=-\left.\frac{\unicode[STIX]{x2202}p}{\unicode[STIX]{x2202}T}\right|_{v}\left.\frac{\unicode[STIX]{x2202}T}{\unicode[STIX]{x2202}s}\right|_{v}=-\frac{\left.{\displaystyle \frac{\unicode[STIX]{x2202}p}{\unicode[STIX]{x2202}T}}\right|_{v}}{\left.{\displaystyle \frac{\unicode[STIX]{x2202}s}{\unicode[STIX]{x2202}T}}\right|_{v}}=-\frac{T}{c_{v}}\left(\frac{\unicode[STIX]{x2202}p}{\unicode[STIX]{x2202}T}\right)_{v}\end{eqnarray}$$
justifies that if the heat capacity is large ( $c_{v}\gg 1$), the isentropic curves will follow the isothermal ones
 $(\unicode[STIX]{x2202}T/\unicode[STIX]{x2202}v|_{s}\ll 1)$. Colonna & Guardone (Reference Colonna and Guardone2006) provided further explanations using an advanced molecular study of forces at stake, depending on the molecular complexity. They showed that the minimum molecular complexity that must be reached in a gas in order to fulfil the BZT gas conditions is
 $N>N^{BZT}=33.33$, with
 $N$ being the molecular complexity corresponding to the number of active degrees of freedom of the molecule (Colonna & Guardone Reference Colonna and Guardone2006).
Many researchers have studied the non-classical phenomena occurring in (BZT) DGs, such as rarefaction shock waves, by considering at first the fluid as inviscid (Cramer & Kluwick Reference Cramer and Kluwick1984; Menikoff & Plohr Reference Menikoff and Plohr1989; Rusak & Wang Reference Rusak and Wang1997; Wang & Rusak Reference Wang and Rusak1999; Congedo, Corre & Cinnella Reference Congedo, Corre and Cinnella2007, Reference Congedo, Corre and Cinnella2011). Adding viscosity effects enabled the study of boundary layers and shock–boundary layer interactions (Cramer & Crickenberger Reference Cramer and Crickenberger1991; Cramer & Park Reference Cramer and Park1999; Fergason & Argrow Reference Fergason and Argrow2001; Kluwick Reference Kluwick2004). Conclusions show the benefits of using DGs in ORC turbines since, when operating in the dense gas region ( $0<\unicode[STIX]{x1D6E4}<1$) at transonic regime, DG effects reduce friction drag and boundary layer separation (Cinnella & Congedo Reference Cinnella and Congedo2007). Also, when the expansion operates within the inversion region (
 $\unicode[STIX]{x1D6E4}<0$), shock intensity decreases and entropy losses are reduced.
From an experimental viewpoint, it is very difficult to observe rarefaction shock waves because of the vicinity of the critical point where physical quantities experience strong variations. Borisov et al. (Reference Borisov, Borisov, Kutateladze and Nakoryakov1983) and Kutateladze, Nakoryakov & Borisov (Reference Kutateladze, Nakoryakov and Borisov1987) claimed to have experimentally observed rarefaction shock waves. However, their results were questioned by Cramer & Sen (Reference Cramer and Sen1986) and Fergason et al. (Reference Fergason, Ho, Argrow and Emanuel2001) who showed that the fluid used in the experiment (F-13, CClF $_{3}$) does not satisfy the Thompson & Lambrakis (Reference Thompson and Lambrakis1973) requirements and concluded that the observed shock wave was not a single-phase rarefaction shock wave.
Since then, works of Fergason et al. (Reference Fergason, Ho, Argrow and Emanuel2001), Colonna et al. (Reference Colonna, Guardone, Nannan and Zamfirescu2008), Spinelli et al. (Reference Spinelli, Dossena, Gaetani, Osnaghi and Colombo2010) and Spinelli et al. (Reference Spinelli, Pini, Dossena, Gaetani and Casella2013) enabled the design of shock tubes and test rigs, such as the Test Rig for Organic Vapors (TROVA) at Politecnico di Milano or the Flexible Asymmetric Shock Tube (FAST) built at Delft University of Technology (Mathijssen et al. Reference Mathijssen, Gallo, Casati, Nannan, Zamfirescu, Guardone and Colonna2015). The experimental proof of rarefaction shock waves remains an active research area.
From a numerical viewpoint, Argrow (Reference Argrow1996) was the first to perform a numerical simulation of a single-phase DG inviscid flow in a shock tube. This pioneering work on the simulation of inviscid DG flows was followed by contributions of Monaco, Cramer & Watson (Reference Monaco, Cramer and Watson1997), Brown & Argrow (Reference Brown and Argrow1998), Colonna & Rebay (Reference Colonna and Rebay2004) and Cinnella & Congedo (Reference Cinnella and Congedo2005) with the simulation of inviscid DG flows over airfoils or turbine cascades. Cinnella & Congedo (Reference Cinnella and Congedo2007) performed for the first time DG simulations for laminar and turbulent external flows over airfoils and flat plates using Reynolds-averaged Navier–Stokes equations with the simple algebraic model of Baldwin and Lomax in the latter case. Harinck et al. (Reference Harinck, Turunen-Saaresti, Colonna, Rebay and van Buijtenen2010b), Wheeler & Ong (Reference Wheeler and Ong2013) and From et al. (Reference From, Sauret, Armfield, Saha and Gu2017) subsequently achieved simulations of turbulent DG flows using, respectively,  $k$–
 $\unicode[STIX]{x1D700}$ and
 $k$–
 $\unicode[STIX]{x1D714}$ two-equation models, Spalart–Allamaras one-equation model and an explicit algebraic Reynolds stress model. Dura Galiana, Wheeler & Ong (Reference Dura Galiana, Wheeler and Ong2016) also performed large-eddy simulations (LES) of turbulent DG flow over a turbine vane using the Smagorinsky–Lilly model. Up to now, the closure of the Reynolds-averaged Navier–Stokes equations or the filtered Navier–Stokes equations originally established for ideal gas flows has been implicitly extended to turbulent DG flows. It can be argued that the peculiar thermodynamic behaviour of DGs, in particular BZT gases, questions the validity of this extension. Yet, the lack of experimental data makes the verification of the presently used turbulence models a complex task. Note that the influence of the thermodynamic models on the numerical prediction of DG flows is also an issue that has been investigated by several authors (e.g. Harinck et al. Reference Harinck, Colonna, Guardone and Rebay2010a; Merle & Cinnella Reference Merle and Cinnella2014) and suffers from the same lack of reference experimental data. In the present study, the Martin–Hou (MH) EoS will be retained since it has been established that it provides an accurate representation of DG thermodynamic behaviour (Guardone, Vigevano & Argrow Reference Guardone, Vigevano and Argrow2004).
The tool of choice to be used in order to assess the potential specificities of turbulence in a DG flow is direct numerical simulation (DNS), which enables the resolution of every turbulent scale, from the largest swirls (limited by the size of the domain) to the smallest ones (limited by the Kolmogorov scale), and thus gives access to the flow physics without resorting to any turbulent closure model. Because the number of degrees of turbulence grows faster than  $O(Re^{11/4})$ (Garnier, Adams & Sagaut Reference Garnier, Adams and Sagaut2009), DNS remains naturally confined to simple flow configurations. For larger and more complex systems, LES is a tool of choice since it resolves large turbulent scales and models the small ones. However, as already mentioned, it relies on subgrid models which have been tailored for turbulent flows of ideal gases so that their validity for DGs is also questionable.
At the present time, few authors have achieved DNS of DG flows. Giauque, Corre & Menghetti (Reference Giauque, Corre and Menghetti2017) have performed a DNS of decaying homogeneous isotropic turbulence (HIT) and concluded that the standard Smagorinski subgrid-scale (SGS) model does not capture correctly the temporal evolution of the turbulent kinetic energy (TKE) by comparing the LES prediction with the DNS reference results. The DNS also evidenced localized flow regions with strongly positive values for the velocity divergence that could correspond to expansion shock waves.
Sciacovelli et al. (Reference Sciacovelli, Cinnella, Content and Grasso2016) have also studied the large-scale dynamics in decaying HIT, assuming at first an inviscid DG. They evidenced strong differences of the fluctuation levels for thermodynamic quantities (density, pressure, sound speed) between the perfect gas (PG) and the DG. They pointed out the more symmetric probability density function of the velocity divergence in the DG flow. Their DNS results display flow regions with strong expansions and tubular structures unlike the compression regions which are characterized by sheet-like structures. The more symmetric distribution could be explained by the presence of expansion shock waves.
Sciacovelli, Cinnella & Grasso (Reference Sciacovelli, Cinnella and Grasso2017b) next extended their previous decaying HIT study by considering viscous effects and focused then on the small-scale dynamics. Two different initial states were selected for the DG: one inside the inversion region and one outside. It was observed that the global flow dynamics is almost not influenced by local events such as expansion shock waves. The nature of turbulent structures was also discussed based on DNS results. The formation of convergent compressed structures like compression shock waves is strongly reduced in the BZT zone. The occurrence of non-focal convergent structures in the DG diminishes the vorticity and counterbalances enstrophy destruction.
Sciacovelli, Cinnella & Gloerfelt (Reference Sciacovelli, Cinnella and Gloerfelt2017a) achieved the DNS of a supersonic DG flow in a channel. Significant differences from a supersonic ideal gas channel flow were observed for some thermodynamic variables. For instance, the temperature is lower at the centreline for the DG and the DG flow can actually be considered quasi-isothermal contrary to the PG flow. Characteristics of the DG flow have been found to be close to those of flow of variable-property liquids. Regarding turbulence development, the authors did not notice significant differences between the PG and the DG. The Reynolds stresses and the non-dimensional streamwise and spanwise lengths of the structures are found to be nearly the same.
So far, no DNS of a DG compressible mixing layer has been reported in the literature. Performing such a DNS enables a better understanding of DG behaviour in a simple configuration which is also representative of a flow configuration occurring inside an ORC turbine. While the decaying HIT can be seen as representative of a small flow region in the inter-blade space, the mixing layer would be representative of the blade wake region. Also, the speed of sound in a DG being likely to be much lower (up to 10 times lower) than in a usual gas such as air, the Mach number characterizing the DG compressible mixing layer can become large. A review of the literature has been performed in order to select a reference ideal gas compressible mixing layer at a large Mach number and also to identify some key results regarding the compressible mixing layer of an ideal gas, with which the DG DNS results will be confronted.
Mixing layer studies belong to a long-term research programme on the characterization of turbulence. Turbulent mixing layers appear in many physical domains and industry problems. The very first investigation of turbulent mixing layers was performed by Liepmann & Laufer (Reference Liepmann and Laufer1947) who demonstrated the self-preserving feature of such flows. Subsequently, many experimental investigations were conducted on turbulent mixing layers, especially for aeronautic purposes, such as scram-jet engines and abatement of supersonic jet noise.
Quickly, compressibility effects proved to be a key point in high-speed mixing layer flows. Bogdanoff (Reference Bogdanoff1983) introduced the concept of the convective Mach number, taking into account not only the velocity and sound speed of each stream of the mixing layer but also a combination of them. Denoting  $U_{i}$ and
 $c_{i}$, respectively, as the flow speed and the sound speed of stream
 $i$ (upper or lower) of the mixing layer, the convective Mach number is defined as
 $$\begin{eqnarray}M_{c}=(U_{1}-U_{2})/(c_{1}+c_{2})=\unicode[STIX]{x0394}u/(c_{1}+c_{2}).\end{eqnarray}$$
The convective Mach number provided the community with a similar comparative scale when comparing different configurations. A consensus appeared on the reduction of the mixing layer growth rate when increasing the convective Mach number (Bradshaw Reference Bradshaw1977; Papamoschou & Roshko Reference Papamoschou and Roshko1988).
Further studies were conducted in order to capture the key parameters allowing a better understanding of the fundamental mechanisms at stake. Brown & Roshko (Reference Brown and Roshko1974) investigated density effects using two different gases and thoroughly analysed turbulent structures to conclude that density effects are far less prominent than compressibility effects. Although the mixing layer flow configuration appears rather simple, Bradshaw (Reference Bradshaw1966) showed that initial conditions and technical difficulties with the experimental realization of the flow are the main sources of the discrepancies observed between published results.
The first DNS of a compressible mixing layer was performed by Sandham & Reynolds (Reference Sandham and Reynolds1990), followed by Luo & Sandham (Reference Luo and Sandham1994), Vreman, Sandham & Luo (Reference Vreman, Sandham and Luo1996), Freund, Lele & Moin (Reference Freund, Lele and Moin2000), Pantano & Sarkar (Reference Pantano and Sarkar2002), Fu & Li (Reference Fu and Li2006), Zhou, He & Shen (Reference Zhou, He and Shen2012), Martínez Ferrer, Lehnasch & Mura (Reference Martínez Ferrer, Lehnasch and Mura2017) and Dai et al. (Reference Dai, Jin, Luo and Fan2018). These DNS of compressible mixing layers assume the fluid behaves like an ideal gas. They all confirm that the spreading rate decay is due to a lower turbulent production (Sarkar Reference Sarkar1995). The compressible TKE equation includes additional terms with respect to its incompressible formulation, namely compressible dissipation and pressure–dilatation terms. Key questions, seemingly related, are why turbulent production decreases and how these additional terms evolve with an increasing convective Mach number.
Zeman (Reference Zeman1990) and Sarkar et al. (Reference Sarkar, Erlebacher, Hussaini and Kreiss1991) predicted that the dilatational part of the dissipation increases with the turbulent Mach number ( $M_{t}=\sqrt{\overline{u_{i}^{\prime }u_{i}^{\prime }}}/c$, where
 ${u_{i}}^{\prime }$ represents the fluctuating velocity in direction
 $i$) because of the occurrence of eddy shocklets. They proposed a modelling of this term that captures the growth rate reduction as the Mach number increases. However, Vreman et al. (Reference Vreman, Sandham and Luo1996) and Freund et al. (Reference Freund, Lele and Moin2000) suggested that the proposed model is not realistic since eddy shocklets at that time had not yet been observed in three-dimensional DNS with a convective Mach number below one. Subsequently, Zhou et al. (Reference Zhou, He and Shen2012) observed shocklets in their three-dimensional simulation for a convective Mach number of 0.7. Although eddy shocklets may occur in the compressible mixing layer for a convective Mach number as low as 0.7, the compressible dissipation term remains small as shown by Pantano & Sarkar (Reference Pantano and Sarkar2002) for a convective Mach number of 1.1 and below. We will see that this observation is confirmed by the present simulations. Considering a DG instead of an ideal gas should even further reduce this dissipation term since entropy jumps across shocklets are reduced within the inversion region.
The pressure–dilatation term is formed from the sum of the pressure–strain rate correlations. It is negligible if compared with the most important terms of the TKE equation (Vreman et al. Reference Vreman, Sandham and Luo1996; Freund et al. Reference Freund, Lele and Moin2000; Pantano & Sarkar Reference Pantano and Sarkar2002). However, each pressure–strain correlation is far from being negligible and the decrease of these correlations with an increasing Mach number is likely to explain the decay of the growth rate (Vreman et al. Reference Vreman, Sandham and Luo1996; Freund et al. Reference Freund, Lele and Moin2000). Vreman et al. (Reference Vreman, Sandham and Luo1996) proposed a model of the pressure–strain rate correlations and Freund et al. (Reference Freund, Lele and Moin2000) explained the decay of turbulent quantities by an abatement of pressure fluctuations causing a communication breakdown across the large structures. Further explanations are given by the sonic-eddy model of Breidenthal (Reference Breidenthal1992). Since pressure–strain correlations are composed of pressure fluctuations and strain-rate fluctuations, Martínez Ferrer et al. (Reference Martínez Ferrer, Lehnasch and Mura2017) suggested that the reduction of pressure fluctuations may not be the only reason for the pressure–strain rate decay. Their three-dimensional DNS simulations at convective Mach numbers between 0.35 and 1.1 suggest that the strain-rate fluctuations also decrease with an increasing Mach number.
In the present article, the influence of a DG on the turbulent quantities characteristic of the mixing layer and in particular on the mixing layer growth rate is investigated for the first time using DNS for a convective Mach number of 1.1. This rather large value is retained because it can be expected for DG mixing layers in practical applications and also because several ideal gas DNS are available for this value of  $M_{c}$, which will allow the validation of our own ideal gas DNS.
The next section describes the main parameters of the numerical study. The present DNS results are then validated in § 3 for an air compressible mixing layer at  $M_{c}=1.1$. Finally, comparisons between ideal gas and DG mixing layers are performed in § 4. The analysis focuses on the TKE balance, the specific TKE spectra and the filtered kinetic energy balance. The aim is to analyse the differences, if any, in the integrated turbulent terms but also over the whole spectrum, by looking at the key turbulent quantities over the turbulent scales.
2 Problem description
2.1 Initial conditions
Direct numerical simulations of an  $M_{c}=1.1$ compressible mixing layer are performed for a PG and for a (BZT) DG. In the first case, air is chosen and considered as a PG as done by Freund et al. (Reference Freund, Lele and Moin2000). For the DG simulations, perfluorotripentylamine (FC-70, C
 $_{15}$F
 $_{33}$N) is used. It is the same DG used by Fergason et al. (Reference Fergason, Ho, Argrow and Emanuel2001) in order to simulate rarefaction shock waves in a shock tube. It is in particular used as heat transfer fluid, is almost non-toxic and has been evaluated as synthetic blood (Costello, Flynn & Owens Reference Costello, Flynn and Owens2000). Physical parameters useful for the thermodynamic description of FC-70 are given in table 1, as taken from Cramer (Reference Cramer1989).
Physical parameters of FC-70 (Cramer Reference Cramer1989). The critical pressure  $p_{c}$, the critical temperature
 $T_{c}$, the boiling temperature
 $T_{b}$ and the compressibility factor
 $Z_{c}=p_{c}v_{c}/(RT_{c})$ are the input data for the MH equation. The critical specific volume
 $v_{c}$ is deduced from the aforementioned parameters. The acentric factor
 $n$ and the
 $c_{v}(T_{c})/R$ ratio are used to compute the heat capacity
 $c_{v}(T)$ (
 $R={\mathcal{R}}/M$ being the specific gas constant computed from the universal gas constant
 ${\mathcal{R}}$ with
 $M$ being the molar mass of the gas).

The initial conditions of the mixing layer require the choice of the initial operating thermodynamic point in the  $p$–
 $v$ diagram. As described in figure 1, this initial state is chosen within the inversion zone of FC-70 in order to favour the occurrence of expansion shocklets and to maximize DG effects on turbulence. This is also in that region that compressibility effects are the largest since the sound speed is reduced (Colonna & Guardone Reference Colonna and Guardone2006), which maximizes the Mach number. Figure 1 also shows the adiabatic curve on which the initial operating point is lying in the non-dimensional
 $p$–
 $v$ diagram. The corresponding initial value of the fundamental derivative of gas dynamics is
 $\unicode[STIX]{x1D6E4}_{initial}=-0.284$. During the development of the mixing layer, the thermodynamic conditions stay within a close range around the adiabatic curve as shown in figure 1, because shocklet entropy losses and mechanical dissipation are weak in our case. Also, almost all the thermodynamic states stay within the inversion zone throughout the DG simulation. For air, the same values of reduced specific volume and reduced pressure are selected for the initial thermodynamic state. Critical values used for air are the critical pressure
 $p_{c}=3.7663\times 10^{6}~\text{Pa}$ and the specific volume
 $v_{c}=3.13\times 10^{-3}~\text{m}^{3}~\text{kg}^{-1}$ (Stephan & Laesecke Reference Stephan and Laesecke1985).
Simulation parameters. Lengths  $L_{x}$,
 $L_{y}$ and
 $L_{z}$ denote computational domain lengths measured in terms of initial momentum thickness and
 $N_{x}$,
 $N_{y}$ and
 $N_{z}$ denote the number of grid points. All grids are uniform.

a Referred to as the  $16.8M$ simulation, where
 $16.8M$ corresponds to the number of grid cells.
b Referred to as the  $134M$ simulation, where
 $134M$ corresponds to the number of grid cells.
The main non-dimensional characteristics of the compressible mixing layer are the convective Mach number (1.3) and the Reynolds number based on the initial momentum thickness  $\unicode[STIX]{x1D6FF}_{\unicode[STIX]{x1D703},0}$:
 $$\begin{eqnarray}Re_{\unicode[STIX]{x1D6FF}_{\unicode[STIX]{x1D703},0}}=\unicode[STIX]{x0394}u\unicode[STIX]{x1D6FF}_{\unicode[STIX]{x1D703},0}/\unicode[STIX]{x1D708},\end{eqnarray}$$
where  $\unicode[STIX]{x1D708}$ denotes the kinematic viscosity and the momentum thickness at time
 $t$ is defined as
 $$\begin{eqnarray}\unicode[STIX]{x1D6FF}_{\unicode[STIX]{x1D703}}(t)=\frac{1}{\unicode[STIX]{x1D70C}_{0}\unicode[STIX]{x0394}u^{2}}\int _{-\infty }^{+\infty }\overline{\unicode[STIX]{x1D70C}}\left(\frac{\unicode[STIX]{x0394}u^{2}}{4}-\tilde{u} _{x}^{2}\right)\text{d}y,\end{eqnarray}$$
with  $\unicode[STIX]{x1D70C}_{0}=(\unicode[STIX]{x1D70C}_{1}+\unicode[STIX]{x1D70C}_{2})/2$ the averaged density and
 $\tilde{u} _{x}$ the Favre averaged streamwise velocity (defined in (2.13)).
The first part of the study aims at validating the present DNS results using the results of Pantano & Sarkar (Reference Pantano and Sarkar2002) as reference. Following this reference work, the convective Mach number is set equal to 1.1 as previously mentioned, the initial density ratio between the upper and lower streams is equal to unity and the Reynolds number based on the initial momentum thickness is set equal to 160. Table 2 reports the simulation parameters (domain size, grid resolution, dimensional values of velocity and initial momentum thickness). The ratio  $r$ between the Kolmogorov scale and the cell size is about 0.52 for the least refined mesh (
 $16.8M$ simulation) during the selected self-similar range (see § 3.1). To check grid convergence and because the value
 $r=0.52$ corresponding to the baseline mesh is not very large for a DNS, a second DNS has been performed with a refined mesh obtained by doubling the number of grid cells in each direction (
 $134M$ simulation) yielding a ratio
 $r$ equal to 1.03. Turbulent scales are adequately resolved since the TKE is very low close to the Kolmogorov scale (Moin & Mahesh Reference Moin and Mahesh1998).
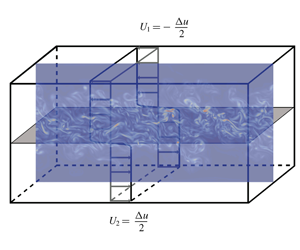
Schematic view of the temporal mixing layer configuration. The grey plane represents the initial momentum thickness and its thickness is at scale with the lengths of the computational domain.

In the present study, the temporal mixing layer, less computationally expensive, is chosen instead of the spatial mixing layer. There are slight differences between the two configurations. For the temporal mixing layer, the two streams flow in opposite directions, which enables one to increase the differential speed with a less important absolute speed for each stream (see figure 2). For the spatial mixing layer, both streams flow in the same direction and a speed gap which corresponds to the differential speed is imposed. The transition from one configuration to the other is a change of Galilean reference frame given by (de Bruin Reference de Bruin2001)
 $$\begin{eqnarray}t\unicode[STIX]{x0394}u_{temporal}=\frac{x\unicode[STIX]{x0394}u_{spatial}}{u_{c}},\end{eqnarray}$$
where  $t$ denotes the time scale of the temporal configuration,
 $\unicode[STIX]{x0394}u_{temporal}$ the differential speed of the temporal evolution,
 $\unicode[STIX]{x0394}u_{spatial}$ the differential speed of the spatial evolution,
 $u_{c}=(U_{1}+U_{2})/2$ the convective speed and
 $x$ the streamwise position scale of the spatial configuration.
The temporal mixing layer requires periodic boundary conditions in the  $x$ and
 $z$ directions. A non-reflective boundary condition is imposed in the
 $y$ direction to prevent the reflection of acoustic waves inside the computational domain. The NSCBC model proposed by Poinsot & Lele (Reference Poinsot and Lele1992) is used.
The mean streamwise velocity is initialized with a hyperbolic tangent profile:
 $$\begin{eqnarray}\bar{u}_{x}(y)=\frac{\unicode[STIX]{x0394}u}{2}\tanh \left(-\frac{y}{2\unicode[STIX]{x1D6FF}_{\unicode[STIX]{x1D703},0}}\right).\end{eqnarray}$$
The complete streamwise velocity field is obtained by adding a fluctuating component to the mean component. For the  $y$ and
 $z$ components of the velocity, the mean part is set equal to zero. A Passot–Pouquet spectrum is imposed for the initial velocity fluctuation:
 $$\begin{eqnarray}E(k)=(k/k_{0})^{4}\exp (-2(k/k_{0})^{2}),\end{eqnarray}$$
where  $k$ denotes the wavenumber. The peak wavenumber
 $k_{0}$ corresponds to the integral scale for which the TKE is maximum inside the initial mixing layer. Peak wavenumber
 $k_{0}$ is set to
 $2\unicode[STIX]{x03C0}/(L_{x}/48)$. The obtained velocity field is then multiplied by an exponential decay over the
 $y$ direction in order to inject turbulent energy in the initial momentum thickness only. That is done in the same way as Pantano & Sarkar (Reference Pantano and Sarkar2002):
 $$\begin{eqnarray}f(y)=\frac{1}{\unicode[STIX]{x1D70E}\sqrt{2\unicode[STIX]{x03C0}}}\exp \left(-\frac{(y-L_{y}/2)^{2}}{2\unicode[STIX]{x1D70E}^{2}}\right),\end{eqnarray}$$
where the full width at half maximum of the peak is set equal to the initial momentum thickness  $\unicode[STIX]{x1D6FF}_{\unicode[STIX]{x1D703},0}=2\unicode[STIX]{x1D70E}\sqrt{2\ln (2)}$. Also, the Gaussian distribution is normalized to reach a maximum value of 1 at the centre
 $y=L_{y}/2$.
2.2 Governing equations
The unsteady, three-dimensional, compressible Navier–Stokes equations are solved to describe the temporally evolving mixing layer:
 $$\begin{eqnarray}\displaystyle & \displaystyle \frac{\unicode[STIX]{x2202}\unicode[STIX]{x1D70C}}{\unicode[STIX]{x2202}t}+\frac{\unicode[STIX]{x2202}(\unicode[STIX]{x1D70C}u_{i})}{\unicode[STIX]{x2202}x_{i}}=0, & \displaystyle\end{eqnarray}$$
 $$\begin{eqnarray}\displaystyle & \displaystyle \frac{\unicode[STIX]{x2202}(\unicode[STIX]{x1D70C}u_{i})}{\unicode[STIX]{x2202}t}+\frac{\unicode[STIX]{x2202}(\unicode[STIX]{x1D70C}u_{i}u_{j})}{\unicode[STIX]{x2202}x_{j}}=-\frac{\unicode[STIX]{x2202}p}{\unicode[STIX]{x2202}x_{i}}+\frac{\unicode[STIX]{x2202}\unicode[STIX]{x1D70F}_{ij}}{\unicode[STIX]{x2202}x_{j}}, & \displaystyle\end{eqnarray}$$
 $$\begin{eqnarray}\displaystyle & \displaystyle \frac{\unicode[STIX]{x2202}(\unicode[STIX]{x1D70C}E)}{\unicode[STIX]{x2202}t}+\frac{\unicode[STIX]{x2202}[(\unicode[STIX]{x1D70C}E+p)u_{j}]}{\unicode[STIX]{x2202}x_{j}}=\frac{\unicode[STIX]{x2202}(\unicode[STIX]{x1D70F}_{ij}u_{i}-q_{j})}{\unicode[STIX]{x2202}x_{j}}, & \displaystyle\end{eqnarray}$$
where  $\unicode[STIX]{x1D70F}_{ij}=\unicode[STIX]{x1D707}((\unicode[STIX]{x2202}u_{i}/\unicode[STIX]{x2202}x_{j})+(\unicode[STIX]{x2202}u_{j}/\unicode[STIX]{x2202}x_{i})-{\textstyle \frac{2}{3}}(\unicode[STIX]{x2202}u_{k}/\unicode[STIX]{x2202}x_{k})\unicode[STIX]{x1D6FF}_{ij})$ denotes the viscous stress tensor (
 $\unicode[STIX]{x1D707}$ is the dynamic viscosity),
 $E=e+{\textstyle \frac{1}{2}}u_{i}u_{i}$ the specific total energy (
 $e$ is the specific internal energy) and
 $q_{j}=-\unicode[STIX]{x1D706}(\unicode[STIX]{x2202}T/\unicode[STIX]{x2202}x_{j})$ the heat flux given by Fourier’s law (
 $\unicode[STIX]{x1D706}$ is the thermal conductivity).
For the DG (FC-70), dynamic viscosity and thermal conductivity follow the model proposed by Chung et al. (Reference Chung, Ajlan, Lee and Starling1988). FC-70 is assumed to behave as a non-polar gas so that its dipole moment can be neglected (Shuely Reference Shuely1996). For the PG (air), the dynamic viscosity follows Sutherland’s law (Sutherland Reference Sutherland1893) and a constant Prandtl number equal to 0.71 is used. The selected constants for Sutherland’s law are the ones given by White (Reference White1998), which are valid for the range of temperature met in the air mixing layer studied in the present study (Grieser & Goldthwaite Reference Grieser and Goldthwaite1963).
Equations (2.7)–(2.9) are completed with thermal and calorific EoS. Air is thermodynamically described by the PG EoS:
 $$\begin{eqnarray}\left.\begin{array}{@{}c@{}}p=\unicode[STIX]{x1D70C}RT,\\ e=e_{ref}+\displaystyle \int _{T_{ref}}^{T}c_{v}(T^{\prime })\,\text{d}T^{\prime },\end{array}\right\}\end{eqnarray}$$
where  $R$ is the specific gas constant,
 $c_{v}$ the specific heat capacity,
 $p$ the pressure,
 $T$ the temperature and
 $\unicode[STIX]{x1D70C}$ the density.
The specific heat capacity  $c_{v}$ is defined as the slope of the sensible energy (
 $c_{v}=(\unicode[STIX]{x2202}e_{s}/\unicode[STIX]{x2202}T)|_{v}$). The sensible energy is computed using the JANAF tables (Stull & Prophet Reference Stull and Prophet1971). Specific heats are thus not constant and the relation
 $\unicode[STIX]{x1D6E4}=(\unicode[STIX]{x1D6FE}+1)/2$ is no longer suitable, since it is only valid for a thermally and calorically PG.
The DG FC-70 is described by the MH EoS (Martin & Hou Reference Martin and Hou1955), as improved by Martin, Kapoor & De Nevers (Reference Martin, Kapoor and De Nevers1959). The MH EoS are given by the following fifth-order equations:
 $$\begin{eqnarray}\left.\begin{array}{@{}c@{}}p=\displaystyle \frac{RT}{v-b}+\mathop{\sum }_{i=2}^{5}\frac{A_{i}+B_{i}T+C_{i}\text{e}^{-kT/T_{c}}}{(v-b)^{i}},\\ e=e_{ref}+\displaystyle \int _{T_{ref}}^{T}c_{v}(T^{\prime })\,\text{d}T^{\prime }+\displaystyle \mathop{\sum }_{i=2}^{5}\frac{A_{i}+C_{i}(1+kT/T_{c})\text{e}^{-kT/T_{c}}}{(i-1)(v-b)^{i-1}},\end{array}\right\}\end{eqnarray}$$
where  $(.)_{ref}$ denotes a reference state,
 $b=v_{c}(1-(-31\,883Z_{c}+20.533)/15)$,
 $k=5.475$ and the coefficients
 $A_{i}$,
 $B_{i}$ and
 $C_{i}$ are numerical constants determined by Martin & Hou (Reference Martin and Hou1955) and Martin et al. (Reference Martin, Kapoor and De Nevers1959) from the physical parameters summarized in table 1.
For the sake of physical analysis, the TKE equation can be derived from the Navier–Stokes equations (2.7)–(2.9). Density, pressure and velocity are each decomposed into a mean and fluctuating component as follows:
 $$\begin{eqnarray}\left.\begin{array}{@{}c@{}}\unicode[STIX]{x1D70C}=\bar{\unicode[STIX]{x1D70C}}+\unicode[STIX]{x1D70C}^{\prime },\\ p=\bar{p}+p^{\prime },\\ u_{i}=\tilde{u} _{i}+u_{i}^{\prime \prime },\end{array}\right\}\end{eqnarray}$$
where  $\bar{\unicode[STIX]{x1D719}}$ denotes the Reynolds average for a flow variable
 $\unicode[STIX]{x1D719}$, while the Favre average
 $\tilde{\unicode[STIX]{x1D719}}$ is defined as
 $$\begin{eqnarray}\tilde{\unicode[STIX]{x1D719}}=\frac{\overline{\unicode[STIX]{x1D70C}\unicode[STIX]{x1D719}}}{\overline{\unicode[STIX]{x1D70C}}}.\end{eqnarray}$$
The Reynolds fluctuation of  $\unicode[STIX]{x1D719}$ is denoted
 $\unicode[STIX]{x1D719}^{\prime }$ while its Favre fluctuation is denoted
 $\unicode[STIX]{x1D719}^{\prime \prime }$. Because of the periodic conditions, Reynolds averaging is equivalent to plane averaging along the
 $x$ and
 $z$ directions. Introducing (2.12) into the instantaneous Navier–Stokes equations, applying the averaging process and combining the resulting equations (see details for instance in Bailly & Comte-Bellot (Reference Bailly and Comte-Bellot2003)) allow one to obtain the TKE equation:
 $$\begin{eqnarray}\displaystyle \frac{\unicode[STIX]{x2202}\bar{\unicode[STIX]{x1D70C}}\tilde{k}}{\unicode[STIX]{x2202}t}+\frac{\unicode[STIX]{x2202}\bar{\unicode[STIX]{x1D70C}}\tilde{k}\tilde{u} _{j}}{\unicode[STIX]{x2202}x_{j}} & = & \displaystyle \underbrace{-\overline{\unicode[STIX]{x1D70C}u_{i}^{\prime \prime }u_{j}^{\prime \prime }}\frac{\unicode[STIX]{x2202}\tilde{u} _{i}}{\unicode[STIX]{x2202}x_{j}}}_{\mathit{Production}}\underbrace{-\overline{\unicode[STIX]{x1D70F}_{ij}^{\prime }\frac{\unicode[STIX]{x2202}u_{i}^{\prime \prime }}{\unicode[STIX]{x2202}x_{j}}}}_{\mathit{Dissipation}}\nonumber\\ \displaystyle & & \displaystyle \underbrace{-\frac{1}{2}\frac{\unicode[STIX]{x2202}\overline{\unicode[STIX]{x1D70C}u_{i}^{\prime \prime }u_{i}^{\prime \prime }u_{j}^{\prime \prime }}}{\unicode[STIX]{x2202}x_{j}}}_{\mathit{Turbulent~transport}}\underbrace{-\frac{\unicode[STIX]{x2202}\overline{p^{\prime }u_{i}^{\prime \prime }}}{\unicode[STIX]{x2202}x_{i}}}_{\mathit{Pressure~transport}}\underbrace{+\frac{\unicode[STIX]{x2202}\overline{u_{i}^{\prime \prime }\unicode[STIX]{x1D70F}_{ij}^{\prime }}}{\unicode[STIX]{x2202}x_{j}}}_{\mathit{Viscous~transport}}\nonumber\\ \displaystyle & & \displaystyle \underbrace{+\overline{p^{\prime }\frac{\unicode[STIX]{x2202}u_{i}^{\prime \prime }}{\unicode[STIX]{x2202}x_{i}}}}_{\mathit{Pressure~dilatation}}\underbrace{-\overline{u_{i}^{\prime \prime }}\left(\frac{\unicode[STIX]{x2202}\bar{p}}{\unicode[STIX]{x2202}x_{i}}-\frac{\unicode[STIX]{x2202}\bar{\unicode[STIX]{x1D70F}}_{ij}}{\unicode[STIX]{x2202}x_{j}}\right)}_{\mathit{Mass-flux~term}},\end{eqnarray}$$
where  $\tilde{k}={\textstyle \frac{1}{2}}\widetilde{u_{i}^{\prime \prime }u_{i}^{\prime \prime }}$ denotes the specific TKE. Equation (2.14) details the physical quantities at stake in a compressible mixing layer, with the production and the dissipation terms being the main terms in this equation. The former depends on the turbulent stress tensor while the latter corresponds to the viscous dissipation. For incompressible configurations, the mass-flux coupling term and the pressure–dilatation term are equal to zero. Also, the dissipation can be decomposed into solenoidal, low-Reynolds-number and dilatational components. This compressible component is related to the occurrence of eddy shocklets and can be written as (Sarkar & Lakshmanan Reference Sarkar and Lakshmanan1991)
 $$\begin{eqnarray}\unicode[STIX]{x1D716}_{d}=\frac{4}{3}\bar{\unicode[STIX]{x1D708}}\overline{\left(\frac{\unicode[STIX]{x2202}u_{k}^{\prime \prime }}{\unicode[STIX]{x2202}x_{k}}\right)^{2}}.\end{eqnarray}$$
2.3 Numerical set-up
The numerical solver AVBP is used to solve the three-dimensional unsteady compressible Navier–Stokes equations (2.7)–(2.9) closed by the EoS (2.10) for air and (2.11) for FC-70. The AVBP solver is massively parallel and designed for LES and DNS (Desoutter et al. Reference Desoutter, Habchi, Cuenot and Poinsot2009; Cadieux et al. Reference Cadieux, Domaradzki, Sayadi, Bose and Duchaine2012). It is widely used for combustion in industry and allows the numerical resolution of the three-dimensional compressible Navier–Stokes equations using a two-step time-explicit Taylor–Galerkin scheme (TTGC) for the hyperbolic terms based on a cell-vertex formulation (Colin & Rudgyard Reference Colin and Rudgyard2000). The scheme ensures third-order accuracy in space and in time. The order of accuracy of the numerical scheme can be thought of as being low to perform a DNS. That is why refined simulations ( $134M$ simulations) have been performed in order to ensure the reliability of the computed flow solutions. The ratio
 $r$ between the Kolmogorov scale and the grid cell size (
 $L_{\unicode[STIX]{x1D702}}/\unicode[STIX]{x0394}x$) is about 1.03 at the centreline during the self-similar period for the PG simulation including
 $134M$ elements (see table 3 in appendix A).
3 Direct numerical simulation validation for a PG compressible mixing layer
In order to assess the quality of the present DNS, this section is devoted to the assessment of air (considered as a PG) simulations, which will be compared in particular to the available results of Pantano & Sarkar (Reference Pantano and Sarkar2002) for exactly the same flow configuration but also with the general trends and correlations available from the analysis of the literature on the compressible turbulent mixing layer.
3.1 Temporal evolution and selection of the self-similar period
Temporal evolution of the mixing layer momentum thickness. Comparison is made between the two different grid precisions ( $16.8M$ and
 $134M$ grid elements) to check the grid convergence and with the available literature (Pantano & Sarkar Reference Pantano and Sarkar2002; Fu & Li Reference Fu and Li2006; Martínez Ferrer et al. Reference Martínez Ferrer, Lehnasch and Mura2017).

Figure 3 shows the temporal evolution of the mixing layer momentum thickness computed for the two levels of grid refinement, along with results from the available literature (Pantano & Sarkar Reference Pantano and Sarkar2002; Fu & Li Reference Fu and Li2006; Martínez Ferrer et al. Reference Martínez Ferrer, Lehnasch and Mura2017). The time is non-dimensional ( $\unicode[STIX]{x1D70F}=t\unicode[STIX]{x0394}u/\unicode[STIX]{x1D6FF}_{\unicode[STIX]{x1D703},0}$) and the momentum thickness is normalized by its initial value. Grid convergence seems well achieved since the mixing layer growth rates are very close between both simulations (
 $16.8M$ and
 $134M$). Additional proofs of grid convergence are provided in appendix A. The momentum thickness temporal evolution is composed of three main sequences:
(i) The first one is a kind of delay, observed in the results of Martínez Ferrer et al. (Reference Martínez Ferrer, Lehnasch and Mura2017) and Fu & Li (Reference Fu and Li2006) and in the present results, but which appears rather short in the results of Pantano & Sarkar (Reference Pantano and Sarkar2002). This delay is likely to be a transition of modes. The energy is initially injected inside the mixing layer through a Passot–Pouquet spectrum with a corresponding integral length set equal to
$L_{x}/48$. Afterwards, the energy is distributed over the whole spectrum and some unstable modes are amplified leading to unstable growth.(ii) The second step of the development of the mixing layer consists of an unstable growth governed by two modes of instability, a wake mode superposed onto a canonical mixing layer mode (Pirozzoli et al. Reference Pirozzoli, Bernardini, Marié and Grasso2015). It eventually turns into an over-linear growth rate.
(iii) Finally, the system reaches a saturation point. At this time, a self-similar state is developing until the turbulent structures exit the computational domain above and below the mixing layer. Self-similarity is characterized by a linear evolution of the momentum thickness over time.

In order to analyse and average the TKE balance (necessary to assess the contribution of the significant turbulent terms), the flow needs to be in a statistically stable state, which corresponds to self-similarity. The objective of this section is to determine the appropriate self-similar range, which is a quite complex task since criteria to characterize this self-similar period are not precisely defined in the literature.
Barre & Bonnet (Reference Barre and Bonnet2015) define their flow as self-similar when they obtain superposition of the mean velocity profiles. Rogers & Moser (Reference Rogers and Moser1994) conclude that self-similarity is reached because of the linear evolution of the momentum thickness, the collapse on a single curve of the mean velocity profiles and the collapse on a single curve of the Reynolds stress profiles. However, the determination of the proper superposition of several curves is sometimes difficult and may be subjective. The same remarks apply to the determination of the linear evolution of the momentum thickness. Analysis of data obtained by Pantano & Sarkar (Reference Pantano and Sarkar2002), Rogers & Moser (Reference Rogers and Moser1994) and Zhou et al. (Reference Zhou, He and Shen2012) shows that the growth rate is probably sub-linear, as also stated by Pirozzoli et al. (Reference Pirozzoli, Bernardini, Marié and Grasso2015). Many authors confirmed the difficulty encountered in reaching a perfect self-similar state (Pantano & Sarkar Reference Pantano and Sarkar2002; Pirozzoli et al. Reference Pirozzoli, Bernardini, Marié and Grasso2015). The diversity of results found in the literature for the well-known growth rate versus convective Mach number graph comes in part from this difficulty in accurately defining the growth rate.
Temporal evolution of the non-dimensional streamwise production and the non-dimensional total transport terms integrated over the whole domain, respectively  $P_{int}^{\ast }=(1/(\unicode[STIX]{x1D70C}_{0}\unicode[STIX]{x0394}u^{3}))\!\int _{L_{y}}\bar{\unicode[STIX]{x1D70C}}P_{xx}\,\text{d}y$ (with
 $\bar{\unicode[STIX]{x1D70C}}P_{xx}=-\overline{\unicode[STIX]{x1D70C}u_{x}^{\prime \prime }u_{y}^{\prime \prime }}(\unicode[STIX]{x2202}\tilde{u} _{x}/\unicode[STIX]{x2202}y)$) and
 $T_{int}^{\ast }=(1/(\unicode[STIX]{x1D70C}_{0}\unicode[STIX]{x0394}u^{3}))\!\int _{L_{y}}(\unicode[STIX]{x2202}T_{k}/\unicode[STIX]{x2202}x_{k})\,\text{d}y$ (with
 $\unicode[STIX]{x2202}T_{k}/\unicode[STIX]{x2202}x_{k}=\unicode[STIX]{x2202}({\textstyle \frac{1}{2}}\overline{\unicode[STIX]{x1D70C}u_{i}^{\prime \prime }u_{i}^{\prime \prime }u_{j}^{\prime \prime }}+\overline{p^{\prime }u_{i}^{\prime \prime }}-\overline{u_{i}^{\prime \prime }\unicode[STIX]{x1D70F}_{ij}^{\prime }})$)
 $/\unicode[STIX]{x2202}x_{k}$. Results are computed from the
 $134M$ simulation.

Another method to determine self-similarity is used in this study. It consists of computing the streamwise production term integrated over the whole domain. Vreman et al. (Reference Vreman, Sandham and Luo1996) indeed demonstrate the following relation between the volumetric streamwise production power ( $\bar{\unicode[STIX]{x1D70C}}P_{xx}=-\overline{\unicode[STIX]{x1D70C}u_{x}^{\prime \prime }u_{y}^{\prime \prime }}(\unicode[STIX]{x2202}\tilde{u} _{x}/\unicode[STIX]{x2202}y)$) and the momentum thickness growth rate:
 $$\begin{eqnarray}\unicode[STIX]{x1D6FF}_{\unicode[STIX]{x1D703}}^{\prime }=\frac{\text{d}\unicode[STIX]{x1D6FF}_{\unicode[STIX]{x1D703}}}{\text{d}t}=\frac{2}{\unicode[STIX]{x1D70C}_{0}\unicode[STIX]{x0394}u^{2}}\int \bar{\unicode[STIX]{x1D70C}}P_{xx}\,\text{d}y.\end{eqnarray}$$
From the above, a constant evolution of the integrated volumetric streamwise production power implies a constant growth rate of the mixing layer. Figure 4 displays this production term as well as the total transport term, which comprises the pressure, the turbulent and the viscous contributions. The chosen self-similar period is given on the graph ( $\unicode[STIX]{x1D70F}\in [1700;2550]$) and corresponds to a converged state of the mixing layer. A long period has been chosen (about
 $900\unicode[STIX]{x1D70F}$) in comparison with the available literature. Pantano & Sarkar (Reference Pantano and Sarkar2002) and Rogers & Moser (Reference Rogers and Moser1994), respectively, selected in their studies a period of 257 and 45 non-dimensional times.
The temporal evolution of the production is consistent with the temporal evolution of the momentum thickness. The three steps mentioned above can be identified. During unstable growth, the production quickly increases, until it reaches a maximum. Afterwards, the mixing layer converges to a self-similar state. The chosen self-similar range is also represented in figure 3 and corresponds closely to a linear evolution of the momentum thickness, consistent with figure 4. The computed time evolution of the momentum thickness shows a rather good match with the available literature even though the mixing layer momentum thickness growth rate computed for the current  $134M$ simulation is smaller (a difference of about 20 % is observed) than the one of Pantano & Sarkar (Reference Pantano and Sarkar2002). Since the computation of the growth rate depends on the chosen self-similar period and since the self-similar period of the current simulation is chosen late enough to achieve a complete convergence, the computed growth rate is smaller. Appendix C provides additional comparisons between PG and DG performed during the selected self-similar period.
3.2 Turbulent kinetic energy balance over the selected self-similar period
Distributions of the normalized specific power quantities over the  $y$ direction are presented for air: P (production), D (dissipation) and T (transport) are normalized by
 $\unicode[STIX]{x0394}u^{3}/\unicode[STIX]{x1D6FF}_{\unicode[STIX]{x1D703}}(t)$ and compared to results of Pantano & Sarkar (Reference Pantano and Sarkar2002). Additional terms (R, residuals; TD, time derivative) are given. The sampling space step of the averaging process is
 $(2L_{y}/\unicode[STIX]{x1D6FF}_{\unicode[STIX]{x1D703}}(\unicode[STIX]{x1D70F}=1700))/N_{points}$, with
 $N_{points}=24$. Distributions have been averaged between the upper and the lower stream to get perfectly symmetric distributions.

Once a relevant time interval has been selected to consider the mixing layer to be self-similar, one can focus on the study of the turbulent kinetic power balance. This equation evaluates terms at stake in the development of the turbulence. It also helps to validate our simulation by comparing the present DNS results with those of Pantano & Sarkar (Reference Pantano and Sarkar2002). In figure 5, quantities are integrated over the two periodic directions ( $x$ and
 $z$), normalized by
 $\unicode[STIX]{x0394}u^{3}/\unicode[STIX]{x1D6FF}_{\unicode[STIX]{x1D703}}(t)$ and drawn versus the non-dimensional cross-stream direction
 $y/\unicode[STIX]{x1D6FF}_{\unicode[STIX]{x1D703}}(t)$. Solutions are averaged over time in the self-similar range (
 $\unicode[STIX]{x1D70F}\in [1700;2550]$).
The present DNS results agree reasonably well, especially the production and the transport terms, with the results of Pantano & Sarkar (Reference Pantano and Sarkar2002): shape as well as intensity are close. The gap between the dissipation terms could be explained by the difference in the choice for the self-similar period. Since the dissipation is linked with the velocity fluctuation gradient and since this last quantity decreases after unstable growth, if the self-similar period is chosen at a earlier time, the dissipation power gets closer to the term of Pantano & Sarkar (Reference Pantano and Sarkar2002).
The two additional quantities are the residuals and the time derivative of the TKE. Residuals are almost zero and thus attest to the proper closure of the balance. The time derivative is far from being negligible and has almost the same intensity as the transport term. This term is rarely reported in the literature possibly because of difficulties encountered when extracting it, especially for the temporal mixing layer. Also, the convective derivative is negligible, in contrast with Zhou et al. (Reference Zhou, He and Shen2012) who studied a spatial mixing layer. In fact, the time derivative of the kinetic energy in a temporal mixing layer and the convective derivative of the kinetic energy in a spatial mixing layer play a symmetric role since the two configurations are linked by a change of Galilean reference frame. It is thus expected that the time derivative in the temporal mixing layer is non-negligible in the same way that the convective derivative in the spatial mixing layer is significant. Finally, it has been noticed that the compressible dissipation, the pressure dilatation, the mass-flux coupling term including the velocity pressure gradient and the convective derivative are negligible in the present study and are thus not represented. Similar observations have been consistently made by several authors to support this fact as previously mentioned in the introduction.
3.3 Validation of the specific TKE spectrum
The TKE balance computed over the whole range of turbulent scales is not the only tool available to highlight the influence of the main terms of the TKE equation. Spectra are very useful to compare TKE scale by scale. In the next section, devoted to the comparison between PG and DG simulations, a comparison at each turbulent scale will be performed through a comparison of the respective PG and DG flow spectra. At this stage, the authors wish to validate the spectrum computed for air. To this end, the present DNS results are compared with those of the current literature in figure 6 (Freund et al. Reference Freund, Lele and Moin2000; Tanahashi, Iwase & Miyauchi Reference Tanahashi, Iwase and Miyauchi2001; Okong’o & Bellan Reference Okong’o and Bellan2002; Pantano & Sarkar Reference Pantano and Sarkar2002). The current spectrum is computed over the centreline and averaged over the self-similar period ( $\unicode[STIX]{x1D70F}\in [1700;2550]$). Because the spectra from the literature display different large-scale values, they are normalized by their value at
 $10k_{0}$. This value is indeed a good threshold to compare spectra at small scales without being subjected to geometry differences. The present results are found to compare favourably with the current literature and the expected reference slopes. The
 $-7$ slope in the logarithmic scale has been established by Batchelor (Reference Batchelor1953) to describe the evolution of kinetic energy at small scales and is consistent with the present spectrum at high wavenumber range. This indicates a proper resolution of the small scales. The
 $-5/3$ and
 $-2$ slopes are the slopes of isothermal homogeneous isotropic turbulence inertial ranges, respectively, for incompressible and compressible flows (Kritsuk et al. Reference Kritsuk, Norman, Paolo Padoan and Wagner2007).
Streamwise specific TKE spectra computed over the centreline. Comparison is made with the available literature.

Temporal evolution of the mixing layer momentum thickness.

The accuracy of the present PG DNS having been established by comparison with available results from the literature, we can now proceed to compare the novel DG (FC-70) flow computations with the results for air in order to identify the potential specificities of DG turbulence.
4 Comparison between PG and DG
4.1 Temporal evolution and selection of the self-similar period
As done for the PG validation process, the computation of the TKE balance requires first the selection of the self-similar range. This is achieved through a combined investigation of the momentum thickness evolution and the evolution of the integrated production and transport terms over time. Figure 7 displays the momentum thickness temporal evolution: PG and DG results show a similar evolution. The curves are initially ( $\unicode[STIX]{x1D70F}\leqslant 200$) very close, with a different evolution for PG and DG mixing layers taking place in the second step of the mixing layer development (approximately
 $200\leqslant \unicode[STIX]{x1D70F}\leqslant 1500$), when the unstable growth is governed by instability modes. The DG unstable growth is faster than the PG one, likely because instability modes and their amplification factor evolve differently for PG and DG mixing layers. Figure 7 also displays the evolution of the DG momentum thickness for the
 $16.8M$ simulation, which is very close to the
 $134M$ simulation, demonstrating grid convergence.
Figure 8 displays the integrated production and transport terms. The DG turbulent production is found to be larger than the PG production, consistent with the larger DG momentum thickness growth rate. Although the unstable evolution is faster for the DG mixing layer, both mixing layers reach a self-similar stage almost at the same time as confirmed in figure 8. The growth rate slopes calculated during the self-similar stage are reported in figure 7: the slope is slightly larger for the DG than for the PG with a typical 5 % difference between DG and PG mixing layers.
Temporal evolution of the non-dimensional streamwise production and the non-dimensional total transport terms integrated over the whole domain, respectively  $P_{int}^{\ast }=(1/(\unicode[STIX]{x1D70C}_{0}\unicode[STIX]{x0394}u^{3}))\int _{L_{y}}\bar{\unicode[STIX]{x1D70C}}P_{xx}\,\text{d}y$ (with
 $\bar{\unicode[STIX]{x1D70C}}P_{xx}=-\overline{\unicode[STIX]{x1D70C}u_{x}^{\prime \prime }u_{y}^{\prime \prime }}(\unicode[STIX]{x2202}\tilde{u} _{x}/\unicode[STIX]{x2202}y)$) and
 $T_{int}^{\ast }=(1/(\unicode[STIX]{x1D70C}_{0}\unicode[STIX]{x0394}u^{3}))\int _{L_{y}}(\unicode[STIX]{x2202}T_{k}/\unicode[STIX]{x2202}x_{k})\,\text{d}y$ (with
 $\unicode[STIX]{x2202}T_{k}/\unicode[STIX]{x2202}x_{k}=\unicode[STIX]{x2202}({\textstyle \frac{1}{2}}\overline{\unicode[STIX]{x1D70C}u_{i}^{\prime \prime }u_{i}^{\prime \prime }u_{j}^{\prime \prime }}+\overline{p^{\prime }u_{i}^{\prime \prime }}-\overline{u_{i}^{\prime \prime }\unicode[STIX]{x1D70F}_{ij}^{\prime }})$)
 $/\unicode[STIX]{x2202}x_{k}$. Results are computed from the
 $134M$ simulation.

The evolution of the integrated transport term provides information on exit flux from the computational domain. It seems that the DG mixing layer displays an extended converged self-similar state compared with the PG mixing layer. The choice has, however, been made in the current study to select a common self-similar range, namely  $\unicode[STIX]{x1D70F}\in [1700;2550]$.
From the above analysis, the comparison between the DG and the PG mixing layers can be divided into two main parts: the initial unstable growth, where differences between the two mixing layers are significant; and the self-similar range, where the dynamics of the mixing layers seem rather close.
4.2 Unstable growth analysis
Distribution of the  $xy$ component of the turbulent stress tensor (
 $\unicode[STIX]{x1D619}_{xy}=\overline{\unicode[STIX]{x1D70C}u_{x}^{\prime \prime }u_{y}^{\prime \prime }}/\bar{\unicode[STIX]{x1D70C}}$) over the non-dimensional direction
 $y/\unicode[STIX]{x1D6FF}_{\unicode[STIX]{x1D703}}(t)$. Results are computed from the
 $134M$ simulation. The curves for FC-70 and air at
 $\unicode[STIX]{x1D70F}=50$ collapse.

During the unstable growth, the momentum thickness evolution is governed by instability modes and their amplification mechanism. A larger growth is directly related to a larger production term according to Vreman et al. (Reference Vreman, Sandham and Luo1996). The streamwise production term is composed of the Favre averaged velocity gradient and the turbulent stress tensor. The comparison of the first term does not show significant differences between DG and PG unlike the second term. Figure 9 displays the distributions of the  $xy$ component of the turbulent stress tensor
 $\unicode[STIX]{x1D619}_{xy}=\overline{\unicode[STIX]{x1D70C}u_{x}^{\prime \prime }u_{y}^{\prime \prime }}/\bar{\unicode[STIX]{x1D70C}}$ normalized by
 $\unicode[STIX]{x0394}u^{2}$ over the normalized cross-stream direction
 $y/\unicode[STIX]{x1D6FF}_{\unicode[STIX]{x1D703}}(t)$ during the initial growth. The DG
 $xy$ component of the turbulent stress tensor increases much faster than the PG one until
 $\unicode[STIX]{x1D70F}\approx 500$. Afterwards, both tensors reach the same level at
 $\unicode[STIX]{x1D70F}\approx 1000$. This observation is consistent with the temporal evolution of the integrated streamwise production term.
Specific TKE spectra in the streamwise direction computed over the centreline during the unstable growth phase. Results are computed from the  $134M$ simulation.

In order to better understand the difference of dynamics between PG and DG, the comparison of PG and DG mixing layers during the unstable growth is investigated using the specific TKE spectra. Spectra reported in figure 10 are computed on the centreline in the streamwise direction. One can notice the sudden increase of the specific TKE at the smallest scales for the DG. Consistent with observations made by the authors for DNS of forced HIT (Vadrot, Giauque & Corre Reference Vadrot, Giauque and Corre2019) in a DG, the dynamics at the smallest scales is different between the PG and DG. The slope of the specific TKE decrease at the smallest scales tends to be larger for the DG in comparison with the PG.
This increase is not likely to explain the different unstable growth phase between DG and PG because this region of the spectrum corresponds to low-energy modes. However, in the approximate range  $k_{x}/k_{0}\in [10;22]$, energy is much larger for the DG when compared to the PG (a factor of between 2 and 3 is found). These modes are high-energy modes and are responsible for the difference between the DG and the PG during the unstable growth phase.
Another explanation can be found in the evolution of the turbulent Mach number  $M_{t}$, displayed in figure 11 for FC-70 and air. The turbulent Mach number is computed using the following relation:
 $$\begin{eqnarray}M_{t}=\frac{\sqrt{\overline{u_{x}^{\prime 2}}+\overline{u_{y}^{\prime 2}}+\overline{u_{z}^{\prime 2}}}}{c}.\end{eqnarray}$$
Temporal evolution of turbulent Mach number. Results are computed from the  $134M$ simulation.

Turbulent Mach numbers increase during the unstable growth phase until  $M_{t}\approx 0.53$. Evolutions for DG and PG are very close during this first phase, with a slightly larger value for the DG, which is consistent with the evolutions of the turbulent production (figure 8). Next, turbulent Mach numbers decrease and reach an approximately constant value during the self-similar period. Average values are almost equal for DG and PG (
 $M_{t_{av,DG}}\approx 0.38<M_{t_{av,PG}}\approx 0.39$). Shocklets might be observed during a short period of time during the unstable growth phase (
 $\unicode[STIX]{x1D70F}\in [500;750]$), which corresponds to the period of time during which discrepancies appears between DG and PG (see figure 7). During this short period of time, even though the values of the turbulent Mach number are almost the same for DG and PG, their effect on the mixing layer growth is different. Since the majority of the thermodynamic states lie inside the inversion region, expansion shocklets could be one reason for the discrepancy between DG and PG. However, since it represents a very short period of time after which
 $M_{t}$ decreases well below the range of values for which shocklets are expected, it is not likely to influence the self-similar period.
4.3 Turbulent kinetic energy balance computed over the self-similar period
Distribution of thermodynamic states along the initial adiabatic curve. Amplitude is normalized with the maximum value at  $\unicode[STIX]{x1D70F}=1000$. Results are computed from the
 $134M$ simulation.

Before analysing the TKE equation, it can be checked, in order to maximize the differences between DG and PG, that the DG mixing layer thermodynamic states stay inside the inversion region in the  $p$–
 $v$ diagram. Figure 12 presents the thermodynamic state distributions on the adiabatic curve normalized by the maximum value at
 $\unicode[STIX]{x1D70F}=1000$. One can note that almost all the thermodynamic states stay inside the inversion region all along the development of the mixing layer. Also, the distributions seem to become asymmetric towards larger reduced molar volumes (
 $v_{r}$) which corresponds to a decrease of the reduced pressures (
 $p_{r}$) in figure 1.
During the self-similar period ( $\unicode[STIX]{x1D70F}\in [1700;2550]$), both DG and PG mixing layers are in a statistically stable state and the terms of the TKE equation can be averaged. Consistent with the evolution of the integrated production given in figure 8 and with the formulation of Vreman et al. (Reference Vreman, Sandham and Luo1996), powers given in figure 13 are volumetric unlike in figure 5 showing the comparison with Pantano & Sarkar (Reference Pantano and Sarkar2002). The choice of using the volumetric or the specific power formulation influences the comparison between DG and PG. The difference between the two formulations can be more easily expressed by a normalization with either
 $\unicode[STIX]{x1D70C}_{0}$ or
 $\bar{\unicode[STIX]{x1D70C}}$, respectively, for the volumetric and for the specific powers. For the DG, the difference between both formulations is reduced compared with the PG. The decrease of the Reynolds-averaged density over the
 $y$ direction is indeed lower for the DG than for the PG. It is likely that the molecular complexity of the DG reduces the temperature increase related to the viscous dissipation, which also reduces the density decrease and thus the difference between the volumetric and specific power formulations (see thermodynamic analysis in appendix B).
Distribution of the volumetric normalized powers over the non-dimensional cross-stream direction  $y/\unicode[STIX]{x1D6FF}_{\unicode[STIX]{x1D703}}(t)$. Here P (production), D (dissipation) and T (transport) are normalized by
 $\unicode[STIX]{x1D70C}_{0}\unicode[STIX]{x0394}u^{3}/\unicode[STIX]{x1D6FF}_{\unicode[STIX]{x1D703}}(t)$. Results are computed from the
 $134M$ simulation. The sampling space step of the averaging process is
 $(2L_{y}/\unicode[STIX]{x1D6FF}_{\unicode[STIX]{x1D703}}(\unicode[STIX]{x1D70F}=1700))/N_{points}$, with
 $N_{points}=24$. Distributions have been averaged between the upper and the lower stream to get perfectly symmetric distributions.

Figure 13 shows the comparison of the main volumetric TKE budget terms between the PG and the DG mixing layers. Results are close between the two types of gases. The production term is slightly larger for the DG when compared to the PG, which is consistent with figure 8 and with the 5 % increase of the momentum growth rate. The dissipation is also larger for the DG in order to counterbalance the turbulent production. The transport term is almost identical between DG and PG. The pressure transport and turbulent transport terms are close between the two types of gases (the viscous transport is negligible). The DG seems to have a limited effect on these turbulent quantities. However, one can highlight a slower propagation of the TKE terms at the boundaries of the mixing layer as a visible effect induced by the DG: the curves are indeed widened for the PG with respect to the DG. The observation of this effect is confirmed by the distributions of mean axial velocity profiles given in figure 26.
Distribution of the main non-dimensional volumetric power terms of the  $x$ turbulent stress tensor (
 $\unicode[STIX]{x1D619}_{xx}$) equation over the non-dimensional cross-stream direction
 $y/\unicode[STIX]{x1D6FF}_{\unicode[STIX]{x1D703}}(t)$. The
 $P_{xx}$ (streamwise production),
 $\unicode[STIX]{x1D6F1}_{xx}$ (streamwise pressure–strain) and
 $D_{xx}$ (streamwise dissipation) terms are normalized by
 $\unicode[STIX]{x1D70C}_{0}\unicode[STIX]{x0394}u^{3}/\unicode[STIX]{x1D6FF}_{\unicode[STIX]{x1D703}}(t)$. Results are computed from the
 $134M$ simulation. The sampling space step of the averaging process is
 $(2L_{y}/\unicode[STIX]{x1D6FF}_{\unicode[STIX]{x1D703}}(\unicode[STIX]{x1D70F}=1700))/N_{points}$, with
 $N_{points}=24$. Distributions have been averaged between the upper and the lower stream to get perfectly symmetric distributions.

Concerning the other terms of the TKE equation, it is found that the compressible dissipation, the pressure dilatation, the mass-flux coupling term and the convective derivative of the TKE are negligible for both PG and DG. Residuals and time derivative agree well between both gases.
As mentioned in the introduction, the well-known compressibility-related reduction of the momentum thickness growth rate is explained by a reduction of the pressure–strain terms ( $\unicode[STIX]{x1D6F1}_{ij}$). These terms only appear explicitly in the turbulent stress tensor equations. Figures 14 and 15 give the turbulent stress tensor budget terms over, respectively, the
 $x$ and
 $y$ directions. In the same way as for the PG, the pressure–strain terms are not negligible for the DG, but no significant difference is observed between the DG and the PG. The DG mixing layer seems to suffer the same reduction of the pressure–strain terms as the Mach number increases, which is due to both (i) the reduction of the pressure fluctuations and (ii) the reduction of the gradient of velocity fluctuations when the convective Mach number increases.
At  $y/\unicode[STIX]{x1D6FF}_{\unicode[STIX]{x1D703}}(t)=0$, a non-monotonic behaviour is observed for DG, which is due to the difference in thermodynamic behaviour illustrated in figure 23. The density fluctuations are indeed larger at the centre of the mixing layer for DG, unlike PG where peaks of root-mean-square density are located at the borders of the layer. This higher density fluctuation rate at the centre is likely to disturb the distributions of production since this term is calculated using Favre averaging.
In the vertical direction, production terms are even more non-monotonic for both DG and PG (figure 15) because they involve the vertical gradient of the mean vertical velocity. Since this gradient is calculated in the vertical direction, which corresponds to the direction of the mixing layer growth, it induces much noisier distributions.
Distribution of the main non-dimensional volumetric power terms of the  $y$ turbulent stress tensor (
 $\unicode[STIX]{x1D619}_{yy}$) equation over the non-dimensional cross-stream direction
 $y/\unicode[STIX]{x1D6FF}_{\unicode[STIX]{x1D703}}(t)$. The
 $P_{yy}$ (cross-stream production),
 $\unicode[STIX]{x1D6F1}_{yy}$ (cross-stream pressure–strain) and
 $D_{yy}$ (cross-stream dissipation) terms are normalized by
 $\unicode[STIX]{x1D70C}_{0}\unicode[STIX]{x0394}u^{3}/\unicode[STIX]{x1D6FF}_{\unicode[STIX]{x1D703}}(t)$. Results are computed from the
 $134M$ simulation. The sampling space step of the averaging process is
 $(2L_{y}/\unicode[STIX]{x1D6FF}_{\unicode[STIX]{x1D703}}(\unicode[STIX]{x1D70F}=1700)/N_{points})$, with
 $N_{points}=24$. Distributions have been averaged between the upper and the lower stream to get perfectly symmetric distributions.

4.4 Specific TKE spectra computed during the self-similar period
The aforementioned results do not exhibit significant differences between DG and PG, but that does not imply that there is no difference at all: a turbulent quantity may appear to be the same for PG and DG when looked at as a global quantity over the whole wavenumber range but may actually behave differently at some specific turbulent scales. Since our final objective is to assess the need for new LES subgrid models in the case of turbulent DG flows, it is important to take a closer look at each quantity in the spectral domain. The streamwise specific TKE spectra computed on the centreline are thus shown in figure 16 for DG and PG. Spectra are normalized by  $\unicode[STIX]{x0394}u^{2}\unicode[STIX]{x1D6FF}_{\unicode[STIX]{x1D703}}(t)$ following Pirozzoli et al. (Reference Pirozzoli, Bernardini, Marié and Grasso2015). The longitudinal Taylor microscale
 $\unicode[STIX]{x1D706}_{x}$ is also reported in figure 16, computed as (see Bailly & Comte-Bellot Reference Bailly and Comte-Bellot2003)
 $$\begin{eqnarray}\unicode[STIX]{x1D706}_{x}=\sqrt{\frac{2\overline{{u^{\prime 2}}_{x}}}{\overline{\left({\displaystyle \frac{\unicode[STIX]{x2202}u_{x}^{\prime }}{\unicode[STIX]{x2202}x}}\right)^{2}}}}.\end{eqnarray}$$
Note that the following simplified equation often used in the literature:
 $$\begin{eqnarray}\unicode[STIX]{x1D706}_{x}=\sqrt{\frac{30\unicode[STIX]{x1D708}\overline{u^{\prime 2}}}{\unicode[STIX]{x1D716}}}\end{eqnarray}$$
does not apply here since it is only valid for incompressible and homogeneous turbulence (Kolmogorov Reference Kolmogorov1941).
Streamwise specific TKE spectra computed on the centreline.

Dense gas/perfect gas streamwise specific TKE spectra ratio. Results are computed from the  $134M$ simulation.

The evolution of TKE is similar for both PG and DG flows at the largest scales. However, at small scales, the PG TKE is decreasing faster than the DG TKE, an observation reminiscent of the one made for the unstable growth phase. The DG effect therefore seems to increase small-scale energy. The dissipation term, which is the main term at these scales, seems to be reduced. Figure 17 displays the ratio of the DG to the PG spectra and enables one to precisely focus on quantities at stake. At scales smaller than the Taylor microscale, the DG to PG energy ratio increases up to a factor of six.
Note that the  $L_{x}/\unicode[STIX]{x1D706}_{x}$ ratio is slightly smaller for the DG. The turbulent structures at which dissipation plays an important role are smaller for the DG than for the PG.
4.5 Filtered kinetic energy equation computed over the self-similar period
The analysis of the filtered kinetic energy equation balance, developed for compressible flows by Aluie (Reference Aluie2013), is of interest in turbulence modelling because it enables one to obtain the main terms at each scale in the spectrum. This approach has only been applied so far to HIT (Wang et al. Reference Wang, Wan, Chen and Chen2018). To the best of the authors’ knowledge, no such analysis has been yet conducted for compressible mixing layers. It consists of using a scale decomposition similar to the Favre filtering:
 $$\begin{eqnarray}\tilde{f}_{l}=\frac{\overline{\unicode[STIX]{x1D70C}f}_{l}}{\bar{\unicode[STIX]{x1D70C}}_{l}}.\end{eqnarray}$$
Quantities at scales below the filtering scale  $l$ are filtered. The resulting filtered equations for the density and the momentum remain almost unchanged. The only difference is the appearance of the SGS stress tensor
 $\bar{\unicode[STIX]{x1D70C}}\tilde{t}_{ij}=\overline{\unicode[STIX]{x1D70C}}(\widetilde{u_{i}u_{j}}-\tilde{u} _{i}\tilde{u} _{j})$:
 $$\begin{eqnarray}\displaystyle & \displaystyle \frac{\unicode[STIX]{x2202}\bar{\unicode[STIX]{x1D70C}}}{\unicode[STIX]{x2202}t}+\frac{\unicode[STIX]{x2202}\bar{\unicode[STIX]{x1D70C}}\tilde{u} _{i}}{\unicode[STIX]{x2202}x_{i}}=0, & \displaystyle\end{eqnarray}$$
 $$\begin{eqnarray}\displaystyle & \displaystyle \frac{\unicode[STIX]{x2202}\bar{\unicode[STIX]{x1D70C}}\tilde{u} _{i}}{\unicode[STIX]{x2202}t}+\frac{\unicode[STIX]{x2202}\bar{\unicode[STIX]{x1D70C}}\tilde{u} _{i}\tilde{u} _{j}}{\unicode[STIX]{x2202}x_{j}}=-\frac{\unicode[STIX]{x2202}\bar{p}}{\unicode[STIX]{x2202}x_{i}}+\frac{\unicode[STIX]{x2202}(\bar{\unicode[STIX]{x1D70F}}_{ij}-\bar{\unicode[STIX]{x1D70C}}\tilde{t}_{ij})}{\unicode[STIX]{x2202}x_{j}}. & \displaystyle\end{eqnarray}$$
The filtered equation for the large-scale kinetic energy is obtained from (4.6):
 $$\begin{eqnarray}\frac{\unicode[STIX]{x2202}}{\unicode[STIX]{x2202}t}\left(\frac{1}{2}\bar{\unicode[STIX]{x1D70C}}\tilde{u} _{i}^{2}\right)+J_{l}=-\unicode[STIX]{x1D6F7}_{l}-\unicode[STIX]{x1D6F1}_{l}-D_{l},\end{eqnarray}$$
where  $J_{l}$ represents the transport term,
 $\unicode[STIX]{x1D6F7}_{l}$ is the large-scale pressure–dilatation term,
 $\unicode[STIX]{x1D6F1}_{l}$ is the SGS kinetic energy flux and
 $D_{l}$ is the viscous dissipation term (using the notations of Wang et al. (Reference Wang, Wan, Chen and Chen2018)):
 $$\begin{eqnarray}\displaystyle & \displaystyle J_{l}=\frac{\unicode[STIX]{x2202}}{\unicode[STIX]{x2202}x_{j}}\left(\frac{1}{2}\bar{\unicode[STIX]{x1D70C}}\tilde{u} _{i}^{2}\tilde{u} _{j}+\bar{p}\tilde{u} _{j}+\bar{\unicode[STIX]{x1D70C}}\tilde{t}_{ij}\tilde{u} _{i}-\tilde{u} _{i}\bar{\unicode[STIX]{x1D70F}}_{ij}\right), & \displaystyle\end{eqnarray}$$
 $$\begin{eqnarray}\displaystyle & \displaystyle \unicode[STIX]{x1D6F7}_{l}=-\bar{p}\frac{\unicode[STIX]{x2202}\tilde{u} _{i}}{\unicode[STIX]{x2202}x_{i}}, & \displaystyle\end{eqnarray}$$
 $$\begin{eqnarray}\displaystyle & \displaystyle \unicode[STIX]{x1D6F1}_{l}=-\bar{\unicode[STIX]{x1D70C}}\tilde{t}_{ij}\frac{\unicode[STIX]{x2202}\tilde{u} _{i}}{\unicode[STIX]{x2202}x_{j}}, & \displaystyle\end{eqnarray}$$
 $$\begin{eqnarray}\displaystyle & \displaystyle D_{l}=\bar{\unicode[STIX]{x1D70F}}_{ij}\frac{\unicode[STIX]{x2202}\tilde{u} _{i}}{\unicode[STIX]{x2202}x_{j}}. & \displaystyle\end{eqnarray}$$
The ensemble average can be next applied to (4.7) to yield
 $$\begin{eqnarray}\left\langle \frac{\unicode[STIX]{x2202}}{\unicode[STIX]{x2202}t}\left(\frac{1}{2}\bar{\unicode[STIX]{x1D70C}}\tilde{u} _{i}^{2}\right)\right\rangle +\langle J_{l}\rangle =-\langle \unicode[STIX]{x1D6F7}_{l}\rangle -\langle \unicode[STIX]{x1D6F1}_{l}\rangle -\langle D_{l}\rangle .\end{eqnarray}$$
In the mixing layer under study, turbulence is homogeneous along the  $x$ and
 $z$ directions. Terms of (4.7) can thus be integrated along these two directions. As previously done for figure 13, the filtered kinetic energy equation is obtained along the mixing layer developing direction (
 $y$). Unlike HIT, the transport term integrated over the
 $x$ and
 $z$ directions is not equal to zero. The turbulence is indeed not homogeneous along the
 $y$ direction and the boundary conditions are not periodic; it thus cannot be averaged along the transverse direction
 $y$.
Filtered kinetic energy equation terms computed on the centreline of the mixing layer and averaged during the self-similar period ( $\unicode[STIX]{x1D70F}\in [1700;2550]$) (R, residuals; TD, time derivative). Results are computed from the
 $134M$ simulation.

Also, the kinetic energy equation terms defined by Wang et al. (Reference Wang, Wan, Chen and Chen2018) do not seem fully suitable to study the compressible mixing layer. The large-scale pressure–dilatation term ( $\unicode[STIX]{x1D6F7}_{l}$) and the large-scale pressure–transport term (
 $\unicode[STIX]{x2202}(\bar{p}\tilde{u} _{j})/\unicode[STIX]{x2202}x_{j}$) exchange energy together and evolve significantly within the wavenumber range and from one integration plane to another. A more appropriate quantity seems to be
 $\unicode[STIX]{x1D6F4}_{l}$ corresponding to the sum of these two terms, which leads to a transformed (with respect to (4.12)) averaged kinetic energy equation:
 $$\begin{eqnarray}\displaystyle & \displaystyle \left\langle \frac{\unicode[STIX]{x2202}}{\unicode[STIX]{x2202}t}\left(\frac{1}{2}\bar{\unicode[STIX]{x1D70C}}\tilde{u} _{i}^{2}\right)\right\rangle +\langle J_{l}^{\ast }\rangle =-\langle \unicode[STIX]{x1D6F4}_{l}\rangle -\langle \unicode[STIX]{x1D6F1}_{l}\rangle -\langle D_{l}\rangle , & \displaystyle\end{eqnarray}$$
 $$\begin{eqnarray}\displaystyle & \displaystyle J_{l}^{\ast }=\frac{\unicode[STIX]{x2202}}{\unicode[STIX]{x2202}x_{j}}\left(\frac{1}{2}\bar{\unicode[STIX]{x1D70C}}\tilde{u} _{i}^{2}\tilde{u} _{j}+\bar{\unicode[STIX]{x1D70C}}\tilde{t}_{ij}\tilde{u} _{i}-\tilde{u} _{i}\bar{\unicode[STIX]{x1D70F}}_{ij}\right), & \displaystyle\end{eqnarray}$$
 $$\begin{eqnarray}\displaystyle & \displaystyle \unicode[STIX]{x1D6F4}_{l}=\tilde{u} _{i}\frac{\unicode[STIX]{x2202}\bar{p}}{\unicode[STIX]{x2202}x_{i}}, & \displaystyle\end{eqnarray}$$
where  $\unicode[STIX]{x1D6F4}_{l}$ represents the power of the pressure strengths computed from the filtered variables. Figure 18 displays the terms of the filtered kinetic energy equation (4.13) computed on the centreline of the mixing layer.
As expected, the SGS kinetic energy flux ( $\unicode[STIX]{x1D6F1}_{l}$) prevails at large scales and decreases as the filtering wavelength gets smaller. Unlike the SGS kinetic energy flux, the viscous dissipation (
 $D_{l}$) increases with the filtering wavenumber. These two terms are counterbalanced by the transport term. The detailed decomposition of this last term is given in figure 19. The residuals show a good closure of the balance for both types of gases and mostly correspond to the temporal derivative of the TKE.
The comparison between the DG and the PG shows that the transition between the large and small scales, identified by the intersection between the SGS kinetic energy flux and the viscous dissipation term curves, is delayed to higher wavenumbers for the DG when compared to the PG. This observation is consistent with the computed value of the Taylor microscale given in figure 16. Also, the SGS kinetic energy flux seems to be smaller at large scales for the DG when compared to the PG.
Filtered transport terms composing  $J_{l}^{\ast }$ computed on the centreline of the mixing layer and averaged during the self-similar period (
 $\unicode[STIX]{x1D70F}\in [1700;2550]$). Results are computed from the
 $134M$ simulation.

Streamwise specific TKE spectra computed on the centreline.

A detailed description of the quantities composing the transport term is given in figure 19. One can note that at small scales, the transport term is mainly composed of the convective flux of the filtered kinetic energy  $(-\unicode[STIX]{x2202}(\frac{1}{2}\bar{\unicode[STIX]{x1D70C}}\tilde{u} _{i}^{2}\tilde{u} _{j})/\unicode[STIX]{x2202}x_{j})$. At large scales, this quantity decreases and the SGS kinetic energy transport term becomes the main term.
Comparison between DG and PG shows that the main quantities are significantly weaker for DG, consistent with figure 18.
5 Concluding remarks
Direct numerical simulations of the compressible mixing layer at convective Mach number  $M_{c}=1.1$ have been achieved for air described as a PG and FC-70 (BZT gas) described using MH EoS. Perfect gas results have been compared with available results from the literature in order to demonstrate the quality of the present DNS results before moving to the PG versus DG comparison and the identification of DG turbulence specificities. Two sets of observations have been proposed and are summarized here: the first set deals with the general study of compressible mixing layers while the second set is specific to the DG flow and its comparison to the PG model.
The selection of the self-similar period is a key point in the study of mixing layers: this choice remains complex and the diversity of the criteria used for the selection process contributes to the diversity of results reported in the literature (also translating into the diversity of  $\dot{\unicode[STIX]{x1D6FF}_{\unicode[STIX]{x1D703}}}=f(M_{c})$ plots). Care has been given in the present study to a well-justified selection of this self-similar period, based on the analysis of the integrated streamwise production over time, which is proportional to the momentum thickness growth rate under certain conditions (Vreman et al. Reference Vreman, Sandham and Luo1996).
Looking at the evolution of the integrated transport term over time enables the identification of the exit of turbulent structures from the computational domain, which is an appropriate criterion to define the end of the self-similar period. The sensitivity of the results to mesh refinement has also been investigated. The comparison of the present results obtained for air with the previous DNS of Pantano & Sarkar (Reference Pantano and Sarkar2002) shows a good agreement and validates the present DNS of a compressible mixing layer in air described with the PG EoS.
The comparison between PG and DG does not show major differences for the momentum thickness growth rates and between the two TKE budgets. The DG seems to face the same well-known compressibility-related reduction of the momentum thickness growth rate, caused by the reduction of both pressure fluctuations and the gradient of the velocity fluctuations leading to the reduction of the pressure–strain terms. However, when these quantities are analysed at each turbulent scale, distributions over the wavenumbers turn out to be quite different between PG and DG. Results suggest that the DG effect yields an increase of the TKE at small scales.
Because of a significant decrease in the speed of sound, very large turbulent Mach numbers are expected to be observed experimentally when using DGs for thermodynamic states located in the inversion region. The turbulent Mach number is limited in the present study to approximately 0.4 on the centreline during the self-similar period and only briefly increases beyond 0.5 during the unstable growth phase. The analysis of a DG shear layer at a convective Mach number well above 1.1 will allow one to assess and possibly expand the conclusions drawn from the present comparison between DG and PG to highly supersonic or hypersonic flows.
Distribution of the  $xy$ component of the turbulent stress tensor (
 $\unicode[STIX]{x1D619}_{xy}=\overline{\unicode[STIX]{x1D70C}u_{x}^{\prime \prime }u_{y}^{\prime \prime }}/\bar{\unicode[STIX]{x1D70C}}$) averaged over the self-similar period. Comparison is made between the
 $16.8M$ and the
 $134M$ simulations for DG and PG. Distributions have been averaged between the upper and the lower stream to get perfectly symmetric distributions.

Acknowledgements
This work is supported by the JCJC ANR EDGES project, grant no. ANR-17-CE06-0014-01 of the French Agence Nationale de la Recherche. Simulations have been carried out using HPC resources at CINES under project grant no. A0042A07564.
Declaration of interests
The authors report no conflict of interest.
Appendix A. Domain size and resolution
Additional proofs of grid convergence are given in figures 20 and 21. Spectra and the  $xy$ component of the turbulent stress tensor computed for the
 $134M$ and the
 $16.8M$ simulations during the self-similar period are found to be very close, demonstrating a proper grid convergence of the results. For spectra, discrepancies occur at very small scales only, where energy is very low. This shows that the energy decrease for the
 $16.8M$ simulations starts at
 $k_{x}/k_{0}\approx 150$, corresponding to about
 $1/2$ to
 $1/3$ of the Nyquist–Shannon sampling frequency. This observation appears very reasonable, given the third-order spatial accuracy of the numerical scheme.
To complement the grid resolution study, figure 22 displays a comparison between DG and PG for the vertical distribution of  $r=L_{\unicode[STIX]{x1D702}}/\unicode[STIX]{x0394}x$ at different non-dimensional times within the self-similar range. At the centre of the mixing layer, the Kolmogorov length scale is at its minimum value since the turbulent activity is maximum. A slightly better resolution at the centre can be observed for PG compared to DG, but values of
 $r$ stay above 0.80 in any case, which is enough for DNS resolution. As a comparison, the ratio of Pantano & Sarkar (Reference Pantano and Sarkar2002) was about 0.38.
Distributions of  $r=L_{\unicode[STIX]{x1D702}}/\unicode[STIX]{x0394}x$, the ratio between the Kolmogorov scale and the grid cell size, for the DG (a) and the PG (b) at several non-dimensional times inside the self-similar period (
 $\unicode[STIX]{x1D70F}\in \{1700;1800;2000;2200;2400\}$). Results are computed from the
 $134M$ simulation.

Non-dimensional parameters computed at the beginning ( $\unicode[STIX]{x1D70F}=1700$) and at the end (
 $\unicode[STIX]{x1D70F}=2550$) of the self-similar period. Parameter
 $Re_{\unicode[STIX]{x1D706}_{x}}$ denotes the Reynolds number based on the longitudinal Taylor microscale
 $\unicode[STIX]{x1D706}_{x}$ (see (4.2)) computed at the centreline and
 $L_{\unicode[STIX]{x1D702}}$ denotes the Kolmogorov length scale computed at the centreline.

Profiles are also different between PG and DG. The DG mixing layer is much more localized at the centre of the domain unlike the PG mixing layer which produces a wider distribution as noted in § 4.3.
Table 3 provides non-dimensional physical parameters of the simulation at the beginning ( $\unicode[STIX]{x1D70F}=1700$) and at the end (
 $\unicode[STIX]{x1D70F}=2550$) of the self-similar period. Reynolds numbers based on the momentum thickness increase during the self-similar period and are large enough to lead to a turbulent flow, which is slightly more turbulent for the DG when compared to the PG. Reynolds numbers based on the longitudinal Taylor microscale are larger for DG compared to PG consistent with figure 16. The ratio
 $r$ between the Kolmogorov scale and the grid cell size (
 $L_{\unicode[STIX]{x1D702}}/\unicode[STIX]{x0394}x$) indicates the proper resolution of the simulation. The integral lengths
 $l_{x}$ and
 $l_{z}$ are computed using the streamwise velocity field:
 $$\begin{eqnarray}\displaystyle & \displaystyle l_{x}=\frac{1}{2\overline{u_{x}^{2}}}\int _{-L_{x}/2}^{L_{x}/2}\overline{u_{x}(\boldsymbol{x})u_{x}(\boldsymbol{x}+r\boldsymbol{e}_{\boldsymbol{x}})}\,\text{d}r, & \displaystyle\end{eqnarray}$$
 $$\begin{eqnarray}\displaystyle & \displaystyle l_{z}=\frac{1}{2\overline{u_{x}^{2}}}\int _{-L_{z}/2}^{L_{z}/2}\overline{u_{x}(\boldsymbol{x})u_{x}(\boldsymbol{x}+r\boldsymbol{e}_{\boldsymbol{z}})}\,\text{d}r, & \displaystyle\end{eqnarray}$$
where  $\boldsymbol{e}_{\boldsymbol{x}}$ and
 $\boldsymbol{e}_{\boldsymbol{z}}$ correspond to the unit vectors in the
 $x$ and
 $z$ directions, respectively. The computed integral lengths in the present study are larger than those in the simulation reported by Pantano & Sarkar (Reference Pantano and Sarkar2002), with an integral length in the streamwise direction of about 0.03 for the same
 $M_{c}=1.1$ configuration but reaching 0.178 for a configuration with
 $M_{c}=0.7$ and a density ratio of 4. Despite these larger values for
 $l_{x}$, the computational domain appears to be still sufficiently large to ensure it does not disturb the development of turbulent structures. The same conclusion applies to the spanwise integral length scales for DG and PG.
The non-dimensional Reynolds-averaged (a,c,e) and root-mean-square (b,d,f) values of temperature (a,b), density (c,d) and pressure (e,f) are averaged over the self-similar period ( $\unicode[STIX]{x1D70F}\in [1700;2550]$), plotted along the
 $y$ direction and compared between FC-70 using the MH EoS and air using the PG EoS. Results are computed from the
 $134M$ simulation.

Temporal evolution of Reynolds number based on the momentum thickness. Results are computed from the  $134M$ simulation.

Distributions of the non-dimensional root-mean-square velocities ( $xx$ (a,b),
 $yy$ (c,d),
 $zz$ (e,f) and
 $xy$ (g,h) components) for the DG (a,c,e,g) and the PG (b,d,f,h) at several non-dimensional times outside (
 $\unicode[STIX]{x1D70F}\in \{1000;1400\}$) and inside (
 $\unicode[STIX]{x1D70F}\in \{1800;2200;2500\}$) the self-similar period. Results are computed from the
 $134M$ simulation.

Distribution of the non-dimensional mean streamwise velocity averaged over the self-similar period. Comparison is made between FC-70 using the MH EoS and air using the PG EoS. Results are computed from the  $134M$ simulation.

Appendix B. Mean and fluctuating thermodynamic quantities in the self-similar stage
Figure 23 provides a comparison of pressure, temperature and density between DG and PG flows over the self-similar period. For PG, when looking at the Reynolds-averaged values, one can notice an increase of about 16 % of the temperature at the centre of the mixing layer, due to viscous dissipation. Density decreases in similar proportions unlike pressure which is less impacted (4.5 % decrease). For DG, the temperature is almost not affected by the viscous dissipation. Due to the molecular complexity of DG flows, the thermodynamic evolution is almost isothermal as already observed by Sciacovelli et al. (Reference Sciacovelli, Cinnella and Grasso2017b).
When looking at the root-mean-square values of the fluctuations for PG, significant temperature fluctuations occur at the edges of the mixing layer due to turbulent mixing, leading to significant density variations. Pressure fluctuations are maximum at the centre of the mixing layer. For DG, temperature fluctuations are suppressed. Pressure fluctuations in the DG mixing layer are very close to fluctuations observed in the PG mixing layer, which is consistent with the same pressure–strain levels found in figures 14 and 15.
Appendix C. Additional comparison during the self-similar period
Figure 24 provides a comparison between FC-70 and air for the Reynolds numbers based on the momentum thickness ( $Re_{\unicode[STIX]{x1D6FF}_{\unicode[STIX]{x1D703}}}$). These Reynolds numbers are computed using the domain-averaged viscosity. Results show a much larger increase of the Reynolds number during the whole evolution for DG compared to PG. During the unstable growth phase, this seems consistent with § 4.2. However, during the self-similar period, the gap between DG and PG becomes larger and tends to increase. This behaviour is explained by an increase of the viscosity for PG due to the increase of the temperature (see figure 23). Since the flows are significantly turbulent, this difference in the Reynolds number evolution between DG and PG does not influence the mixing layer growth rates.
Figure 25 gives the profiles of  $xx$,
 $yy$,
 $zz$ and
 $xy$ components of root-mean-square velocities for PG and DG. The self-similar period selected (
 $\unicode[STIX]{x1D70F}\in [1700;2550]$) seems well confirmed by these distributions which collapse relatively well in this time interval. At
 $\unicode[STIX]{x1D70F}=1000$, the profiles are clearly not self-similar. At
 $\unicode[STIX]{x1D70F}=1400$, it is less obvious to decide whether self-similarity is already achieved or not. In order to define the self-similar period from the root-mean-square velocity distributions, one can follow the method given in Almagro, García-Villalba & Flores (Reference Almagro, García-Villalba and Flores2017) computing the temporal mean and standard deviation of the Reynolds stresses for several time intervals. In this paper, another methodology is retained to define the self-similar period (see § 3.1). The comparison between DG and PG in figure 25 shows a similar evolution for the four computed components. The peak value averaged over the self-similar period is about 0.14 and 0.09, respectively, for the
 $xx$ and
 $yy$ components, which is in good agreement with (Pantano & Sarkar Reference Pantano and Sarkar2002) where these values are reported as 0.14 and 0.10.
Figure 26 displays the distribution of the mean streamwise velocity for the DG and the PG shear layers. These profiles confirm the effect highlighted in § 4.3, namely a slower propagation at the boundaries of the domain for DG compared with PG.



