Hypertrophic cardiomyopathy has an estimated prevalence of 1 in 500. The phenotype can include thickened ventricular walls, with or without obstruction of blood flow at the left ventricular outflow tract, increased risk of progression to NYHA III/IV functional class, and increased risk of arrhythmia-induced sudden cardiac death in both adults and paediatric-aged patients.Reference Olivotto, Girolami and Ackerman 1 – Reference Elliott, Poloniecki and Dickie 3
Vectorcardiography is a method of recording the direction and magnitude of electrical forces generated by the heart by means of a series of continuous vectors. The method most frequently utilised was developed by Dr Ernest Frank and is chosen because of its ease of application and theoretical soundness.Reference Frank 4 Recent advances in electrocardiographic technology, including the ability to automatically transform digital 12-lead ECG data into orthogonal vectorcardiographic data,Reference Kors, van Herpen and Sittig 5 can add further diagnosticReference Dilaveris, Gialafos and Pantazis 6 – Reference Voulgari, Tentolouris and Moyssakis 8 and prognosticReference Borleffs, Scherptong and Man 9 – Reference Yamazaki, Froelicher and Myers 17 utility to traditional 12-lead electrocardiograms. Among the derived vectorcardiographic parameters obtainable after such transformations, the spatial QRS-T angle has notable diagnostic utility for conditions in which sudden death may be an outcome,Reference de Torbal, Kors and van Herpen 10 , Reference Kardys, Kors and van der Meer 11 , Reference Rautaharju, Kooperberg and Larson 15 , Reference Yamazaki, Froelicher and Myers 17 in both adultReference Poplock Potter, Holvqvist and Platonov 18 and paediatricReference Cortez, Sharma and Cavanaugh 19 hypertrophic cardiomyopathy patients. The spatial QRS-T angle has also been positively correlated with risk for ventricular arrhythmia in adult patients with ischaemic heart disease.Reference Borleffs, Scherptong and Man 9 We hypothesised that the spatial QRS-T angle would be useful for identification of ventricular arrhythmias in paediatric hypertrophic cardiomyopathy patients under 23 years of age.
Methods
We retrospectively reviewed 12-lead electrocardiograms of paediatric patients <23 years of age with hypertrophic cardiomyopathy during routine follow-up visits to clinics at Children’s Hospital of Colorado, CHOC Children’s, and the University of California at Los Angeles. The overall cohort, apart from the three additional hypertrophic cardiomyopathy patients with ventricular arrhythmias who met the criteria described, and methods of obtaining electrocardiograms as well as echocardiographic measures have been previously described.Reference Cortez, Sharma and Cavanaugh 19 Institutional review board approval from each institution was obtained. This age group was chosen because in the United States of America it represents most patients of collegiate age or younger, where organisation of screening is typically more accessible. It also represents a large number of patients that the American Heart Association includes in its recent statement regarding electrocardiogram screening.Reference Maron, Friedman and Kligfield 20 The diagnosis of hypertrophic cardiomyopathy was based on an echocardiographic evidence of diastolic dysfunction and a Boston z-score of ⩾2.5 for posterior wall or septal thickness during diastole measured from a parasternal short-axis view with left ventricular end-diastolic diameter of 45 mm or, for purely apical hypertrophic cardiomyopathy (n=3), a qualitative interpretation by the reading cardiologist of significant apical thickness with the same end-diastolic diameter cut-off value.
Parameters
Electrocardiograms were obtained at 25 mm/s speed with 10 mm/mV for the limb and praecordial leads. Corrected QT interval and spatial peaks QRS-T angles were assessed. Patients with history of sustained ventricular arrhythmias (30 seconds or greater) by Holter monitoring, exercise stress test, implantable cardiac defibrillator, or a pacemaker within 6 months before the electrocardiogram recording were compared with those without history of sustained ventricular arrhythmias. The vectorcardiographic spatial peaks QRS-T angle was visually derived from conventional 12-lead electrocardiogram recordings based on the method recently described by Cortez et al,Reference Cortez, Sharma and Devers 21 utilising the regression-related transform of Kors et al.Reference Dilaveris, Gialafos and Pantazis 6
Statistics
Student’s T-test and the Mann–Whitney U-test were used as appropriate to evaluate differences between hypertrophic cardiomyopathy patients with versus without ventricular arrhythmias. A p-value of 0.05 or less was deemed significant. Odds ratios were also calculated for each of the above-mentioned criteria based on receiver operating characteristic curve analyses. R-values from regression line analysis were obtained for significant parameters. Multivariate analysis was performed to assess independent predictors. All statistical analyses were performed on PSPP (Pfaff, J. Darrington et al GNU PSPP. http://www.gnu.org/software/pspp/).
Results
Patient population
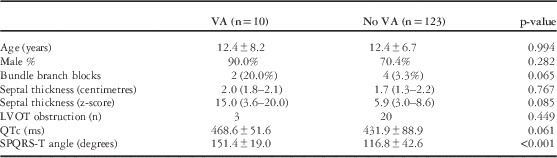
Electrocardiographic results from 133 hypertrophic cardiomyopathy patients (12.4±6.6 years) were assessed; 10 patients with ventricular arrhythmias (five with ICD’s) were identified (12.1±7.9 years, 90.0% males), compared with 123 patients without ventricular arrhythmias (12.4±6.7 years, 70.4% males) (Table 1). Age, male sex, septal thickness, nor septal thickness z-score differentiated those with ventricular arrhythmias from those without ventricular arrhythmias (Table 1). Out of patients with ventricular arrhythmias, one had Noonan syndrome and one had Leopard syndrome. Out of those without ventricular arrhythmias, six patients had Noonan syndrome and one had Danon disease. Owing to the limited number of patients, assessment of differences between the above syndromes was not performed.
Patient demographics and results for hypertrophic cardiomyopathy patients with versus without sustained ventricular arrhythmias (VA and no VA, respectively).

Parameters assessed include age, sex, bundle branch blocks, septal thickness in centimetres and z-score, left ventricular outflow tract obstruction (LVOT obstruction, number), corrected QT interval (QTc in milliseconds, ms), and the spatial peaks QRS-T angle (SPQRS-T angle in degrees)
Corrected QT interval
The corrected QT interval did not differentiate those paediatric-aged hypertrophic cardiomyopathy patients with versus without ventricular arrhythmias (p=0.678). Only four of the 10 hypertrophic cardiomyopathy patients with ventricular arrhythmias (40.0%) had corrected QT interval values >460 ms, whereas 38/123 hypertrophic cardiomyopathy patients without ventricular arrhythmias (30.9%) had corrected QT interval values >460 ms (p=0.725). Post-hoc power calculation gave a power of 20.0%.
Spatial peaks QRS-T angle
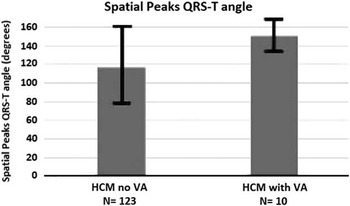
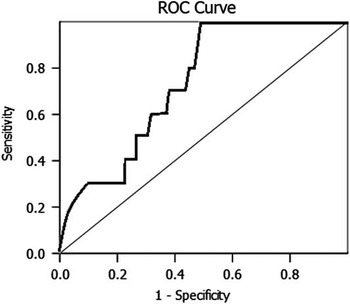
The spatial peaks QRS-T angle differentiated those with versus without ventricular arrhythmias (151.4±19.0 versus 116.8±42.6 degrees, respectively, p<0.001). At an optimum cut-off value of 124.1 degrees, derived from receiver operating characteristic curve analysis optimum cut-off point (see Fig 2), the positive predictive value and negative predictive value were 15.4 and 100.0%, respectively, with an odds ratio of 25.9 (95% confidence interval 1.5–452.2). The area under the receiver operating characteristic curve was 0.74 (95% confidence interval 0.64–0.84, Fig 1). When multivariate analysis was performed using logistic regression, the spatial peaks QRS-T angle was the only independent predictor of ventricular arrhythmias in children with hypertrophic cardiomyopathy when sex, bundle branch blocks, absolute septal thickness z-score, and QTc were taken into account (p=0.011). Of the 10 patients with ventricular arrhythmias, two had complete left bundle branch blocks, whereas 4/123 patients without ventricular arrhythmias had complete bundle branch blocks (p=0.065); however, when only those without complete bundle branch blocks were compared, a significant difference in the spatial peaks QRS-T angle still existed between paediatric-aged hypertrophic cardiomyopathy patients with sustainable ventricular arrhythmias versus those without it (p<0.001). The R-value for the spatial peaks QRS-T angle and maximum septal thickness z-score was 0.61.
Area under the receiver operating characteristic curve (0.74 with 95% confidence intervals of 0.64–0.84) for the spatial QRS-T angle for comparisons of paediatric-aged hypertrophic cardiomyopathy patients with versus those without sustainable ventricular arrhythmias.

Discussion
The most important finding from this study was that the spatial peaks QRS-T angle significantly differentiated paediatric-aged hypertrophic cardiomyopathy patients with ventricular arrhythmias from those without ventricular arrhythmias, while the corrected QT interval did not.
Corrected QT interval
Corrected QT interval prolongation has been previously described in hypertrophic cardiomyopathy patients, with 13% described as having values >480 ms.Reference Johnson, Grifoni and Bos 22 An association between a prolonged QT interval, specifically greater than 460 ms, and ventricular arrhythmias, as well as sudden cardiac death in hypertrophic cardiomyopathy, has also been described.Reference Debonnaire, Katsanos and Joyce 23 In our paediatric cohort, the corrected QT interval was not significantly different between hypertrophic cardiomyopathy patients with versus without ventricular arrhythmias, nor did a corrected QT interval at a cut-off value of 460 ms predict ventricular arrhythmias; however, the post-hoc power calculation demonstrated possibly insufficient numbers to prevent a Type 2 error in QTc comparison. Another reason more patients were likely needed is that this population represents younger patients, and thus less variability in the QTc, as it does increase with age and likely has a greater difference in effect on adult patients than paediatric-aged patients.Reference Rijnbeek, van Herpen and Bots 24
Spatial QRS-T angle
Increased spatial peaks QRS-T angle has previously been shown to identify patients with hypertrophic cardiomyopathyReference Poplock Potter, Holvqvist and Platonov 18 , Reference Cortez, Sharma and Cavanaugh 19 and to predict ventricular arrhythmias in adults with myocardial ischaemia.Reference Borleffs, Scherptong and Man 9 Thus, it seems logical that increased spatial peaks QRS-T angle might also predict ventricular arrhythmias in patients with hypertrophic cardiomyopathy. As the spatial peaks QRS-T angle also increases with degree of hypertrophy, with an R-value of 0.61, it seems logical it would also identify patients with ventricular arrhythmias.Reference Cortez, Sharma and Cavanaugh 19 Furthermore, given the number of males in this study, male sex was used in the multivariate analysis, which shows that, regardless of sex, BBB, absolute septal thickness Z-score, or QTc, the SPQRS-T angle was still an independent predictor ventricular arrhythmias. The poor positive predictive value may be explained by the degree of myocardial disorganisation or scarring; however, as most patients were diagnosed by echocardiography, insufficient data – lack of MRI measurements – were present to investigate this further.
The spatial peaks QRS-T angle significantly differentiated hypertrophic cardiomyopathy patients with versus without ventricular arrhythmias when patients with bundle branch blocks were excluded. Similar to heart failure patient identification in adult studies, bundle branch blocks did not affect the diagnostic utility of the spatial peaks QRS-T angle in our current assessment; thus, this is again another example where the spatial peaks QRS-T angle identification ability is not sufficiently affected by bundle branch blocks.Reference Zhang, Rautaharju and Prineas 25
The spatial peaks QRS-T angle has been previously reported to be higher in paediatric-aged hypertrophic cardiomyopathy patients with Noonan syndrome, Leopard syndrome, Danon disease, and those with genotype positivity as compared with other paediatric-aged hypertrophic cardiomyopathy patients, and we report that it is also higher in those with ventricular arrhythmias; thus, increased spatial peaks QRS-T angle likely represents a marker of sudden death risk.Reference Cortez, Sharma and Cavanaugh 26 This is similar to what has been demonstrated in other patient populations.Reference Triola, Olson and Reis 7 – Reference Yamazaki, Froelicher and Myers 17
The spatial peaks QRS-T angle, although not associated with maximum thickness, did show an association with maximum thickness z-scores, which is the first time this has been demonstrated. Given the paediatric population and the SPQRS-T angle’s association with ventricular arrhythmias – a risk for sudden death in hypertrophic cardiomyopathy – it seems that the association with maximum thickness z-score – another risk factor for sudden death in hypertrophic cardiomyopathy – seems reasonable.
Limitations
This study had certain limitations including the size of the paediatric-aged hypertrophic cardiomyopathy group. This was also a retrospective study, and thus not prospective in nature as would be needed to validate this method.
Conclusion
In our cohort of paediatric-aged hypertrophic cardiomyopathy patients, the SPQRS-T angle was significantly associated with ventricular arrhythmias with high negative predictive value and odds ratio, while the QTc was not. There was also a significant association of the spatial peaks QTS-T angle with septal thickness z-score. Further prospective studies are needed to assess the future predictive value of a large spatial QRS-T angle in paediatric-aged hypertrophic cardiomyopathy patients (Fig 2).
Spatial peaks QRS-T angle (angles) for hypertrophic cardiomyopathy patients with sustained ventricular arrhythmias (VA) and those without VA. p-value is <0.001, which gives a significant difference between the patients.

Acknowledgements
None.
Financial Support
The research received no specific grant from any funding agency, commercial, or not-for-profit sectors.
Conflicts of Interest
None.