1. INTRODUCTION
While linking the two continents geographically, Istanbul has always been the original and striking meeting point of Europe with Asia, and of the East with the West. There are enormous challenges for navigation in the Istanbul Strait due to its geographical, geopolitical and oceanographic structure. One of the challenges is the local marine traffic which crosses from one side to other of the strait. More than 2,100 scheduled and unscheduled crossings take place per day (i.e. more than 700,000 passages a year) in the southern entrance of the Istanbul Strait, where local traffic mostly affects navigation safety (UMA, 2005); these crossings are by passenger and car ferries, passenger boats and sea buses. With the technological developments in ship building and the arrival of Caspian petrol in the international market, there have been important increases in the size and number of ships passing through the Turkish Straits (which comprise the Istanbul Strait, the Canakkale Strait and the Sea of Marmara) and in the variety and abundance of dangerous cargoes. The quantity of petrol and petrol products carried through the Istanbul Strait in a year reached 82 million tons in 1999, 91 million tons in 2000 and 101 million tons in 2001. By the end of 2009, it reached 144·5 million tons. Today, on a daily basis, an average of 150 ships pass through the Istanbul Strait (UMA, 2010). In addition, the intensive tanker traffic has reached a daily average of 25 large tankers, and this is expected to increase to 30 large tankers (UMA, 2005). Certain precautions for safe passage in the Turkish Strait were previously introduced, including the establishment of a Traffic Separation Scheme (TSS) and limiting passage for ships of 200 metres in length or more to daytime only (IMO MSC 63/23, 1994; Maritime Traffic Regulations for the Turkish Straits Region, 1998). In the last 10 years, nearly 350 marine accidents have occurred in Turkey, especially in the Istanbul Strait. Incidents are classified according to the nature of their occurrences as follows: 57% of accidents are collisions, 22% of accidents are grounding, 16% of accidents are stranding, and the rest are due to fire and other reasons (Yurtoren, Reference Yurtoren2004). Collision probabilities (Aydogdu et al, Reference Aydogdu2008) were compared in the Istanbul Strait with Korean waterways in order to illustrate the degree of danger. Collision probabilities were calculated by dividing the number of collisions in a certain time interval by the number of ship movements in a certain area. Collision probabilities for the Istanbul Strait are almost twice as high as Korean waterways when compared with data from 1999 to 2004 (Aydogdu et al., Reference Aydogdu2008). The southern entrance of the Istanbul Strait is considered to be a high risk area due to ship handling difficulties (Inoue and Yurtoren, Reference Inoue and Yurtoren2004). On the basis of these facts and in a further study (Akten, Reference Akten2004), the Istanbul Strait is considered to be a very difficult region for navigational aspects and ship handling difficulties.
In this study, an attempt is made to improve navigation safety by investigating the current marine traffic situation and proposing a counter-measure for local marine traffic in the southern entrance of the Istanbul Strait where the local marine traffic is more congested and poses a threat to navigation safety. In order to devise these counter-measures, Marine Traffic Fast Time Simulation (MTFTS) studies are used to examine the effectiveness of the proposed counter-measures.
2. LITERATURE REVIEW
The manoeuvring performance of large tanker ships in the Istanbul Strait was investigated by utilizing a real-time ship manoeuvring simulation method (Sarioz and Narli, Reference Sarioz and Narli2003). The study was conducted with ship manoeuvring simulation software based on all combinations of environmental factors such as wind, current and wave drift forces. The results indicate that, when realistic environmental conditions are taken into account, the size of ships that can navigate safely in compliance with the TSS lanes is limited.
Possible factors contributing to accidents in the Istanbul Strait were analysed by using the Bayesian method and simulation modelling (Or and Kahraman, Reference Or and Kahraman2002). The conditional maritime accident probabilities in the Istanbul Strait were obtained by applying the Bayesian method. The simulation model took into account the characteristics and the critical traffic rules and behaviour in the Istanbul Strait, and used the conditional accident probabilities determined via the Bayesian method. Simulation results indicated significant increases in the number of accidents in maritime conditions involving higher transit traffic rates, more dense local traffic conditions, a higher percentage of longer ships and/or adverse weather conditions.
The in-depth relation of marine casualties to casualty types, numbers of ships, the localities where most incidents occur, and external factors such as currents and darkness that contribute to marine casualties in the Istanbul Strait were investigated (Akten, Reference Akten2004). The study revealed the major factors in order to suggest possible solutions.
The local traffic intensity and some risk-related parameters in the Istanbul Strait were determined (Atasoy, Reference Atasoy2008). The risks were defined based on environmental stress factors via the Environmental Stress (ES) model.
A real-time maritime traffic support model for safe navigation in the Istanbul Strait was developed (Yazici and Otay, Reference Yazici and Otay2009). A new MATLAB code for the simulation and the Marine GNC Toolbox was applied to analyse vessel hydrodynamics and the auto-pilot model. The casualty probabilities of each trajectory were found after computing the trajectory tree of the vessel by forward-mapping its position distribution with respect to the initial position vector. Within certain restrictions on vessel geometry, the proposed model predicted the safest possible intended course for the transit vessels based on the navigational parameters including position, speed, and course of the vessel. The model was tested in the Istanbul Strait for validation.
The risk profile of maritime accidents in the Istanbul Strait was investigated and then a methodology was developed to minimize human error (Kum, Reference Kum2008). This exposes the potential threats and defines the risk profile based on the geographical and physical specifications of the Istanbul Strait.
Although all of the above papers agree that there are significant navigational risks and ship handling difficulties in the Istanbul Strait, none of them proposes any regulations for local traffic, such as a Local Traffic Separation Scheme (LTSS). Thus, this paper aims to improve navigational safety by offering an LTSS for the Istanbul Strait.
3. METHODOLOGY
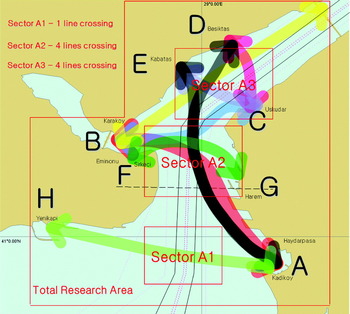
“Safety is a human perceived quality that determines to what extent the management, engineering and operation of a system is free of danger to life, property and the environment” (Chengi, Reference Chengi2007). The ultimate aim of this study is the improvement of navigation safety in the research area. The zone chosen as the research area is shown at Figure 1 and is indicated by the large red outline marked ‘Total Research Area’. Recently, marine traffic density has increased and consequently the navigation risks are greater than before in this zone. 95% of the scheduled and unscheduled local traffic (which can reach up to 2,500 vessels) transport passengers in the southern entrance of the Istanbul Strait.
Pre-defined main traffic flow lines and sectors.

In the previous studies (Aydogdu, Reference Aydogdu2006; Aydogdu et al., Reference Aydogdu2008, Reference Aydogdu2010), traffic flow was investigated and eight main Origin Destinations (OD) were defined as main routes for local marine traffic. The probability of collision and near misses were calculated/ simulated for each OD. Three sectors, namely Sector A1, Sector A2 and Sector A3 where most of encounters and near-miss situations took place, are established within in the Total Research Area. Sector A1, A2 and A3 boundaries are shown by red outlines in Figure 1. In the analysis (Para 4.1), Sector A2 was found to have the highest risk due to high traffic volume. Although Sector A1 has the lowest traffic volume and potential encounters, it has the second highest risk, due to its location at the entrance and exit point of the Strait.
Dangers in the research area were presented by collision probability, expert survey and real-time ship handling simulator studies; the outcomes of those studies showed the necessity of risk reduction. “Risk reduction is term used to describe the moving of a hazard from one location higher on the risk scale to a lower location” (Chengi, Reference Chengi2007). In this study, the Environmental Stress (ES) model, which demonstrates how much difficulty is imposed on a navigator due to the surrounding marine environment by the stress values, is used to scale the risk level and illustrate risk reduction. For this purpose, current marine traffic situations during peak and off-peak times are simulated and analysed by using Marine Traffic Fast Time Simulation (MTFTS), based on Latent ES concept. Afterwards, various Local Traffic Separation Schemes (LTSS) based on expert opinion for local marine traffic are proposed, simulated and analysed in order to demonstrate a decrease in scaled stress value due to ship handling difficulty in the research area.
It is important to be able to assess risk levels in a waterway for the improvement of navigational safety. By using the ES model, the difficulty of ship-handling caused by a restricted manoeuvring area or by surrounding marine traffic or by a combination of both is evaluated (Inoue, Reference Inoue2000). The ES model is preferred in this study as a basis for analysis, as it can numerically demonstrate the current safety level and/or quantitatively calculate the relationship between the measures to be taken, the improvement of safety and the reduction of ship handling difficulties imposed on mariners.
In order to investigate vessel traffic safety, it is necessary to measure how much difficulty is imposed on a navigator due to the surrounding marine environment. As this paper applies MTFTS, the Latent ES (L-ES value) concept (Inoue, Reference Inoue1999) is used. L-ES was introduced to exclude the influence of the individual skill differences and navigator personalities and to guarantee the universality of the results in evaluating shiphandling difficulty. L-ES values are obtained by calculating the stress value, assuming that own ship sails at a fixed speed along a fixed route without making any collision avoidance actions against encountering ships. This is intended to avoid concealing information on stress levels that each encounter would naturally impose on the mariner when taking collision avoidance actions against other ships. The extent of such Latent ES is considered to indicate the necessity for collision avoidance manoeuvres.
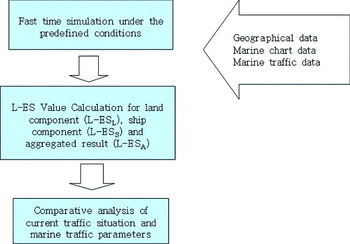
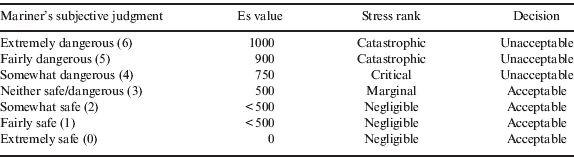
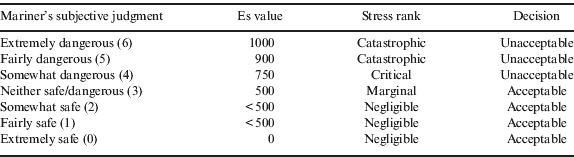
An ES value is an index between 0 and 1,000, and it is classified on four major rankings which are ‘Negligible’, ‘Marginal’, ‘Critical’ and ‘Catastrophic’ levels. Table 1 indicates levels of subjective judgment and their corresponding ES value. Rankings of stress value and the final decision for acceptance are also presented. The empirical works of the present study were accomplished in three steps as shown in Figure 2. MTFTS studies were performed under the predefined conditions such as different marine traffic parameters (i.e. increased number of transit ships, different transit ship lengths and one-way traffic). The L-ES values were calculated for two main components: terrestrial objects as ‘Land’ (L-ES_L) and navigating objects as ‘Ships’ (L-ES_S). An ‘Aggregated’ result of all components were also defined as an (L-ES_A) value.
The design of comparative analysis for study.

Classification of subjective judgment, ES value and final decision (Inoue, Reference Inoue2000).
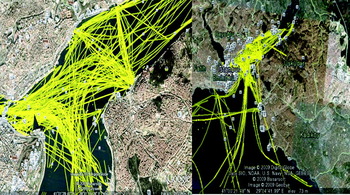
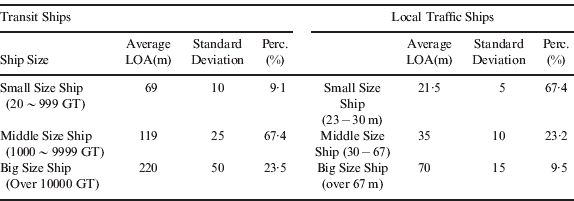
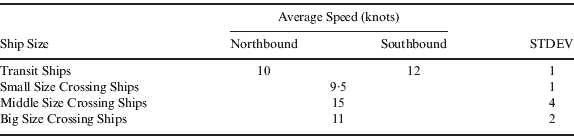
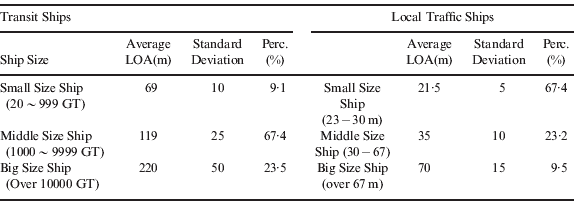
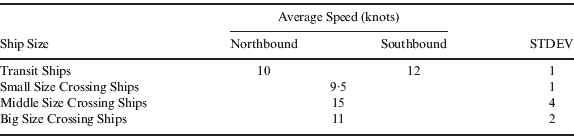
The generation of traffic flow in the Istanbul Strait was carried out based on the data of AIS class A/B which was obtained from Undersecretaries of Maritime Affairs. Two days' data from 24th and 25th of July 2009 were analysed and ships tracks were displayed on a Google Earth program as shown in Figure 3. Since 1st July 2008, it has been mandatory to use an AIS Class B device for local marine traffic vessel in Turkey and this allows the analysis and presentation of actual ship tracks in the research area. The average ships’ lengths, size and speeds are shown in Table 2 and Table 3.
Ship tracks for southern entrance obtained by AIS data.

Ships' LOA input data.
Ships’ speed input data.
The time interval used for ships was decided using an exponential function. The shortest time interval was set up as 10 minutes. The time interval for ferries crossing the Strait was decided by examining the timetables of local traffic vessels.
Generating points of ships are considered to be Gaussian distribution on a gate line orthogonal to the designed standard route, and ships are designed to navigate along the standard route as it is indicated in previous empirical work (Yurtoren and Inoue, Reference Inoue and Yurtoren2004).
Unscheduled vessels such as fishing boats and recreation boats were not included in the study. In addition, times of departure of some shipping lines which have random schedules are assumed to be of uniform distribution.
4. RESULTS
In this study, the total amount of stress imposed on mariners due to ship handling difficulties, which include current local and transiting marine traffic in the Istanbul Strait, was calculated based on ES Model. L-ES values were calculated at regular intervals (15 secs interval), and total stress values were classified by the percentage of unacceptable stress encountered. Stress values were calculated for the ‘Total Research Area’ and also for each of the Sectors A1, A2 and A3 where most of the encounter/near-miss situations took place. Afterwards; three new LTSSs for local marine traffic were proposed and the total amount of stress imposed on the mariner in each case was also calculated and classified. Finally, the amount of stress reduction in the Total Research Area and in each of the Sectors A1, A2 and A3 was determined by comparing the percentage of unacceptable stress occurrence due to current traffic and in the proposed LTSSs.
4.1. Stress Level of Current Marine Traffic in the Research Area
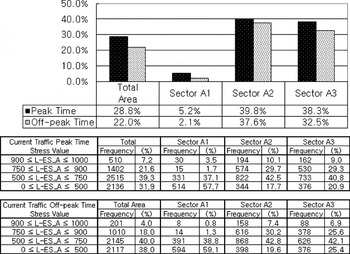
According to the L-ES assessment results, the Total Research Area has a high percentage of unacceptable stress values due to ship handling difficulties. MTFTS studies for the current traffic were carried out; total stress due to ship handling difficulties imposed on mariners in the research area was calculated via the ES Model as shown in Figure 4. The percentage of unacceptable stress occurrences which were above 750 stress value (‘Catastrophic’ and ‘Critical’ levels) are tabulated and shown graphically in Figure 4. Simulation results revealed that 28·8% of current marine traffic imposes unacceptable stress on mariners during peak times and 22·0% during off-peak time.
Stress Levels.

In addition, results revealed that Sector A2 was the most dangerous sector since the percentage of unacceptable stress occurrence was 39·8% during peak time and 37·6% during off-peak time. Due to high numbers of encounters in Sector A2, the percentage of unacceptable stress did not decrease significantly during off peak time, although it decreased significantly in other sectors and in the Total Research Area. This result implies that a decrease of traffic density does not lead to a decrease in the percentage of unacceptable stress occurrence in Sector A2. It also implies the necessity of alternative solutions. Sector A2 is followed by Sector A3 with a percentage of 38·3% unacceptable stress occurrence during peak time and 32·5% during off-peak time. Moreover, Sector A1 has 5·2% unacceptable stress occurrence percentage during peak time and 2·1% during off-peak time.
4.2. Stress Level of Marine Traffic According to Proposed LTSSs
The current navigation scheme in the Istanbul Strait was set by the IMO in 1994 and amended in 1998; neither consider local marine traffic. Local marine traffic has to comply with COLREG Rule 10 for existing traffic conditions in order to negotiate the navigation scheme and pass from one side of the Strait to the other.
In this study, an attempt is made to organize local marine traffic in an LTSS in accordance with COLREG Rule 10 and IMO ships’ routeing. Due to the oceanographic structure of the research area, the unique LTSSs consisting of the following are considered:
• A Traffic Lane.
• A Roundabout.
• A Precautionary Area.
• Recommended direction of traffic flow.
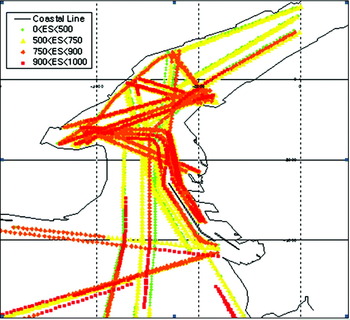
LTSSs for each of Sectors A1, A2 and A3 were proposed and investigated. Proposed LTSSs were prepared based on experts' opinion, the result of the marine traffic survey and the result of ES model analysis of MTFTS of current peak time traffic conditions. In Figure 5, a sample graphic is given which shows catastrophic stress in red, critical stress in orange, marginal stress in yellow and negligible stress in green.
A sample graphic shows ES Model analysis result of current MTFTS.

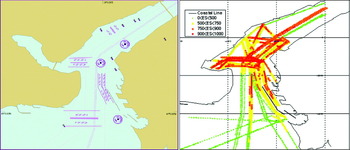
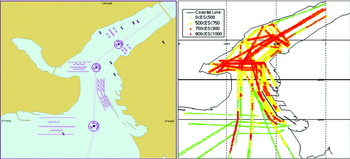
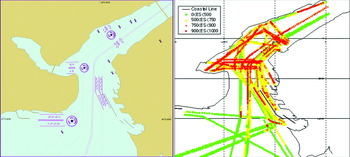
It is proposed to set a lane for Eastbound and Westbound vessels. Thus, the navigator of a transiting vessel could observe and understand local vessel movement which would assist in reducing the potential risk in the research area. Proposed LTSSs and a sample graphic result of each ES model analysis are shown in Figures 6, 7 and 8.
Proposed LTSS 1 (left) and a sample graphical demonstration of ES Model analysis results for proposed LTSS 1 (right).

Proposed LTSS 2 (left) and a sample graphical demonstration of ES Model analysis results for proposed LTSS 2 (right).

Proposed Local TSS 3 (left) and a sample graphical demonstration of ES Model analysis results for proposed LTSS 3 (right).

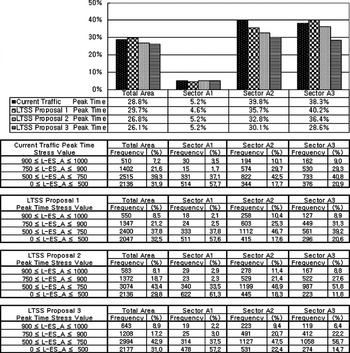
According to results shown in Figure 9, in the case of proposed ‘LTSS1’, the percentage of unacceptable stress occurrence increased to 29·7% in Total Research Area, despite a decrease of unacceptable stress occurrence to 35·7% in Sector A2 and 4·6% in Sector A1. The location of a roundabout in Sector A3 caused traffic to pass too close to The Maiden's Tower (marked by buoy on the chart) and an increase in unacceptable stress occurrence to 40·2%. However, proposed ‘LTSS 1’ is the most effective one to improve marine traffic safety in Sector A1 compared to the other proposals.
L-ES_A stress value classification for current traffic and proposed LTSS.

In the case of proposed ‘LTSS 2’, a decrease in unacceptable stress occurrence to 26·8% in the Total Research Area, 32·8% in Sector A2 and 36·4% in Sector A3 was generated. The percentage of unacceptable stress occurrence remained the same in Sector A1 in the case of proposed ‘LTSS 2’ and ‘LTSS 3’. A decrease in unacceptable stress occurrence to 26·1% in the research area, 30·1% in Sector A2 and 28·6% in Sector A3 was generated in the case of proposed ‘LTSS 3’. According to results of proposed ‘LTSS 2’ and ‘LTSS 3’, the percentage of unacceptable stress occurrence due to ship handling difficulties imposed on mariners decreased in the Total Research Area and in Sectors A2 and A3.
Results of the MTFTS studies revealed that LTSSs contribute to an improvement in marine traffic safety in the southern entrance of Istanbul Strait. Proposed ‘LTSS 1’ is the most effective in improving navigation safety in Sector A1 and, proposed ‘LTSS 3’ is the most effective in Sectors A2 and A3.
5. CONCLUSIONS AND RECOMMENDATIONS
The aim of this study is to improve navigational safety by investigating the current marine traffic and proposing counter-measures for local marine traffic in the southern entrance of the Istanbul Strait. After defining main traffic flow, the Total Research Area was further divided into three sectors; namely Sectors A1, A2 and A3 according to close passing and encounter locations of the local traffic flow. Then, Marine Traffic Fast Time Simulation (MTFTS) studies were utilized. Finally, three different Local Traffic Separation Schemes (LTSSs) were proposed to promote navigation safety in the Istanbul Strait.
Results of this MTFTS study with the current traffic situation revealed that 28·8% of marine traffic imposes unacceptable stress (i.e. above 750 stress value – ‘Catastrophic’ and ‘Critical’ levels) on mariners during peak times and 22·0% during off-peak time in the research area, as shown at Table 4. Sector A2 was determined as being the most dangerous sector because of the number of high encounter situations where unacceptable stress occurrence does not decrease during off-peak times compared with the other sectors and the Total Research Area. In the present situation, local traffic crosses from one side to the other on irregular routes which cause enormous stress to navigators of vessels transiting the Istanbul Strait.
Comparison table for percentage of unacceptable stress occurrences at peak time.

Local Traffic Separation Schemes (LTSS) at three different locations for each of the pre-determined Sectors A1, A2, A3 were proposed, based on IMO recommendation, experts’ opinion, and the results of the marine traffic survey. The results of MTFTS studies show that LTSSs contribute to an improvement in marine traffic safety in the Total Research Area, as shown in Table 4.
According to the results of the MTFTS studies, proposed ‘LTSS 1’ is the most effective to improve navigation safety in Sector A1, and proposed ‘LTSS 3’ is the most effective in Sectors A2 and A3. Even though the differences of the percentage values are small in Total Research Area, the actual number (frequency) of calculated ES values is not a small quantity as the number of ships navigating in the Strait is quite large. Hence, according to the aforementioned results, LTSS implementation is strongly recommended for the improvement of marine traffic safety in the southern entrance of the Istanbul Strait. In particular, navigators of transiting ships would know to which locations East-Westbound local traffic is likely to proceed. Thus, an LTSS would be helpful for improving the situational awareness of navigators of transitting ships.
This study sheds light on several future academic studies and allows the regulatory public organizations to identify the required administrational precautions. For example: the results of this study can further be confirmed using PAWSA (Ports and Waterways Safety Assessment model), developed by the United States Coast Guard to carry out a qualitative Risk Assessment and recommended by IALA (International Association of Marine Aids to Navigation and Lighthouse Authorities) for assessment of waterways safety (IALA, 2008). As the MTFTS used in this study does not have a function to set up specific vessel departure times, only the number of vessels running in an hour can be input; thus a time management study by arranging the departure times of local traffic vessels could not be carried out. However, in future studies, this could be achieved by utilizing a real-time simulator, which could also include the ship handling difficulties imposed on transiting vessel navigators due to congested local marine traffic.
ACKNOWLEDGEMENTS
The authors would like to thanks Professor Inoue, who developed ES Model, for his excellent guidance and for giving an opportunity to utilize the model in this study. The authors would also like to express their sincere appreciation to The Journal of Navigation reviewers for their comments and suggestions that helped to improve the manuscript.