Whilst goat milk and products are still only a niche market in the UK and northern Europe, herd health schemes and milk quality monitoring are becoming more established. The use of cell count data to assess the quality of goats' milk has become more widely used and popular. There has been an introduction of a maximum acceptable bulk milk cell count level in the USA of 1 000 000 cells/ml and maximum acceptable bulk milk cell count levels are under discussion in Europe (Droke et al. Reference Droke, Paape and Di Carlo1993). To achieve and maintain low bulk milk cell counts, good practices are required in the main goat milk producing areas.
Counting cells in goats' milk has some inherent complications. Production of milk in goats is largely apocrine in nature and cytoplasmic particles similar in size to milk somatic cells are normal constituents of goat milk (Dulin et al. Reference Dulin, Paape, Schultze and Weinland1983; Wooding & Peaker, Reference Wooding, Peaker and Linzell1970). In normal, uninfected goat milk neutrophils constitute 45–74% of the cell count in contrast to the cow where the macrophage is the dominant cell type. Normal milk can contain approx. 150 000 cytoplasmic particles per ml and thus procedures that are specific for DNA should be used to obtain accurate cell counts for goat milk (Paape & Capuco, Reference Paape and Capuco1997). Generally it is accepted that cell count increases with infection and also with lactation length and parity (Dulin et al. Reference Dulin, Paape, Schultze and Weinland1983; Luengo et al. Reference Luengo, Sanchez, Corrales, Fernandez and Contreras2004; Moroni et al. Reference Moroni, Pisoni, Ruffo and Boettcher2005). It is also accepted that cell counts of goats may be higher than those seen in cows even if the udder half is uninfected and a cell count of >700 000–1 000 000 cells/ml is taken as indicative of infection (Paape et al. Reference Paape, Poutrel, Contreras, Marco and Capuco2001).
In ewe milk, good correlation between direct smear cell counts and cell counts by Fossomatic in preserved or refrigerated milk and the DeLaval cell counter (DCC) have been recorded (Gonzalo et al. Reference Gonzalo, Martínez, Carriedo and San Primitivo2003; Gonzalo et al. Reference Gonzalo, Linage, Carriedo, Fuente and San Primitivo2006).
The direct microscopic (DM) method described in the relevant standard (ISO 13366/IDF 148), using pyronin Y-methyl green stain, is the reference method for cell counting of goat milk.
Cell counting in most commercial laboratories has been carried out using particle counters e.g. Coulter counter, or more recently by fluoro-optico methods e.g. by Fossomatic instrumentation. The Coulter counter is unsuitable for goat milk cell counting as this method counts particles rather than cell DNA. Therefore the Fossomatic is more appropriate as it is DNA specific (Poutrel & Lerondelle, Reference Poutrel and Lerondelle1983). All methods are currently under review by an IDF/ISO action team.
The DCC method is unique in that the equipment is portable and offers a viable alternative for cell counting on farm. This method uses a single-use cassette per sample which draws up a set volume of milk and uses a DNA-specific technique. The cell nuclei fluoresce and this is detected as a digital image. This is converted by software to give a cell count value.
Repeatability of the DCC has already been determined in cow and sheep milk (Gonzalo et al. Reference Gonzalo, Linage, Carriedo, Fuente and San Primitivo2006; Sarikaya & Bruckmaier, Reference Sarikaya and Bruckmaier2006). The present study sought to show how the DCC method compared with the reference method and what factors might affect the comparison, but was not concerned with the repeatability of the DCC for caprine milk.
Materials and Methods
A 10–13-ml sample of milk was collected from each functioning half udder of 52 goats prior to milking, according to ISD recommendations (IDF, 1981) giving a total of 102 samples. Teats were prepared using pledglets of cotton wool in 70% methylated spirit and each teat was wiped until no visible contamination of the cotton wool was observed. Samples taken were stored at 3–8°C for no more than 12 h until assay. No preservative was added as per instruction book for the DCC (DeLeval, Reference DeLaval2005). This sampling process was carried out at two time points (sampling date), the first sample point used early and late-lactation goats and the second sample point used early and mid-lactation goats.
A 0·01-ml aliquot of milk was pipetted on to a clean microscope slide and spread with a bent needle to give a 10-mm diameter circular smear with an area of 78·5 mm2. Smears were dried at 40–45°C. Smears were then stained with the pyronin Y-methyl green stain, using the following scheme: Carnoy's fixative, 5 min; 50% ethanol, 1 min; 30% ethanol, 1 min; water, 1 min; pyronin Y-methyl green stain, 6 min; brief n-butyl alcohol flush; brief xylene flush. This method stained DNA in the somatic cells blue or blue-green and the RNA of the cytoplasmic particles and the background stained pink.
For each smear, all cells in a field wide strip were counted across the diameter of the smear. Calculation of single strip factor as computed as follows:

The DM somatic cell count (SCC) was determined as:

Each smear was counted by two different readers to give two microscope data points for each sample. There were four microscope readers in total and all readers were blinded to either the duplicate DM reading or DCC.
Milks were analysed at room temperature as per DCC instruction manual. A predetermined volume of milk was drawn up into the single-use cassette. The cassette was placed in the machine and the machine set to run. The result indicates the number of cells/μl of milk and this was multiplied by 1000 to give cells/ml of milk. The range of the cell counter was 10 000–4 000 000 cells/ml. Only one value per milk sample was obtained using DCC.
Milk samples were collected and analysed at two time points from the functioning udder halves of 52 goats. Two goats had only one functioning udder half giving in total 102 half samples. The data generated included two independent DM cell count results and one DCC cell count per sample.
Statistical analysis
All statistical analysis was performed in the Genstat statistical package v 8. 2005, Lawes Agricultural Trust (Rothamsted Experimental Station). Four values exceeded 4 000 000 cells/ml and were removed as statistical outliers, as the DCC cannot reliably enumerate cell counts greater than this. Cell counts were log10-transformed to obtain a normal distribution.
As microscope counts were performed in duplicate the arithmetic mean of the two readings was compared with the cell count obtained from the DCC, using least squares linear regression for all the suitable data.
A general linear model was used to examine the goat, udder-half nested within goat, and the method of counting the cells counts. A factor ‘Method’ was created, with five levels: DCC, microscope reader 1, microscope reader 2, microscope reader 3 and microscope reader 4.
A second general linear model examined the effect of the influence of the four different microscope readers with respect to goat, and udder-half nested within goat on cell count to determine whether individual readers affected microscope cell counts.
Results and Discussion
SCC (±se) obtained by the DM method were: arithmetic mean, 674±53×103/ml and logarithmic mean, 5·66±0·03; and those obtained by the DCC method were: arithmetic mean, 799±59×103/ml and logarithmic mean, 5·56±0·03.
The relationship between DCC and Direct Microscope counts
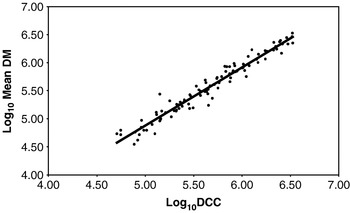
The cell count values obtained with the DCC were significantly positively correlated with the cell count values obtained using the DM method, explaining 95% of the variation in the latter (F 1,199=1080·0; P<0·001; log10 Mean DM=−0·31+1·04 log10 DCC; Fig. 1).
The relationship between the DCC cell counts and the direct microscope (DM) cell counts: Log10 mean DM=−0·31+1·04 log10 DCC; R2 value=95%

Results of the general linear model are presented in Table 1. Taking into account variation due to goat number and goat half udder, DCC values were significantly higher than DM for all four readers (P<0·001). However the mean differences were small (de-transformed 118 000 cells between all readers). SCC was not significantly different between microscope readers (Table 2).
General Linear Model 1:
(a) The influence of method; 4 different microscope readers and the DeLaval Cell Counter (DCC) on cell count

R 2 (adjusted)=88·7%
(b) Parameter estimate, predicted means and standard errors

† Comparison with DCC
The influence of microscope reader on cell count


† Comparison with Reader 1
Concerns have been expressed in the milk supply industry that methods other than the DM method for counting cells in goat milk may be unreliable and produce an artificially elevated cell count due to the secretion of cells and cytoplasmic granules into the milk. Only those methods that are specific for DNA should be used to estimate cell counts in goat milk. Previous studies have indicated no significant difference between the pyronin Y-methyl green microscope method and the Fossomatic (fluro-optical electronic cell counter) but there were significant differences using the Coulter electronic counter and non specific microscope stains (Dulin et al. Reference Dulin, Paape and Wergin1982; Miller et al. Reference Miller, Paape and Action1986). The staining of the milk when using fluoro-optical counting can also influence the cell count obtained; staining with sodium azide as opposed to bronopol results in an underestimation of the cell count (Gonzalo & San Primitivo, Reference Gonzalo and San Primitivo1998). Sodium azide is widely used in various European countries.
The present results demonstrate that the cell counts determined by the direct microscope method correlated well with the cell counts determined using the DCC, which is in broad agreement with correlations for ovine milk (Gonzalo et al. Reference Gonzalo, Linage, Carriedo, Fuente and San Primitivo2006). Further, the results obtained by the two methods do not differ. This is not unexpected as the DCC uses technology specific for DNA detection.
Whereas previous studies report large variability between laboratories and analysts in DM counts, this does not appear to have been the case in the present study. In the present study, all staining was carried out according to the reference method ISO 13366/IDF148 at different time points, and by a different operator for each time point, and the milk smears were read by two of four possible operators. Whilst reader was a significant factor it accounted for <1% of the variation and there were no significant differences between individual readers for the DM method. It has been speculated that the variability derives from operator error, most probably in the counting of cells in the smear, and partly from counting errors arising from inconsistencies in staining and cell identification.
The DCC is a relevant method but is not referred to in the ISO standard (1997). Other methods that use DNA technology (e.g. Fossomatic) can produce artificially inflated cell counts as a result of ‘carry-over’ from high cell count samples that can contaminate subsequent samples (Hillerton et al. Reference Hillerton, Berry, Gravenor and Middleton2004). However this carry-over effect does not exist in the DCC method because each milk sample is analysed using an independent cassette, which is digitally processed. As the range of cell counts in goats can vary considerably and goat milk can have naturally higher cell counts, this could be an important factor.
Both the DM method and the Coulter counter are laboratory based methods and the DCC system offers the possibility of testing on the farm itself. The DM method is time consuming as well as possibly being influenced by operator error. The DCC can generate a result in 45 s, considerably faster than the DM method; it is not influenced by operator and the results do not differ from those generated by the reference method. While initial estimates indicate that the DCC may be slightly more expensive than the Fossomatic counter, the speed of obtaining a value and the fact that it can used on farm may outweigh this. The DCC is a practical option to determine the cell count of milk from goats for quality and udder health determinations.
Conclusion
The reference method for cell counting in goat milk is the DM method, which is a time-consuming and laboratory based method. The DCC offers a field based system to determine the cell count of milk. This study demonstrated that the results generated by the DCC correlated with DM (95%) for undiluted milk. The DCC uses a single-use cassette, and this may offer some advantage over other mechanized cell counting systems.
We gratefully acknowledge the financial assistance and support of DeLaval and the help of Nicola Middleton and Victoria McConkie.