Art seizes the senses, excites the emotions, and enlivens the intellect. Look at Figure 1, a black and white reproduction of a 1967 color gouache by Alexander Calder, in which, in the original version, a large red circle on the right competes for attention with a slightly smaller blue circle on the left, while a heavy black line keeps them apart. As the viewer's gaze moves back and forth between the circles, questions surface about their relationship. The political scientist in me rises up and wonders whether these are distinct groups occupying different parts of geographic or political space. Are they at odds with each other? Does this image represent political division and competition? Does it anticipate the polarization in American politics between Democrats (the blue circle on the left) and Republicans (the red circle on the right)? These questions are not merely fanciful ruminations. They get at our basic understanding of how political scientists think about and depict politics.
“Untitled” with Blue and Red Circles with Solid Black Line: Alexander Calder (1967)Footnote 1

Scientific diagrams also seize the senses, excite the emotions, and stimulate the intellect, although artistic merit is sometimes sacrificed to utility.Footnote 2 Consider Nicolaus Copernicus's heliocentric picture of the solar system that redefined the place of people in the universe; Michael Faraday's magnetic lines of force that elucidated the actions of magnetic force at a distance; Dmitri Mendeleev's periodic table of the elements that revealed the unknown properties of the building blocks of nature; Alfred Marshall's supply and demand curves that illustrated and explicated the impacts of prices and quantities in markets; and James Watson and Francis Crick's double helix that described the structure of DNA and hinted at the way it transmits the genetic code.Footnote 3 Each of these immediately brings to mind an image, a set of ideas, and a bundle of tools for understanding the world.Footnote 4 Each of them is also iconic for its discipline. A glimpse at a heliocentric picture, some lines of force, a periodic table, the intersection of supply and demand curves, or a double helix tells us immediately that we are in the realm of astronomy, electro-magnetism, chemistry, economics, or bio-chemistry respectively. Is there anything like this in political science?
Spatial diagrams of politics could and should be iconic for political science in much the same way as supply-and-demand curves are in economics. Many fundamental problems of political science can be connected with them, and many different concepts—such as ideological constraint, cross-pressures, framing, agenda-setting, political competition, voting systems, and party systems, to name just a few—can be illuminated through spatial diagrams. Spatial diagrams raise questions and provide insights. They suggest political maneuvers, possible realignments, and political problems. They provide us with powerful images that aid memory and facilitate analysis. They are a powerful way to think about politics, and we could do no better than to feature them in our textbooks, to use them in our research, and to exhibit them as our brand—as our distinctive way of thinking about how the world works.
Consider the political science “spatial art” in Figures 2 through 13 for the thirty-year period from 1948 to 1976. This is the spatial art (and these the artists) that I saw as I entered the discipline.Footnote 5 These pictures inspired me with their information content, analytical power, and aesthetic simplicity. I have modified them a bit to make them even more readable—without, I hope, doing damage to the originals. These figures should give you an idea about the objects of my fixation over the past decades. They also provide a visual review of four concepts that will crop up repeatedly throughout this article: spatial models, political cleavages, realignments, and spatial representations.
Spatial model with single peaked preferences: Duncan Black (Reference Black1948)

Spatial model with competing parties: Anthony Downs (Reference Downs1957)

Cleavages in French politics in the 1950s: Maurice Duverger (Reference Duverger1959)

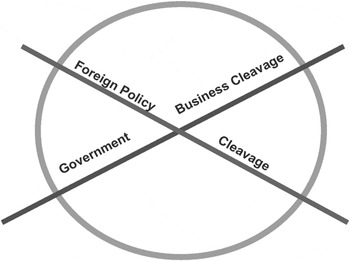
Cleavages in American politics in the 1950s: E.E. Schattschneider (Reference Schattschneider1960)

Realignment in the system of 1896: E. E. Schattschneider (Reference Schattschneider1960, 81)

Spatial representation of the 1960 term of the United States Supreme Court: Glendon Schubert (Reference Schubert1962)

Spatial representation of dimensions of conflict in the Sixteenth General Assembly of the United Nations in 1961–1962: Hayward Alker (Reference Alker1964)

Spatial representation of perceptual distortions in two-dimensional party space as a function of the relative centrality of the dimensions for the perceiver: Philip Converse (Reference Converse, Jennings and Zeigler1966)

Spatial model of the electoral process: Otto Davis, Melvin Hinich, and Peter Ordeshook (Reference Davis, Hinich and Ordeshook1970)

Realignment from a new line of cleavage cutting across an old one: James Sundquist (Reference Sundquist1973)

Cleavages in American politics in the early 1970s: Walter Dean Burnham (Reference Burnham, Chambers and Burnham1975)

Spatial representation of issue consistency: Norman Nie, Sidney Verba, and John Petrocik (Reference Nie, Verba and Petrocik1976)

What Can We Learn from Spatial Representations?
What is the point of these pictures? They embody a spatial logic for understanding politics that goes back at least to the French Revolution of 1789, when the members of the National Assembly divided supporters of the king to the right and supporters of the revolution to the left in the Assembly Chamber. The terms “left” and “right” for political groups have been used ever since. These pictures go farther because they simultaneously identify political factions, represent potential political cleavages, and suggest political dynamics and political realignments based upon Downsian spatial model logics which equate spatial proximity with policy agreement. Let me explain how they do this by considering a picture from an article I wrote about the 2000 election.Footnote 6
Figure 14 uses data from a representative sample of the American public collected in the 2000 American National Election Study. It is clearly a spatial representation of American politics. Household income is listed along the horizontal axis. Religious attendance, in times per year, is listed along the vertical axis. People are located on this picture according to these two socio-demographic characteristics, and the picture assumes that the interests of the American public can be captured by these two dimensions. Those with similar characteristics are assumed to have similar interests, and those with dissimilar characteristics are assumed to have disparate ones. So we get political cleavages between those with higher incomes and those with lower incomes, and between those with greater religious attendance and those with less.
Dimensions of American politics in 2000—Religious attendance and household income: Brady (Reference Brady and Rakove2001)Footnote 7

The position of the average American is the large dot in the middle of the picture, which locates the “center of gravity” of the population. The average positions for the members of various groups are indicated by letters and symbols in the picture. Those groups whose members on average vote Democratic are represented by triangles. An amoeba-like figure in the bottom left of the picture has been drawn around them to represent the Democratic Party's major components. Those groups whose members on average vote Republican are represented by squares. Another amoeba-like figure in the top right has been drawn around them. These figures describe the two interest-group coalitions that form the major American parties or, in James Madison's terminology, our two factions. The American public cleaves into two groups defined by a diagonal line that goes from top-left to bottom right, and those groups that are close to one another tend to be in the same party.
Other factions can be discerned within the parties—African-Americans and Union members are at opposite ends of the Democratic Party (see Figure 15), suggesting, given the spatial logic of interests, that they might sometimes form different factions within the party.
Potential cleavage within the Democratic Party in 2000Footnote 8

And White Christian Fundamentalists and Managers are at opposite ends of the Republican Party (see Figure 16), suggesting that they might sometimes form different factions—a “Christian Right” based upon social issues and a “Wall Street” faction based upon economic interests.
Potential Cleavage within the Republican Party in 2000

Finally, possibilities for realignment or at least for deviating elections are visible in the picture—perhaps White Christian Fundamentalists would vote Democratic under the right circumstances, such as the candidacy of a born-again Jimmy Carter? Perhaps Union members would vote Republican to support Richard Nixon's appeals for order in the cities and an end to busing?Footnote 9 There is, in short, an enormous amount of information in this picture.
Representing factions, cleavages, and realignments in spatial pictures certainly seems worthwhile for political scientists. Political factions have been at the center of political science since Hobbes wrote Leviathan, and they appear in other guises in the works of Plato and Aristotle. Over 200 years ago, in Federalist 10, James Madison famously made controlling the passions of factions the central problem of political science. For factions were composed of “citizens, whether amounting to a majority or a minority of the whole, who are united and actuated by some common impulse of passion, or of interest, adverse to the rights of other citizens, or to the permanent and aggregate interests of the community.”Footnote 10 Madison traced the fundamental causes of faction to different opinions about property—which divides nations “into different classes, actuated by different sentiments and views.”Footnote 11 But faction, he says, also stems from different views about religion and even “the most frivolous and fanciful distinctions.”Footnote 12
Much of modern political science and democratic theory flows from these observations. Robert Dahl, in A Preface to Democratic Theory, begins with Madison and the problem of controlling factions.Footnote 13 Many political science courses and textbooks begin with Federalist 10.
Going Beyond Faction
The ubiquity and menace of factions caused Madison to seek solutions to their machinations in a large republic and in “checks and balances,”Footnote 14 and modern pluralists to seek them in the equipoise, the equilibrium, of contending factional forces—interest groups—in the political arena. As a theory of politics, interest-group pluralism, like free-market economics, had the great advantage of promising a worthwhile outcome if the preconditions of freedom and competition were put in place. But it had the same defects as well—there are many ways that markets can fail, and there are many ways that pluralism can fall short.
One intellectual response to the limits of economics was the Progressive-era impulse to study how real markets actually work by collecting data about them. Another response was the mathematical modeling tradition and its goal of formalizing the concept of the “invisible hand.” The empirical study of markets revealed that they were often highly concentrated, asymmetrical, volatile, thin, and imperfect. The theoretical study of markets led to the identification of market failures such as externalities, public goods, market power, and information asymmetries.
In political science, the behavioral movement, despite its sometimes being bracketed with the pluralist perspective by its critics, stemmed from a similar empirical impulse to see how real politics actually worked. And the rational choice movement sprang from the theoretical goal of seeing whether a political equilibrium with favorable properties, something like the Pareto-optimal market equilibrium, existed even under the best of circumstances. These empirical and theoretical impulses converge in spatial representations of politics which combine theories about interests and choices with empirical data about those interests and choices.
In the last sixty years, the elaboration of four ideas flowing out of these kinds of diagrams has helped to put much more flesh on the Madisonian theory of factions. These four ideas and their sources are:
— political cleavages: behavioralism's approach to identifying the sources of factions.
— spatial representations of politics using scaling methods: another contribution of behavioralism, especially the strand concerned with political methodology,Footnote 15 which presents simplified pictures of the most important sources of cleavages.
— spatial models of politics: a contribution of rational choice theory, which suggests mechanisms whereby citizens choose factions based upon their issue positions and candidates, and parties choose their issue positions to appeal to those citizens. Under some conditions an equilibrium results, and in others cycles and chaos.
— political realignment: a contribution of historical approaches to politics, which provides a macro theory of politics rooted in narrative and history.
Whereas the concept of “factions” is an old one, these four concepts are much newer. Looking at the number of articles in the American Political Science Review that mention “faction” or “factions” over each five-year interval for the past one hundred years (see Figure 17), we find many mentions throughout the period—even in the early twentieth century. Moreover, an examination of the articles suggests that the concept has not undergone a great deal of theoretical development beyond Madison's notion,Footnote 17 except that it is now often restricted to subgroups within parties,Footnote 18 whereas Madison made no such distinction.Footnote 19
Number of mentions of various terms in articles in the APSR for five year periods from 1910 to 2005Footnote 16

Political cleavages were barely mentioned in the initial decades of the twentieth century in the APSR. The first mention in the journal is, somewhat predictably, in a 1914 article about the racial, religious, and political cleavages in the Balkans.Footnote 20 Mentions grew steadily throughout the thirties, forties, and fifties to a peak in the 1960s.Footnote 21
Mentions of terms for scaling methods such as “factor analysis,” “multidimensional scaling,” or “D-Nominate” grew quickly in the 1950s and 1960s, and they have continued to grow. Mentions of the term “realignment” or “realignments” took off in the 1950s and 1960s, after the publication of classic articles by V.O. Key in 1955 and Duncan MacRae and James Meldrum in 1960. Mentions of “spatial model” and its cognates, such as “spatial theory” or the “Downsian model,” did not start to grow until the 1960s, when they took off quite dramatically.Footnote 22
Spatial Representation of a Canadian Election
Let us consider another example to understand the use of these concepts. Figure 18 comes from the 1992 book Letting the People Decide, which I wrote with Richard Johnston, André Blais, and Jean Crête. The picture is based upon data that we collected in the 1988 Canadian parliamentary election that involved Brian Mulroney, the incumbent Conservative, and John Turner, a Liberal. In the years before the election, two major agreements had been negotiated by Mulroney—a free trade agreement with the United States, and the Meech Lake Accord, which was designed to lead to Quebec's ratification of the Canadian Constitution that had been patriated from Britain by Pierre Elliott Trudeau in 1982.
Cleavages in Canadian politics in 1988—Voters and parties in “Pro-Anti US” and “Pro-Anti Quebec” space: Johnston, Blais, Brady, and Crête (Reference Johnston, Blais, Brady and Crête1992)Footnote 23

In this picture, interests are represented by attitudes towards relations with the United States and attitudes towards the place of Quebec in Canada. A detailed analysis showed that these two dimensions captured a great deal about Canadian politics. On the figure, the squares are the average locations of those outside Quebec (in the Rest-Of-Canada) for all respondents and for those in each of the three major parties, the Conservatives, the Liberals, and the socialist New Democratic Party. The triangles are the corresponding positions for those in Quebec. The solid dots are the overall locations of each party.
Several features are immediately clear in this diagram. First, the parties have significantly different positions with respect to relations with the United States, but relatively similar positions with respect to the role of Quebec. Hence, the cleavages across the parties were based upon attitudes towards the United States and not on different attitudes towards Quebec. Second, all parties, especially the Tories, had pro-Quebec and anti-Quebec factions within them. Our book focused on the fact that, despite the availability of two important issue dimensions, the 1988 election revolved around the Free Trade Agreement with the United States and not around the Meech Lake Accord on the place of Quebec in Canada. It focused on cleavages between the parties, and not within them.
By a simplistic reading of the Downsian logic of the median voter, the convergence by all parties on the same position for the role of Quebec in Canada and the Meech Lake Accord seems reasonable, while the spread in positions on sentiment towards the United States seems surprising. But other logics suggest the need for parties to have distinct positions. Furthermore, this is a two-dimensional space, in which Downsian logic is trumped by chaos theorems and cycling majorities, and there are three parties, not the standard two of most first-past-the-post systems. Hence the wonder is that the two major parties essentially colluded on the Meech Lake accord, thus reducing the election to a one-dimensional fight over the median voter with respect to attitudes towards the United States. And the further wonder is that the third party, the NDP, did not defect on Meech Lake, even though doing so might have helped the party gain a lot of seats.
Our book tried to make sense of what was going on here. We argued that the Tories and the Liberals colluded with regard to the place of Quebec because neither had much to gain from activating the factional structure of their caucuses. And the NDP could not exploit anti-French sentiment because of its ideological commitments—the Christian socialism of those in the party made it hard to jettison principles in favor of such a fight, however pragmatic that might have been.
Finally, we noted that the Tory Party was very vulnerable to “third-party” movements that might try to hive off its supporters by emphasizing either anti-French or pro-French sentiment. In fact, while the Tories won 169 of the 295 seats in 1988, they won just two seats in the next election in 1993, because two new parties, the Reform Party in the west and the Bloc Québécois in Quebec, picked off its supporters in just this way. In effect, a realignment had occurred.
All this information, from one diagram!
The Argument
I will argue that spatial pictures like these are iconic for modern political science in much the same way that supply-and-demand curves, indifference curves, and production possibility curves are iconic for microeconomics. The groups and factions that are on these pictures are the suppliers and demanders of political goods. Moreover, in some versions of these diagrams, ideal points and indifference curves appear as the justification for the way that candidates and parties choose to position themselves and people and groups choose to cast their lots with these candidates or parties. Just as the theories of the household and the firm that undergird supply-and-demand curves tell us what will happen if we tax or subsidize a commodity, or if exogenous shifts occur in technology or tastes, these pictures and the theories of citizen, interest group, candidate, and party behavior tell us what happens when political actors take different positions, emphasize one dimension over another, move from one institutional structure to another (such as from a primary with one electorate to a general election with another), or encounter new entrants to the political system (such as third parties). I believe that elaborating and refining these spatial diagrams is an important agenda item for political science. And putting them at the center of our teaching and textbooks provides a powerful and iconic tool for understanding and analysis.
These claims immediately raise this question: Are these diagrams simply powerful metaphors? Or are they something more? I believe and I will argue that they are definitely something more. In fact, for the discipline to come to the point where it could produce and interpret these diagrams, several exceptional empirical and theoretical leaps had to be taken and synthesized into a coherent picture. These include the following beliefs:
— That politics can be usefully represented by dimensions and that people can be placed on these dimensions.
— That a small number of dimensions tell a lot of the story.
— That societies cleave along these dimensionspeople take sides in politics.
— That these dimensions might actually be in people's heads and that people might make calculations about politics based upon their locations and those of others including interest groups, candidates, and parties.
— —That people and parties and others move about these dimensions making rational calculations of advantage.
Political Cleavages and Political Realignments
Let's start with the concept of political cleavages, a concept which appeared in the literature sometime around the 1890s, initially as a way to describe a split in some political groups.Footnote 24 In the next few decades, political commentators moved on to describe political cleavages in terms of oppositions between specific socio-demographic characteristics—the town versus the country, the worker versus the owner, Protestants versus Catholics—or in terms of specific issues—such as socialism versus capitalism, temperance versus “wet,” free-silver versus the gold standard, or protective tariff versus free trade.
The term “cleavage” was borrowed from geology, where it was first used in the early nineteenth century to describe features of rocks, especially crystals and their lines of cleavage. In his Geological Observations on South America published in 1846, Charles Darwin noted: “by the term cleavage I imply those planes of division which render a rock, appearing to the eye quite or nearly homogeneous, fissile.”Footnote 25 That a solidly appearing rock might cleave along invisible lines suggests an important lesson for political scientists who know that fissures sometimes suddenly appear in societies creating factions, discord, and even civil war. Moreover, the mechanism by which this occurs for rocks hints at a way that it might occur in societies. According to Darwin, “the planes of cleavage … are intimately connected with the planes of different tension, to which the area was long subjected.”Footnote 26 Lines of cleavage, it turns out, result from the re-crystallization of materials that are under great pressure.Footnote 27 Similarly, it seems reasonable to suppose that lines of cleavage in societies might have something to do with the pressures socio-economic change, events, and political movements.
The concept of geological cleavages, therefore, provides a useful metaphor for political science by explicitly raising a number of questions about the nature of factions.
— Can politics be thought of as groups of people who can be lined up according to characteristics which produce lines of cleavage between them?
— What are those characteristics?
— Do those characteristics have a historical dimension and are there forces, perhaps affected by history, which determine the planes of cleavage?
Although the cleavage concept does not identify what the relevant characteristics or relevant forces are, it does suggest that we should look for them.
Voting reports and census data broken down by county enabled Stuart Rice, in his path-breaking 1928 book Quantitative Methods in Politics, to look for cleavages. He defined them as situations where the voting support for a candidate differed significantly along some socio-demographic characteristic, such as geographic location within a state demarcated by wheat-growing versus corn-growing regions, or by town versus rural areas, for examples.Footnote 28 He referred to these as “lines of cleavage” and noted that “theoretically the electorate might be divided up in a well-nigh infinite variety of ways.”Footnote 29 Although Rice identifies cleavages, he describes their distinctive features superficially, and he does not explain why they arise, whether their number is limited in any way, or how they operate.Footnote 30 His approach is much like noticing that rocks have lots of lines that go across them and cataloging all of them without differentiation.
In 1935, Peter Odegard provided a theory for cleavages by arguing that they are the result of conflicting group pressures based upon historically determined sectional, economic, and ethnic interests, interests which can be traced historically.Footnote 31 In his account of these pressures, the master sources of interests in America were class, slavery, and ethnic solidarity, which created economic, sectional, and ethnic interests in the early republic.Footnote 32 Odegard's approach to cleavages is not so baldly nominal and operational as Rice's, and there is a hint in his account of macro conflicts and pressures that arouse interests which are otherwise latent in people. He tries to root cleavages in interests, but he still leaves the door open to a very large number of possible rifts.
In 1952, however, E. E. Schattschneider argued that “an indefinite multiplication of conflicts is extremely unlikely even in a free political system.”Footnote 33 He reasoned as follows: “This multiplication of conflicts in a free society is restricted by the fact that conflicts interfere with each other, because the lines of cleavage never or rarely coincide. In an extreme case, lines of cleavage may cross each other at right angles, and may tend therefore to neutralize each other completely or to subordinate one conflict to the other. If the conflicts in this case are of equal intensity, they will tend strongly to immobilize everyone. On the other hand, if they are of unequal intensity, the more intense will blot out the less intense conflict…. Not only do conflicts compete with each other, but the more intense conflicts suppress or subordinate or blot out the less intense.”Footnote 34
Schattschneider provided an explanation as to why we might be able to focus on a small number of cleavages, and he used pictures to describe important cleavages and how they might change over time. As far as I can tell, he was the first to do so.
In the Semi-Sovereign People, published in 1960, Schattschneider described American politics in 1960 as split by two cleavages—a familiar economic cleavage on the role of government versus business, and the Cold War foreign policy cleavage (see Figure 5). He also explained the realignment of 1896 as the result of the interaction of two cleavages—the old Civil War Reconstruction cleavage, and a new agrarian radical cleavage (see Figure 6). These pictures were a tremendous step forward pictorially because they suggested that people located themselves in some kind of issue space, but Schattschneider did not explain the mechanisms underlying his results about realignment, which apparently relied more upon his broad and deep understanding of American politics than any particular theory of politics.
Around this same time in 1959, Maurice DuvergerFootnote 35 discussed the formation of multi-party systems in terms of internal divisions and cleavages within existing parties, and overlapping cleavages across existing parties. He started from the premise that political dualism was the norm, and that multi-partism resulted from rivalries within existing parties or from the “non-coincidence of a number of different dualisms of opinion with the result that their combinations produce a multi-partite division.” This led him to the representation in Figure 4 for French politics. In 1975, Walter Dean Burnham (Figure 12) put forth a similar idea with respect to American politics, and argued that “through a combination of contextual stress (including egregious ‘imperial’ decisions by political elites, such as those that took us into Vietnam) and social change, the electorate is now polarized across at least two orthogonal dimensions.”Footnote 36 Finally, James SundquistFootnote 37 (Figure 11) built upon the historically-motivated ideas of V.O. Key, Angus Campbell, William Chambers, and Walter Dean Burnham, among others,Footnote 38 to propose that the emergence of new cross-cutting cleavages as a result of demographic change or individual conversion could account for partisan realignments. Sundquist discussed some of the ways this could lead to new party systems—new issues could come to the fore and lead to realignment of the existing parties along new issue axes; issue-based third parties could be absorbed by an existing party; an existing party could be replaced by a new one; or both parties could be replaced by new ones. He then examined the realignments of the 1850s, the 1890s, and the 1930s using these ideas.Footnote 39
These analyses emphasize the linkage of cleavages to underlying characteristics of the electorate and the likelihood that these characteristics would change over time so that political and party systems could be transformed. Although party leadership is sometimes mentioned as a causal force in these transformations (most notably by SundquistFootnote 40), it is typically given short shrift. Key's viewpoint is typical when he refers to “frequent serious upheavals within the electorate.”Footnote 41 Only with the development of Downsian spatial models would party actions become central to the spatial understanding of politics.
Important Cleavages in American Politics
How should we identify and define cleavages in American politics? Consider Figure 19, which, like the earlier one about American politics (Figure 14), uses American National Election Studies data to describe the political situation in 2000, except that it employs attitudinal dimensions—economic conservatism and moral conservatism—instead of household income and religious attendance.Footnote 43 These dimensions were constructed from answers to a number of questions using a simple scaling method—factor analysis.
Issue dimensions of American politics and mean positions of groups in 2000: Brady (Reference Brady and Rakove2001)Footnote 42
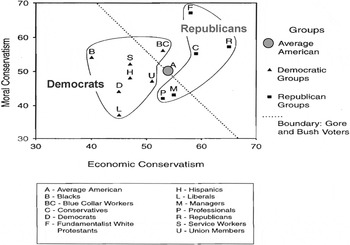
Is this picture a better or worse way to think about American politics than the picture with income and religious attendance? Of course there are reasons to believe that moral conservatism is related to church attendance and that economic conservatism is related to household income, but which one, the issue dimension or the socio-demographic dimension, really gets at the heart of American politics? And are these the right two dimensions?
Let's start by asking whether these are the right issue dimensions. Many writers agree that the major issue dimensions today in American politics are economic issues and social/cultural/moral issues, but only episodically foreign policy.Footnote 44 Foreign policy can be set aside for a number of reasons, such as its “elite” nature, the lack of clear-cut groups that have obvious and firm opinions on any given foreign policy issue,Footnote 45 its overall volatility, and perhaps even its relationship to social/cultural/moral issues.Footnote 46
We can see the importance of the first two major issue cleavages as far back as 1972 using the American National Election Studies, because four relevant items have been repeated in surveys conducted since then. Two of them, the “government guaranteed jobs” question and the “government aid to blacks” question are highly correlated and represent an economic dimension. Two others, on the social role of women and on abortion, are also highly correlated.Footnote 47
Are these dimensions important for American politics? When we regress the classic Michigan seven-point party identification scale (where 1 is “strong Democrat” and 7 is “strong Republican”) on the two issue scales from 1972 to 2004, we get an R-squared of about .10, suggesting that about 10% of the variance in party identification is explained by these two dimensions. Is this a little or a lot? I think it is enough, but it does raise the question of whether other dimensions should be considered.
Rather than pursuing this important, but contentious, question of how fully American politics can be described in terms of these two dimensions, I will turn to whether we should focus on socio-demographic or issue dimensions. When we regress the seven-point party identification scale on the socio-demographic dimensions of household income and religious attendance, we get statistically significant, but much smaller effects, and the overall R-squared is about 3%—less than one-third of what we got for issues. Indeed, there are lots of reasons to believe that socio-demographic characteristics belong further back in the “funnel of causality” than issues, and it is not surprising to see that they are less-powerful predictors of party identification.
And it seems quite possible that there can be socio-demographic differences without attitudinal differences, and there can be attitudinal differences without political differences. In the 1970s, for example, neither religious attendance nor social-moral conservatism was significantly related to political party differences. In the spatial diagram depicted in Figure 20, the dot on the left for Democrats and the dot on the right for Republicans are at the same vertical level on the diagram for the 1972 to 1982 decade—the only substantial difference is on the horizontal economic dimension. The line of cleavage is the vertical line that bisects the economic dimension.
Issue cleavage in American politics 1972–1982Footnote 48

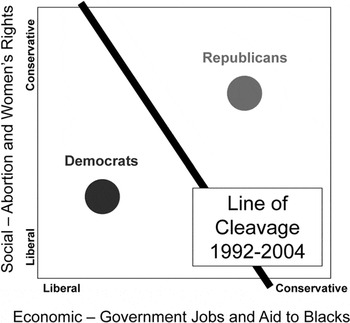
Consider what happens when we move to the period 1992 to 2004, depicted in Figure 21. The line of cleavage is now a diagonal line, just as in our earlier pictures of American politics. Moreover, we get approximately the same result if we use religious attendance and household income. And by the way, does this picture look familiar? Does it look like a poor person's version of Figure 1?
Issue cleavage in American politics 1992–2004Footnote 49

This diagram reveals a political cleavage in formation from 1972 to the present time. In both periods there was significant variation in religious attendance, and in both periods this variation was strongly related to social-moral conservatism. But in the first period, the religious-attendance cleavage and the social-issues cleavage were not related to party identification. Religious attendance and social-moral conservatism represented a potential, but not an actual, political cleavage. One of the most interesting questions about American politics is how this new political cleavage developed between the 1970s and today.
Dynamic Development of Cleavages
Potential cleavages, such as differences in religious attendance or even social-moral conservatism, do not necessarily immediately crystallize into political conflicts, political movements, and political parties. Their activation requires the coordination of individual desires, perceptions, and actions. In a 1977 article, Stein Rokkan outlined six steps in the translation process from the initial generation of cleavages to the final policy response:
1. “First, the initial generation of cleavage lines through such macro-processes as monetization and urbanization, industrialization and secularization”;
2. “secondly, the crystallization of cleavage lines in conflicts over public policy”;
3. “thirdly, the emergence of alliances of political entrepreneurs actively engaged in the mobilization of support for one set of policies against another”;
4. “fourthly, the choices of mobilization strategies made by such entrepreneurs' actions through pre-established community networks versus action through the development of distinct membership organizations”;
5. “fifthly, the choice of arenas for the confrontation of mobilized resources” such as voting versus demonstrations;
6. “and finally, the actual pay-offs of such concerted efforts.”Footnote 50
The first step is important because it defines the possible range of potential political cleavages. Seymour Martin Lipset and Stein Rokkan famously discussed this first step—the generation of potential cleavages through macro-processes—in their 1967 article on “Cleavage Structures, Party Systems, and Voter Alignments.”Footnote 51 In a complex stew of structural-functional arguments, historical narratives, and typological comparisons across many different countries, Lipset and Rokkan proposed that historically there had been four critical junctures where major cleavages had arisen:
1. national revolutions, such as the Reformation and Counter-Reformation in the sixteenth and seventeenth centuries, leading to the Center versus Periphery cleavage;
2. the French and Democratic Revolutions in the late eighteenth and throughout the nineteenth centuries, leading to a cleavage between the Church and the Secular state;
3. the Industrial Revolution in the nineteenth century, leading to a cleavage between Land and Industry; and
4. the Russian and Communist Revolutions in the twentieth century, leading to a cleavage between Owners and Workers.Footnote 52
With this analytical framework in hand, Lipset and Rokkan went on to classify the political and party systems of most of the industrialized countries as of 1967. Figure 22 presents their schema.
Four critical historical cleavages suggested by the Parsonian AGIL paradigm: Lipset and Rokkan (Reference Lipset, Rokkan, Lipset and Rokkan1967)Footnote 53

The Lipset-Rokkan framework is a powerful mnemonic typology, and it brings some order to our description of Western party systems, but unlike the periodic table of the elements, it does not go far in predicting the properties of those systems. Moreover, ethnic cleavages fit uneasily within this historical schema, because many ethnicities—such as Italian, Estonian, Lithuanian, Latvian, Kirghiz, or Kazakh—can only be easily traced back to the nineteenth or even the twentieth centuries, despite any claims to the contrary. Perhaps the model's greatest usefulness is that it stresses the importance of history and major socio-demographic fissures in creating potentials for political cleavages.
The Emergence of a Political Cleavage
A great deal of political science in the last forty years has concerned itself with how potential cleavages, especially ethnic cleavages, become actual ones, typically through the actions of elites. Perhaps nowhere was this more important than in the satellites and Republics of the former Soviet Union. How did the existing, but repressed and plastered-over, cleavages in the Soviet Union crystallize into conflicts, then into alliances of political entrepreneurs, then mobilization by these entrepreneurs, and ultimately into elite reactions?
Cynthia Kaplan and IFootnote 54 have been trying to understand the process of identity formation and the development of political movements based upon ethnicity in the former Soviet Union, especially in the Baltic Republic of Estonia. Using survey data we show that the two major groups in Estonia, Russians and Estonians, not only spoke different languages and had different religions, they were also very isolated from one another—over 40% of Estonians and Russians had no relatives, friends, neighbors, or even co-workers of the other nationality. There was an obvious socio-demographic cleavage, but until 1986, there was no obvious political rift between the two groups.
As Perestroika developed under Gorbachev, the Popular Front—a “Reform” group involving both Estonians and Russians—was the first significant social movement in Estonia. The Popular Front favored greater autonomy for Estonia, but it did not initially advocate independence. A smaller group, the “Restorationists,” wanted to restore the inter-war independent Estonian Republic, but they initially had very little support. We show how, through a series of steps, the independence agenda of the Restorationists won out over the Reformers.
Using an extensive dataset of political events, such as demonstrations and meetings, coded from newspaper accounts, we show that the two movements held distinct events and used very different symbols and arguments to frame their positions. The Restorationists appealed to ethnic identity, and they argued that Estonia's problem was one of ethnic survival, for which independence was the only solution. The Popular Front argued that some economic and political autonomy for Estonia would be a much better path. The Restorationists slowly but surely won this “framing competition.” Figure 23 shows how the Restorationists' share of political events in Estonia grew from around 10% in 1988 to over 80% in 1991. Their share of political activity grew because they appealed to a very deep-seated sense of Estonian ethnic identity. In short, through demonstrations and protests, they played on the social distance between Russians and Estonians, and on Estonians' fears for their survival, given their small numbers relative to Russians. The result was growing sentiment and support for independence. In the framing competition between the two movements, the ethnic identity frame of the Restorationists won out over the economic autonomy frame of the Reformers.
Restorationists' share of political events in Estonia 1988–1991Footnote 55

One way to think about this story is that the Restorationists made a pre-existing socio-demographic cleavage more and more salient, until it determined the position of Estonians on a political dimension having to do with Estonia's place in or out of the Soviet Union. But another way to think about it is that Estonian social identity was reconstructed so that individuals came to believe that they had an Estonian (and not a “Soviet”) identity and that it had political implications. Moreover, others (such as Russians in Estonia, but even other Estonians themselves) came to believe that there was such an identity and that Estonians thought it was important. Then, in turn, Estonians came to believe that others believed that they had this identity, and so forth. Thus, any analysis of a situation must take into account not only what each person thinks about themselves, but what each person thinks about each other person, and what each person thinks each other person thinks about them, and so on. In game theory, the notion that everyone has the same knowledge about everyone else and so forth is called “common knowledge,” and studying how common knowledge develops and the implications of departures from it is a vigorous field of investigation in game theory.Footnote 56 The study of these departures links game theory, constructivism, and some ethnographic approaches.
Spatial Representations and Spatial Models
This brings us to perhaps the most important steps that have been taken with respect to spatial models in the past sixty years. There has been a growing presumption that spatial diagrams are not only convenient ways to represent cleavages in political systems; they actually provide a model of what goes on when citizens, candidates, and other political actors make decisions. Duncan Black in 1948 may have been the first person to explicitly suggest that “motions” in a legislature might be placed along a one-dimensional axis, and that individual legislators might have “single-peaked” preferences or “utility functions” with respect to these motions (see Figure 2). He showed that under these conditions the median position would win. Anthony Downs followed suit with his model of a unidimensional issue space in which parties took positions and in which each voter had an ideal point (see Figure 3).Footnote 57 Davis, Hinich, and Ordeshook developed models with multi-dimensional distributions of voters and bowl-shaped loss or utility functions (see Figure 10).Footnote 58
A 1966 article by Philip Converse connected this work directly with the psychometric work of Clyde Coombs and others who had developed “scaling” and “unfolding” methods for analyzing people's preferences (see Figure 9).Footnote 59 The 1976 book by Norman Nie, Sidney Verba, and John Petrocik used a two dimensional issue space (Figure 13) to discuss candidate positioning in an issue space, ideological consistency among voters, and issue voting. In other work (see Figures 7 and 8) scaling methods such as factor analysis were used to analyze the dimensionality of Supreme Court decisions or votes in the United Nations.Footnote 60 In effect, these efforts mapped the minds of voters, Supreme Court justices, and delegates to the United Nations.
These models made tremendous theoretical leaps by assuming that people made decisions about politics as if they had well-behaved utility (or loss) functions based upon a spatial representation of alternatives. But many assumptions had to hold for this to be true. For preferences to be representable by a utility function, it must be true that choices are transitive, so that a numerical function can represent them. If the shape of the utility function is to have the single-peak that Black assumes, further assumptions still are required. And finally, one must believe that utilities follow spatial positions, and not the reverse.
I spent part of my research career checking out these assumptions. In a 1989 paper written with Stephen Ansolabehere entitled “On the Nature of Utility Functions in Mass Publics,” we tested the transitivity assumption and found strong evidence for transitive preference—people do not seem to prefer A to B and B to C but C to A. They do not contradict themselves. But we also found that people might very well be indifferent between A and B and between B and C, and yet prefer A to C—they had intransitive indifference. Perhaps A and B were too close to distinguish, as were B and C, but A and C might be easily distinguished. My conclusion from these results is that they are good enough to suggest that utility functions do exist, but they also suggest that information plays a particularly important role in politics, because it helps to resolve intransitive indifference.
In another paper written in 1991 called “Traits versus Issues,” I tested whether the underlying dimensions for preferences over candidates were their issue positions, for which ideal points typically make sense (so that a candidate could be too liberal as well as not liberal enough), or their traits like honesty and competence, for which more always seems better (as is the case with most economic goods). I concluded that there was good evidence that candidates were judged on their issue positions (but perhaps sometimes on their traits as well). These results, however, are hardly the final word, and there is some important psychological evidence suggesting that people do not make similarity judgments using dimensional models.Footnote 61
Finally, in a 1985 paper entitled “Attitude Attribution,” Paul Sniderman and I investigated a model which allowed for psychological balancing, such that utility evaluations and issue placements for groups could have a reciprocal effect on one another. We found that not only did people's utility evaluations of groups depend upon where they thought groups stood on issues, their placements of groups depended upon how they evaluated the groups. Utility is therefore not just a function of issue positions. The perceptions of issue positions are a function of how people feel about the groups being placed. In the last twenty-five years, there has been a great deal of additional research looking at how emotions, evaluations, and perceptions are intertwined in complicated ways.
Yet the allure of utility models that yield spatial representations is very great. Part of the allure is that the relatively hard data of preferences and choices are modeled directly. Another part of the attraction is that scaling methods are used to “get inside people's heads” to tell us what they might be thinking. And, of course, the final part is that they yield useful and pretty pictures.
Figure 24 shows the results of the “Dimensional Analysis of Ranking Data” that I performed in 1990, based upon how 1200 participants in the Iowa caucuses in 1984 ranked eight candidates. Like all dimensional reduction techniques akin to factor analysis, this method yielded a number of dimensions that had to be given some interpretation using other information. In this case, a “left-right” liberal-conservative dimension seemed plausible along the horizontal axis (but was Walter Mondale really further to the left than Jesse Jackson and George McGovern?), and a “viability” dimension for the likelihood of winning the nomination (which was then a novel idea) for winning the nomination seemed plausible for the vertical axis. The emergence of this second dimension in this analysis helped to validate theories that emphasized the importance of viability in the dynamics of the presidential nominating process.Footnote 63 Scaling methods such as this have now been greatly improved in the widely used D-Nominate program.Footnote 64
Dimensional analysis of ranking data from Iowa caucus participants in 1984: Brady (Reference Brady1990)Footnote 62

Are there Conceptual Spaces in the Mind?
So far we have not confronted a fundamental question with respect to spatial models—do they represent processes in people's brains? Moreover, do people actually have shared models in the sense that they have a common understanding of politics?
Let's start with the idea that people might have spatial models in their heads. This idea was forcefully propounded by Jean LaPonce in his 1981 book, Left and Right: The Topography of Political Perceptions. Now, almost 30 years later, there is a burgeoning psychological literature on what we might describe as “what goes on in people's heads.” My graduate student colleague Alex Theodoridis has guided me through this literature.
If we adopt Milton Friedman's position on “the methodology of positive economics” then the realism or lack of realism in assuming a spatial model does not matter. All that matters is its predictive capability. But increasingly, economists have found that neuroeconomic models provide both a useful confirmation of the general tenets of expected utility theory while providing interesting explanations for the well-known deviations from that theory.Footnote 65 Neuroeconomics suggests that neural processes related to utility functions may very well exist, but that sometimes there are peculiarities of encoding stimuli, such as those suggested by Kahneman and Tversky's prospect theory, which affect choices. I believe that the nature of this encoding process is very important for political science. Do people actually think of political candidates and parties as points in some political space? How do they conceptualize candidates and parties?
In a provocative book called Conceptual Spaces: The Geometry of Thought, Peter GärdenforsFootnote 66 has argued compellingly for the spatial source of at least some concepts. In between the symbolic processing systems in people's brains, for which there is a lot of evidence, and the connectionist and associationist models based upon neutral networks and neurons, for which there is also a lot of evidence, Gärdenfors thinks there must be a conceptual system based upon spatial representations. He musters a great deal of evidence for this. Some of it is negative—symbolic processing systems simply assume that concepts exist, while associationist models take far too long to form concepts. Some of it is positive—there is strong evidence that colors, sounds, and tastes can be represented spatially. The research in this area is in its infancy,Footnote 67 but it would be fascinating if human beings conceptualized politics in terms of spatial models. More evidence in favor of this hypothesis is that the language of politics is filled with spatial terminology, such as parties on the “left and right,” groups that are “close to one another” or “far apart,” and candidates “positioning” themselves.” And a great deal of political discourse is about clarifying these positions and creating a common understanding of where people stand.
Spatial Modeling
If we accept the notion that spatial representations make sense, then we can use the powerful results of game theory and formal modeling to analyze the strategic behavior of parties and candidates who can choose positions in political space to maximize their chances of achieving their goals. Perhaps the most interesting results from this addition of strategic parties to the spatial understanding of politics has been the realization that the structure of party systems depends as much (and maybe even more) upon the nature of the voting system as it does upon the cleavages that are present in the electorate. Gary Cox's workFootnote 68 has gone the farthest in developing these theoretical results, and Arend LijphartFootnote 69 has provided abundant empirical evidence. Recent efforts have begun to combine these two approaches to show that both matter.Footnote 70
The outpouring of results from combining the study of cleavages, realignments, spatial representations, and spatial models is enormous, and it would be impossible to review all the relevant findings. But the continuing efforts to understand the possibilities of political equilibrium in these models with all of their problems of cycles and chaos have produced an immensely fertile literature on structure-induced equilibria, heresthetics, new solution concepts for electoral games, probabilistic voting, restrictions on party and candidate movements, restrictions on voter preferences, and greater modeling of institutional details.
Instead of pursuing those results, let me end with a brief discussion of the role of the median voter in American politics. This discussion is taken from joint work with Sidney Verba and Kay Schlozman. As we all know, in An Economic Theory of Democracy, Anthony Downs proposed that political preferences could typically be described by voters' locations along a single dimension such as degree of “liberalism-conservatism” or “family income.” Downs argued that rational, vote-maximizing parties—and, presumably, their candidates—in two-party systems have incentives to converge at the preferences of the median voter along this dimension. The median voter would be the person with the median income if politics is mostly about income distribution. Downs went on to argue that where the principle of one person, one vote obtains and income is the major determinant of preferences, redistributive economic policies are likely to ensue, because of this convergence of parties to the median income and because of the fact that for typically right-skewed income distributions, the mean income will be much higher than that of the median citizen.Footnote 71 Hence it pays parties to promise to take money from the rich to give to the poor to bring the mean income towards the median income. In America, the mean income of families is certainly higher than the median income, as shown in Figure 25 using data from the 1991 Citizen Participation Survey.
Where is the true Downsian median?Footnote 72

As a result, parties and candidates will have incentives to redistribute income from the rich to those with lower incomes whose votes can be bought through this redistribution—just as Alexander Hamilton feared would happen in a democracy. This prediction implies that inequality should be greatly ameliorated in American politics through governmental policies. But political outcomes in America do not follow the Downsian logic. Public policies are not very redistributive compared to other countries.
Why is this so? Many explanations are possible, but one simple one is that politicians do not listen to the median voter. Instead, the median income of campaign workers, or the median income of political donors, or even the income of the donor of the median dollar may matter most of all. When we consider these people, we get Figure 25.
So the median income of campaign donors and the median income of the contributor of the median campaign dollar is to the right of the mean family income—suggesting that politicians may ignore the median voter in favor of those who provide campaigns with what Jesse Unruh famously called the “mother's milk of politics”: money.
Not only is the median income of those who participate actively in politics far to the right of the average American, politics in the United States is even more polarized today if we consider those party identifies who give time or money to campaigns, and not just all party identifiers. In Figure 26, we see that in the 1972–1984 period, all Democrats and all Republicans who gave time or money were more polarized than all Democrats and all Republicans.
Polarization in American politics in 1972–1984Footnote 73

And Figure 27 shows that polarization has gotten worse among all party identifiers and especially among activists who give time or money. These pictures provide an immediate and powerful sense of the degree to which American politics has become polarized, and they provide tools for understanding how this has happened.
Changing polarization in American politics from 1972–84 to 1992–04Footnote 74

Conclusions
Spatial diagrams of politics—drawing as they do from the literatures on political cleavages, electoral realignments, spatial representations, and spatial models—can and should be iconic for political science in much the same way as supply-and-demand curves are for economics. Many fundamental problems of political science can be illustrated with them, and they produce insightful models of political events and processes. These models elucidate a great variety of different phenomena, such as ideological constraint, cross-pressures, framing, agenda setting, political competition, voting systems, party systems, and political polarization.
Spatial diagrams raise questions and provide insights, revealing the mainsprings of politics. They suggest political maneuvers, likely realignments, and political problems. They are a powerful way to think about and understand politics. Political science will prosper and progress by using them in its textbooks, employing them in its research, and exhibiting them as its brand—as the political scientist's distinctive way of thinking about how the world works. Spatial diagrams are the art of political science!