Introduction
Fetal lipid metabolism is crucial for growth and development and highly dependent on maternal lipid supply. The fetus, unable to synthesize sufficient amounts of essential fatty acids, relies on maternal triglyceride-rich lipoproteins and non-esterified fatty acids (NEFA) as sources of free fatty acids (FFA).Reference Woollett 1 While NEFA are directly transferred to the fetus through diffusion or via placenta fatty acid binding proteins,Reference Gil-Sanchez, Koletzko and Larque 2 triglycerides (TG) from lipoproteins first need to be hydrolyzed into FFA by placental lipases. Endothelial lipase (LIPG) and lipoprotein lipase (LPL) both contribute to most of the transfer of FFA from maternal lipoproteins to the fetus.Reference Larque, Demmelmair and Gil-Sanchez 3 The LIPG is a phospholipase with a low TG lipase activity, which mainly hydrolyzes phospholipids from high-density lipoproteins (HDL). In contrast, the placental LPL is a TG lipase and mainly hydrolyses maternal lipoproteins enriched in TG such as chylomicrons and very low-density lipoproteins (VLDL).Reference McCoy, Sun and Marchadier 4 Impaired placental LPL gene expression and activity were previously associated with gestational conditions characterized by a suboptimal in utero environment and fetal development. Gestational diabetes mellitus (GDM) was associated with lower LPL mRNA levels whereas higher LPL mRNA levels were observed in cases of intra-uterine growth restriction (IUGR).Reference Radaelli, Lepercq and Varastehpour 5 – Reference Gauster, Hiden and Blaschitz 7 This suggests that disturbances of placental LPL impair materno-fetal lipid transfer, fetal fat accretion, growth and development.Reference Magnusson-Olsson, Hamark and Ericsson 8 Fetal conditions previously associated with increased long-term risk for obesity and metabolic disorders in the newborn.Reference Chernausek 9 , Reference Barker 10
In line with these observations, we propose that maternal metabolic status could impair placenta’s LPL DNA methylation profile possibly contributing to fetal metabolic programming. DNA methylation is the most stable and studied epigenetic mark. The addition of a methyl group at position 5′ of the pyrimidine ring of the cytosines upstream of a guanine (dinucleotide CpG) is catalyzed by DNA methyltransferases.Reference Bestor 11 DNA methylation regulates transcriptional activity and is generally associated with gene expression repression.Reference Bird and Wolffe 12 The methylation of cytosines is sensitive to environmental stimuli including the intra-uterine environment.Reference Tobi, Lumey and Talens 13 , Reference Heijmans, Tobi, Lumey and Slagboom 14 The placenta methylome has been shown to adapt to the intra-uterine environment to support adequate fetal development and seems to be involved in the regulation of gene expression, placentation, fetal growth and birth weight.Reference Yuen, Avila and Penaherrera 15 , Reference Turan, Ghalwash and Katari 16 Likewise, we have previously reported alterations in DNA methylation profiles of leptin and adiponectin genes in placenta of newborn exposed, in utero, to maternal hyperglycemia.Reference Bouchard, Thibault and Guay 17 , Reference Bouchard, Hivert and Guay 18
This study was conducted to verify whether placental LPL DNA methylation levels are associated with GDM and both maternal and cord blood lipid profile. In addition, we have investigated whether placental LPL gene DNA methylation was correlated with its expression levels. Considering the importance of LPL in materno-fetal lipid metabolism, changes in placental LPL gene expression through DNA methylation variation could impair fetal lipid supply, affect fetal growth and development, and potentially be involved in fetal metabolic programming.
Method
One hundred twenty-six Caucasian pregnant women were recruited in the Saguenay region. Women aged over 40 years old as well as those that had a positive history of drug or alcohol abuses during the current pregnancy, pre-gestational type 1 or 2 diabetes, polycystic ovary syndrome, hypercholesterolemia, morbid obesity [body mass index (BMI) >40] or those who gave birth prematurely (gestational age<37 weeks) were excluded. The Chicoutimi Hospital Ethics Committee approved the project. All subjects provided a written informed consent before their inclusion in the study, and all clinical data were de-identified. This project was conducted in accordance with the Declaration of Helsinki.
Participants were followed at weeks 10–14 as well as at weeks 24–28 and 36–39. At each visit, anthropometric parameters were measured and recorded by a research nurse according to standard procedures.Reference Lohman 19 Blood samples were collected at each trimester following a 12-h overnight fast. At delivery, placenta biopsies and cord blood samples were collected. All glucose and insulin concentrations were assessed on fresh serum samples at the Chicoutimi Hospital Clinical Laboratory. Insulin measurements were performed using a radioimmunoassay method (Advia Centaur, Simmens). Maternal blood glucose along with total cholesterol (TC) and TG levels were determined using the enzymatic method on a Beckman analyzer (model CX7; Beckman, Fullerton, CA). VLDL and low-density lipoproteins (LDL) in plasma were precipitated with heparin and MnCl2 to isolate HDL particles for cholesterol (HDL-c) measurement. Then, plasma LDL-c concentrations were estimated using the Friedewald formula.Reference Friedewald, Levy and Fredrickson 20 GDM was diagnosed according to WHO criteria: glycaemia ⩾7.8 mmol/l following the 2-h post 75 g-oral glucose tolerance test (OGTT) between the 24th and 28th weeks of gestation. The 126 women were tested between weeks 22.4 and 28.9 (average=25.7±1 weeks) of gestation. Insulin resistance levels were assessed using HOMA-IR (fasting glucose (mmol/l)×fasting insulin (mU/l)/22.5) at the second trimester of pregnancy.Reference Matthews, Hosker and Rudenski 21 Clinical information about the newborn was collected at birth from medical files and included gestational age, sex of the newborn and anthropometric measurements. The gestational age was calculated at the first visit from the date of the last menstrual period and was corrected afterwards, as required, based on the date from the ultrasound scans. Cord blood lipid and glucose levels were assessed as described for the mother. In addition, cord blood C-peptide levels, measured by ELISA, were used as a marker of the newborn’ insulin-secretory activity.Reference Heding 22 Because the lipid measurements (HDL-c, TG, TC) were not available for all women, the number of samples (n) provided in Table 2 are lower than 126. The lipid profile was available for 92 newborns out of 126.
Placenta tissue sampling
Placenta tissues were sampled by well-trained clinicians (MD) within a few minutes after delivery and placental expulsion. Two biopsies of 0.5 cm3 were taken on the fetal side of the placenta near the insertion point of the umbilical cord. The biopsies consisted of the chorionic plate with the chorionic villi. Placental biopsies were washed in PBS 1× (137 mM NaCl, 2.7 mM KCl, 10 mM NaH2PO4, 1.8 mM KH2PO4, pH 7.4) to remove cord/maternal blood, dissected to remove conjunctive tissues and kept in RNALater (Qiagen, Valencia, CA) at −80°C until nucleic acid extraction.
DNA and RNA were purified from placenta biopsies using the All Prep DNA/RNA/Protein Mini Kit (Qiagen). RNA quality was assessed with Agilent 2100 Bioanalyzer RNA Nano Chips (Agilent Technologies, Santa Clara, CA). On average, the RNA was considered of good quality (mean RNA integrity number 8.00±0.70).
DNA methylation analysis at the LPL gene locus
Based on a first epigenome-wide DNA methylation association study (EWAS) [Illumina’s HumanMethylation450 BeadChips (Illumina Inc., San Diego)] conducted with 30 placenta samples of mother diagnosed with GDM and 14 from controls,Reference Ruchat, Houde and Voisin 23 we identified three loci flanking the first exon of the LPL gene that showed DNA methylation variability and potential differences between groups. These three CpGs were retained for DNA methylation analyses in the current study (total n=126). Cytosine methylation was quantified using sodium bisulfite (NaBis) pyrosequencing (Pyromark Q24, Qiagen-Biotage).Reference Dejeux, El abdalaoui, Gut and Tost 24 Combined with the NaBis DNA treatment, pyrosequencing is a quantitative real-time sequencing technology that allows measuring DNA methylation levels (%) for each cytosine of the covered region. NaBis treatment of DNA (EpiTect Bisulfite Kit, Qiagen) specifically converts unmethylated cytosine into uracil, while the methylated cytosines are protected from this transition. Once treated, NaBis-DNA is amplified (Pyromark PCR kit, Qiagen) and pyrosequenced. PCR and sequencing primers for analysis of the LPL CpGs were designed with Pyromark Assay Design (version 2.0.1.15; Qiagen) to cover the three CpGs found to be differentially methylated from our ongoing EWAS of GDM cases-controls (cg16125291, cg08918749 and cg16420199). The designed primers, after bisulfite conversion of DNA, were as follow:
LPLCpG1F: 5′-AAGTATAAGTTGGGAYGTAATGTGTG-3′,
LPLCpG1R: 5′-CCAAAAAAAAAAAATTTAACTATTAAATTAC-3′ (177 bp), and
LPLCpG1seq: 5′-GTGTGTTTTTTTATTTTTATATTGA-3′;
LPLCpG2F: 5′-GGAGGGGTTTTGGAATGAAAG-3′,
LPLCpG2R: 5′-TTCCCCAAAAAAAACCACAATCRACCC-3′ (113 bp), and
LPLCpG2seq: 5′-GGTTTTGGAATGAAAGG-3′ and;
LPLCpG3F: 5′-GTTTTGGGGGTTGAGGTT-3′,
LPLCpG3R: 5′-AATTAAACAAACTACCTCCATTAC-3′ (202 bp), and
LPLCpG3seq: 5′-CTAAAACATTCTCATTTAAC-3′.
LPL expression analysis
cDNA was generated from total RNA using a random primer hexamer provided with the High Capacity cDNA Archive Kit from Applied Biosystems (Foster City, CA). Equal amounts of cDNA were run in duplicate and amplified in a 20 µl reaction containing 10 µl of Universal PCR Master Mix (Applied Biosystems). Primers and Taqman probes were obtained from Applied Biosystems (LPL: Hs00173425_m1; Applied Biosystems). The YWHAZ housekeeping gene (endogenous control; YWHAZ: Hs00237047_m1) was amplified in parallel. LPL and YWHAZ amplifications were performed using an Applied Biosystems 7500 Real Time PCR System, as recommended by the manufacturer (Applied Biosystems). The expression of LPL gene was normalized to the expression of the YWHAZ reference gene. The YWHAZ gene has been shown to be suitable for gene expression normalization in placenta.Reference Meller, Vadachkoria, Luthy and Williams 25 – Reference Drewlo, Levytska and Kingdom 27 Placental LPL expression was compared between normal glucose tolerance (NGT) and GDM women using the 2−ΔΔC t methodReference Livak and Schmittgen 28 and YWHAZ/LPL C t ratio were used for correlation analysis.
Statistical analyses
DNA methylation levels of CpGs at the LPL gene locus and maternal and newborn characteristics were compared between groups of women with or without GDM using the unpaired Student t-test or Pearson’s χ 2 test for categorical variable (history of GDM). Kolmogorov-Smirnov test was applied to verify data distribution. The following variables were not normally distributed and were thus log transformed: maternal fasting insulin, LDL-c at first trimester and TG at each trimesters as well as cord blood TG, HDL-c and LDL-c. Pearson’s correlation coefficient was used to assess the relationship between LPL DNA methylation and dependent variables (mRNA expression, maternal metabolic data, birth and placental weight and cord blood lipid profile). The statistical models were adjusted for the following confounders when applicable: age and BMI of the mother at first trimester of pregnancy, history of gestational diabetes, gestational age at delivery, method of childbirth (vaginal v. caesarean section), newborn’s sex and birth weight. The results remained unchanged after adjusting for parity. Furthermore, as maternal TG concentrations were significantly correlated with maternal HDL-c and 2-h post-OGTT glucose concentrations, the statistical models were also adjusted for TG when applicable.
Stepwise multivariate linear regression was used to identify predictors of the variance of placental LPL DNA methylation levels. The input-independent variables were: maternal characteristics (age, BMI and TG at first trimester of pregnancy, glucose 2-h post-OGTT and HDL-c at second trimester of pregnancy, HDL-c at third trimester of pregnancy, history of gestational diabetes), gestational age at delivery and method of childbirth. All the variables with P<0.05 were retained in the regression model. Results with P-values ⩽0.05 (two-sided) were considered statistically significant. All analyses were performed with SPSS version 20.
Results
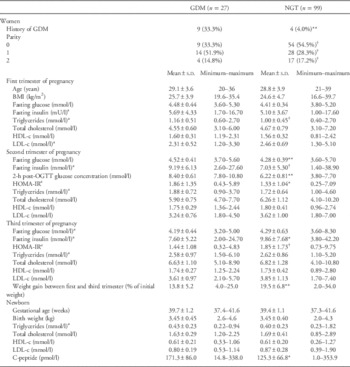
Characteristics of mothers according to their glucose tolerance status as well as newborns’ gestational age and birth weight are shown in Table 1. At first trimester of pregnancy, women were on average 29 years old, slightly overweight and had normal fasting glucose concentrations and lipid profile. Of the 126 women recruited, 27 had GDM, whereas 99 were normoglycemic (NGT). Among the women with GDM, 16 were treated with a diet only whereas 11 received a diet and insulin treatment. Overall, blood glucose 2-h post-OGTT covered a wide range of values (from 3.80 to 10.80 mmol/l). Mothers with GDM had a lower gestational weight gain.
Characteristics of women and newborn according to maternal glucose tolerance status

GDM, gestational diabetes mellitus; NGT, normoglycemic; BMI, body mass index; OGTT, oral glucose tolerance test; HDL, high-density lipoproteins; LDL, low-density lipoproteins.
a Geometric mean (value obtained after log10 transformation of the variable).
**p⩽0.01;* p⩽0.05; †p⩽0.10.
Average birth weight was within the normal weight range in both NGT and GDM groups. Nevertheless, according to Olsen et al. Reference Olsen, Groveman, Lawson, Clark and Zemel 29 intrauterine growth curves, two babies were found to be small for gestational age whereas five babies were large for gestational age (LGA). Among these seven babies, one LGA was born to GDM mothers. Interestingly, newborn exposed to GDM had significantly higher levels of cord blood C-peptide, hence suggesting that they had been exposed to higher glucose concentrations.
DNA methylation analysis of the placental LPL gene
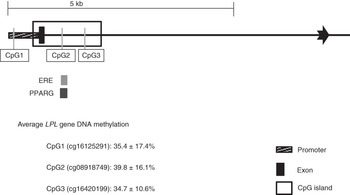
Placental DNA methylation was measured at 3 CpGs located within the LPL gene locus first identified using an EWAS strategy (Fig. 1). The first CpG (LPL-CpG1) was located in its proximal promoter region, 46 bp upstream from the first exon (Fig. 1). The two other CpGs, CpG2 and CpG3, were located 405 and 925 bp downstream from the first exon, within the LPL intron 1 CpG island. DNA methylation level at LPL-CpG1 locus was not found to be correlated with the methylation levels at CpG2 and CpG3 (r<0.08). Nevertheless, LPL DNA methylation levels at CpG2 and CpG3 sites were found partially correlated with each other (r=0.32; P<0.001).
Schematic representation of the LPL gene locus CpG island and localization of the 3 loci epigenotyped. CpG1 is located within the LPL proximal promoter region whereas CpG2 and CpG3 are located downstream from the first exon within the LPL intron 1 CpG island. Transcription factor binding sites were identified using the UCSC Genome Browser (NM_131127)Reference Kent, Sugnet and Furey 51 software, accessed 12 September 2012.

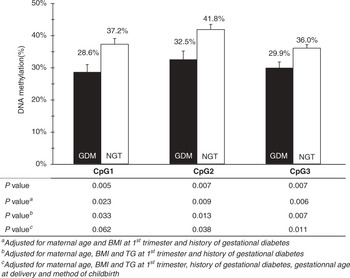
Average DNA methylation at LPL gene locus was between 34.7% and 39.8% (Fig. 1). Overall, LPL DNA methylation levels were lower in placenta exposed to GDM compared with those not exposed (Fig. 2). DNA methylation differences remained unchanged for CpG2 and CpG3 after adjusting the statistical models for age, BMI and TG at first trimester of pregnancy and history of gestational diabetes, gestational age at delivery and method of childbirth. Furthermore, DNA methylation differences between the GDM and NGT mothers remained unchanged at the 3 CpGs when the obese women [BMI>30 kg/m2 (n=13)] were removed from the analysis or when the statistical models were adjusted for maternal weight gain between the first and third trimester of pregnancy. The largest DNA methylation difference between groups (9.3%) was found with CpG2 (P=0.04) (Fig. 2).
DNA methylation levels at placental LPL loci according to maternal glucose tolerance status. Mean DNA methylation levels at placental LPL gene CpG1, CpG2 and CpG3 loci in mothers with gestational diabetes mellitus (n=27) (black) and with normal glucose tolerance (n=99) (white). Error bars represent the standard error of the mean (n=126). Mean DNA methylation levels were compared with the Student t-test and adjusted for confounding variables.

Correlations between LPL DNA methylation levels and maternal metabolic profile
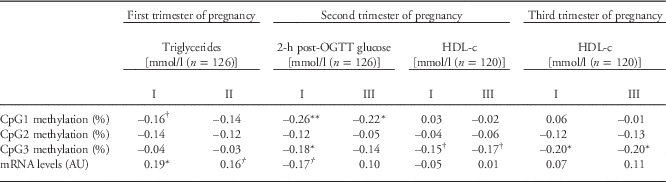
To further confirm the initial EWAS findings (that maternal hyperglycemia is negatively associated with LPL DNA methylation), the correlation between placental LPL DNA methylation and maternal glucose levels was tested. We observed that CpG1 and CpG3 DNA methylation levels were negatively correlated with maternal 2-h post-OGTT glucose concentrations (r=−0.26; P=0.003; r=−0.18; P=0.05) (Table 2). The latter correlation was slightly affected by additional corrections for maternal TG levels at first trimester of pregnancy, gestational age at delivery and method of childbirth and did not remain significant (r=−0.14; P=0.13). Nevertheless, the correlation between LPL CpG1 DNA methylation levels and maternal 2-h post-OGTT glucose concentrations remained significant after consideration of all potential confounding variables (r=−0.22; P=0.02) and exclusion of the 13 obese mothers. Finding a correlation between LPL DNA methylation and 2-h post-OGTT glucose concentrations thus confirms the initial association results.
Pearson’s correlation coefficient between placental LPL DNA methylation and maternal metabolic profile

HDL, high-density lipoproteins.
I – adjusted values for age, body mass index (BMI) at first trimester and history of gestational diabetes.
II – adjusted values for age, BMI at first trimester, maternal glucose 2-h post oral glucose tolerance test at second trimester, history of gestational diabetes, gestational age at delivery and method of childbirth.
III – adjusted values for age, BMI and triglycerides at first trimester, history of gestational diabetes, gestational age at delivery and method of childbirth.
**p⩽0.01; *p⩽0.05; † p⩽0.10.
As LPL is a key player in TG and lipoprotein metabolism, we also tested for correlations between placental DNA methylation at the LPL gene locus and maternal TG, HDL-c and LDL-c concentrations. We found that CpG3 methylation levels were negatively correlated with concentrations of maternal HDL-c at third trimester of pregnancy (r=−0.20; P=0.03). A trend for correlation was also observed between CpG3 DNA methylation levels and HDL-c at second trimester of pregnancy (r=−0.15; P=0.10) (Table 2). These correlations remained unchanged after adjusting for all the potential confounding variables or when obese women were excluded from the analysis. Maternal TG and LDL-c concentrations were not correlated with placental LPL DNA methylation.
Overall, stepwise multivariate linear regression analysis showed that maternal glucose concentrations (2-h post-OGTT) (β=−0.236; P=0.01) and HDL-c levels (third trimester of pregnancy) (β=−0.182; P=0.05) could explain up to 7.0% (R 2 adj =0.070; P=0.006) of placental DNA methylation variance at LPL-CpG3 locus.
Correlations between LPL DNA methylation levels and offspring characteristics
To further evaluate the impacts of LPL DNA methylation profile on materno-fetal transport we tested the association between LPL DNA methylation levels and offspring developmental characteristics and lipid profile. Methylation levels at the LPL-CpG2 locus in the placenta was found to be negatively correlated with cord blood HDL-c levels (r=−0.24; P=0.03), and TC/HDL-c ratio (r=0.22; P=0.04) and tended to be correlated with TG concentrations (r=0.19; P=0.08) after adjusting for newborn’s sex, gestational age and method of childbirth. The strength of these three correlations was increased after adjustment for birth weight (r=−0.27; P=0.01; r=0.27; P=0.01 and r=0.25; P=0.02 for HDL-c, TC/HDL-c and TG, respectively) and remained similar after correction for maternal BMI at first trimester of pregnancy, gestational weight gain and maternal metabolic variables throughout pregnancy.
Correlation between placental LPL DNA methylation and mRNA expression levels
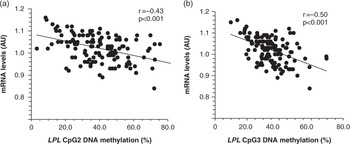
To assess the impacts of DNA methylation on placental LPL gene expression, LPL mRNA levels were quantified. Placental LPL mRNA levels, expressed as arbitrary units and normalized to YWHAZ mRNA levels, were found to be 1.6 fold higher in placenta of women with GDM (1.04±0.012 AU) compare to NGT (1.02±0.006 AU) (P=0.04) according to the 2−ΔΔC t method.Reference Livak and Schmittgen 28 We also found that LPL DNA methylation levels at CpG2 and CpG3, both located within the intronic CpG island, were negatively correlated with placental LPL gene expression (Fig. 3). Nevertheless, DNA methylation at CpG1, located directly within the LPL gene promoter, was not correlated with LPL gene expression regulation (r=−0.08; P=0.38) (data not shown).
Pearson’s correlations between LPL gene CpG2 (a) and CpG3 (b) DNA methylation and mRNA levels in placenta (n=126).

LPL mRNA levels were correlated with TG levels at first trimester of pregnancy (r=0.19; P=0.04) and tended to be associated with maternal glucose 2-h post-OGTT (r=0.17; P=0.06) (Table 2). These correlations were no longer statistically significant after adjustment for TG levels at first trimester of pregnancy and other potential confounding variables (r=0.16; P=0.09) and maternal 2-h post-OGTT glucose levels (r=0.10; P=0.18).
Discussion
In the current study, we documented the epigenetic variability at LPL gene locus in placenta samples exposed or not to GDM. Previous studies have highlighted dysregulations in LPL expression and activity in the placenta of women with pregnancy complications such as obesity,Reference Dube, Gravel and Martin 30 GDMReference Radaelli, Lepercq and Varastehpour 5 and IUGR.Reference Tabano, Alvino and Antonazzo 6 , Reference Magnusson, Waterman, Wennergren, Jansson and Powell 31 Nevertheless, this is the first study reporting associations between LPL DNA methylation levels and changes in maternal glucose and lipid profiles.
At first, we showed that CpG dinucleotides within LPL gene proximal promoter and intron 1 loci were significantly less methylated in the placenta of mothers with GDM in comparison to NGT mothers. Besides, a correlation was observed between maternal 2-h post-OGTT glucose concentration and LPL DNA methylation in both impaired glucose tolerance (IGT) and NGT. These observations suggest that the association between maternal glucose and changes in newborn’s epigenome holds even at concentrations within the normal range. Recent studies have also reported that a slight increase in maternal glucose, below the GDM or IGT diagnosis threshold, is associated with fetal overgrowth and excess adiposity in children.Reference Walsh, Mahony, Byrne, Foley and McAuliffe 32 , Reference Deierlein, Siega-Riz, Chantala and Herring 33 Therefore, changes within the normal range in maternal glucose concentrations appear to be important in the fetal lipid metabolism regulation. Our and other studies suggest that these effects of maternal hyperglycemia on the newborn might be caused by epigenetic variations.Reference Bouchard, Thibault and Guay 17 , Reference Bouchard, Hivert and Guay 18 , Reference Ruchat, Houde and Voisin 23 , Reference El Hajj, Pliushch and Schneider 34 , Reference Houde, Guay and Desgagne 35
Interestingly, other maternal conditions such as circulating lipids have also been shown to be detrimental for fetal development and lipid metabolism, and this, independently of maternal hyperglycemia.Reference Kitajima, Oka and Yasuhi 36 – Reference Zeljkovic, Vekic and Spasic 38 In the present study, we report that increased maternal HDL-c levels at third trimesters of pregnancy were associated with decreased cytosine methylation levels at LPL gene. HDL-c levels were found to be neither different between women with and without GDM nor correlated with maternal glucose levels at any trimester during pregnancy. This suggests that the association between LPL DNA methylation and maternal HDL-c levels is independent of the maternal GDM status. The exact role of the maternal metabolism in regulating the placental epigenome is still not well defined. Glucose concentrations have been associated with serum homocysteine levels in diabetic patientReference Mazza, Bossone, Mazza and Distante 39 and DNA methyltransferase activity in cultured hepatocytes.Reference Chiang, Wang, Chen and Tang 40 Furthermore, persistent DNA methylation at key metabolic genes was observed in Schwan cell culture following chronic exposure to glucose.Reference Kim, Isoda, Kurland and Mobbs 41 On the other hand, it was recently reported that circulating HDL particles carry microRNAs.Reference Vickers, Palmisano, Shoucri, Shamburek and Remaley 42 As microRNAs can alter DNA methyltransferase activity,Reference Denis, Ndlovu and Fuks 43 HDL-c regulation of DNA methylation is another likely mechanisms. However, additional investigations will need to be carried on to determine how maternal glucose and HDL-c can impair the placental epigenome. Besides, although unlikely, we cannot exclude that LPL-CpG3 DNA methylation levels on the fetal side of the placenta can be causal of maternal HDL-c concentration changes at third trimester.
We also observed higher LPL mRNA levels in placenta of mothers with GDM in comparison to those with NGT. Our results differ from Radaelli et al.,Reference Radaelli, Lepercq and Varastehpour 5 which report decreased LPL mRNA expression in placenta of women with GDM. This apparent discrepancy may be due to different methods (microarray v. RT-PCR) and placental tissues used to quantify LPL expression, to the GDM diagnosis criteria and/or because women from Radaelli’s study were not followed up during pregnancy or in too low numbers (GDM: n=9 and NGT: n=5). Moreover, placental LPL mRNA expression was correlated with LPL DNA methylation levels at the two CpG sites within the CpG island (CpG2 and CpG3), suggesting that the epivariations observed may impair LPL gene transcription. Interestingly, consensus sequences for estrogen response element (ERE) and PPARγ binding sites were identified near the LPL CpG2 locus (Fig. 1). Transcriptional regulation of LPL expression by estrogen, and PPARγ has been previously reported in adipose tissue, skeletal muscle and heart.Reference Schoonjans, Peinado-Onsurbe and Lefebvre 44 , Reference Wang and Eckel 45 Additionally, ERE in intron 1 of LPL gene has been shown to regulate LPL expression in mice heart.Reference Liu, Deschamps, Korach and Murphy 46 Therefore, epivariations at or near CpG2 could potentially regulate LPL mRNA expression through DNA methylation-related impairment of DNA binding activity of these transcriptional factors. Although LPL regulation is very complex; it includes tissue-specific transcriptional and posttranscriptional regulation points and posttranslational modifications, we are the first to report that placental LPL mRNA expression (up to 26% of the variance) can be explained by DNA methylation changes within its first intron CpG island. The importance of DNA methylation changes within the LPL gene proximal promoter region is unclear in the placenta but may be particularly important in other tissues. We have recently reported a significant negative correlation between LPL proximal promoter (including CpG1) DNA methylation levels and mRNA levels in visceral adipose tissue (VAT).Reference Guay, Brisson and Lamarche 47 Interestingly, LPL promoter DNA methylation levels in VAT were also found to be associated with HDL-c levels.Reference Guay, Brisson and Lamarche 47 This is suggesting that LPL gene expression regulation by DNA methylation is tissue-specific and could potentially regulate lipid metabolism. Therefore, placental LPL epipolymorphisms could also be reflected in other tissues such as adipose tissue and thus more largely contribute to the metabolic health programming of the newborn. Further studies are needed to determine whether the placental LPL epigenetic variations are reflected in other tissues of the newborn.
In the placenta, we found that LPL-CpG2 DNA methylation levels are associated with cord blood HDL-c and TG levels. This suggests that LPL DNA methylation might be involved in the regulation of the placental lipid transfer to the fetus. Moreover, LPL-CpG2 DNA methylation is associated with GDM status and cord blood atherogenic lipid profile. This may contribute to explain why newborn exposed in utero to GDM are at higher risk for cardiovascular diseases later in life.Reference Ma, Chan, Tam, Hanson and Gluckman 48 , Reference Marco, McCloskey and Vuillermin 49 Nevertheless, the cord blood lipid profile is not different between NGT and GDM and LPL-CpG2 DNA methylation levels only explained a small proportion of the newborn lipid profile, suggesting that other regulatory mechanisms involved in materno-fetal lipid transfer [e.g. LIPG, ATP-binding cassette transporter A1 and G1 (ABCA1 and ABCG1)] may compensate for the loss of function of LPL. This is supported by the correlation between ABCA1 DNA methylation levels and both maternal metabolic and cord blood lipid profiles recently reported by our group.Reference Houde, Guay and Desgagne 35
DNA methylation levels at the LPL-CpG3 locus, 520 bp downstream CpG2, were alternatively correlated with maternal HDL-c, suggesting that LPL DNA methylation is tightly controlled in a site-specific manner. Individual site-specific DNA methylation was previously observed by Weaver et al. Reference Weaver, Cervoni and Champagne 50 who have found that DNA methylation at CpGs localized 6 bp apart (hundreds of pair bases in the current study) within the proximal promoter region of the glucocorticoid receptor gene in the murine hippocampus have independent functions. Nevertheless, the mechanisms involved in the regulation of site-specific methylation are still unknown and will need to be addressed in future studies.
The longitudinal follow-up of women from first trimester of pregnancy to delivery is among the strength of this study. It allowed us to accurately identify mothers developing IGT during pregnancy and avoid their misclassification with women who were diabetic pre-pregnancy. Moreover, the study design, along with our fairly large sample size, have allowed us to consider potential confounding factors in our statistical models. Nevertheless, as placenta samples were analyzed at birth, the causality between LPL epigenetic variations and maternal and cord blood metabolic variables need to be confirmed along with the functional impact of LPL DNA methylation levels on LPL protein levels and activity. LPL DNA methylation levels will also need to be assessed in these children in a few years to determine whether the epipolymorphisms observed in the placenta at birth are still associated with blood lipid profile throughout infancy and childhood.
In conclusion, we have shown that placental LPL gene DNA methylation profile is associated with GDM and maternal HDL-c levels in a site-specific manner. The epivariations observed in placental LPL intronic CpG island were found to be correlated with placental LPL mRNA levels and with the cord blood lipid profile. Consequently, we hypothesized that variations in DNA methylation levels at specific LPL CpG locus might disturb the placental lipid transfer and newborn lipid metabolism thereby potentially contributing to the later onset of obesity and associated metabolic disorder in child or adulthood. This study also provides new insights on the epigenetics regulation of fetal metabolic programming and suggests that other genes may respond to variations in maternal metabolic profile such as maternal glucose and lipid profiles.
Acknowledgements
The authors acknowledge the contribution of Sébastien Claveau, MSc; Nadia Mior; Jeanine Landry, RN and Chantal Aubut, RN from ECOGENE-21 Clinical Research Center for their dedicated work in this study. The authors also express their gratitude to Céline Bélanger, Chicoutimi Hospital, for her thoughtful language revision of the manuscript.
Financial Support
A.A.H. is a recipient of a scholarship from FRQ-S. L.B. and M.F.H. are junior research scholars from the Fonds de la recherche en santé du Québec (FRSQ). M.F.H. is also supported by a Canadian Diabetes Association clinical scientist award. L.B., M.F.H., P.P. and J.P.B. are members of the FRSQ-funded Centre de recherche clinique Étienne-Le Bel (affiliated to Centre Hospitalier de l’Université de Sherbrooke).
Conflicts of Interest
None.
Ethical Standards
The authors assert that all procedures contributing to this work comply with the ethical standards of the relevant national guidelines on human experimentation and the Helsinki Declaration of 1975, as revised in 2008, and has been approved by the Chicoutimi Hospital Ethics Committee.