

Introduction
Firearm injuries are responsible for significant morbidity and mortality in the United States. A recent evaluation of national emergency department visits highlights the enormous burden placed on the healthcare system through emergency department visits and subsequent hospitalizations; from 2006-2014, it is estimated that over 700,000 patients of all ages presented to the emergency department with a firearm-related injury.Reference Gani, Sakran and Canner1
One concerning aspect of firearm-related injury is the significant portion of injuries that occur to youth, whether in homes, schools, or elsewhere in their communities. Youth firearm injury is concerning not only because youth are often innocent victims, but also because youth firearm injury is alarmingly widespread — such injury is the second most common cause of childhood death in the United States.Reference Cunningham, Walton and Carter2 Finally, youth firearm injuries appear to be associated with greater severity than other forms of injury.Reference Wolf, Garrison, Mills, Chan and Rowhani-Rahbar3
This study provides a novel estimate of the youth firearm injury burden. While other studiesReference Fowler, Dahlberg, Haileyesus, Gutierrez, Bacon, Srinivasan, Mannix and Lee4 have used databases such as the National Electronic Injury Surveillance System and National Hospital Ambulatory Medical Care Survey, this study is the first to examine the Nationwide Emergency Department Sample (NEDS) within youth. And while NEDS has been used to estimate the burden of adult firearm-related emergency department visits,5 no previous study has used NEDS to provide detailed estimates of firearm-related emergency department visits specific to youth.
This study aims to inform current policymaking by quantifying the extent to which guns injure youth each year, as well as the factors that increase the risk of injury. The study enhances the current understanding of the youth firearm injury burden in the United States with a novel analysis of the NEDS database.
Methods
This study used the Nationwide Emergency Department Sample (NEDS) published by the Healthcare Cost and Utilization Project, Agency for Healthcare Research and Quality. NEDS is the largest all-payer ED database in the United States, yielding approximately 25 million to 35 million ED visits each year across more than 950 hospitals in 34 states. It contains approximately 20% of US hospital-based ED visits. NEDS is deliberately constructed to be representative of ED visits in the United States by being a large but selective sampling of 20% of US ED departments and is weighted to provide nationally representative estimates. The NEDS sample includes all payers and is not subject to self-report bias because it is based on ED visit data.
We used weighted ED visits to estimate a national sample of ED visits. All diagnoses reported in NEDS were based on the International Classification of Diseases, Ninth Revision, Clinical Modification (ICD-9-CM). Our study omitted analysis of data after September 2015 to maintain code consistency in the database. This study was granted an institutional review board exemption by the Yale Human Investigations Committee.
NEDS was queried from January 2006 to September 2015 for all patients age < 21 who presented with any diagnosis of firearm-related injury. Youth up to age 20 were included to evaluate firearms injuries in patients who were broadly in adolescence. Youth aged 18-20 were included in their own age category given the legal definition of childhood being those under age 18. External cause of injury codes (E-codes) were used to identify firearm-related injuries as detailed in Online Supplemental Table 1.
This study provides a novel estimate of the youth firearm injury burden. While other studiesReference Fowler, Dahlberg, Haileyesus, Gutierrez, Bacon, Srinivasan, Mannix and Lee4 have used databases such as the National Electronic Injury Surveillance System and National Hospital Ambulatory Medical Care Survey, this study is the first to examine the Nationwide Emergency Department Sample (NEDS) within youth. And while NEDS has been used to estimate the burden of adult firearm-related emergency department visits, no previous study has used NEDS to provide detailed estimates of firearm-related emergency department visits specific to youth.
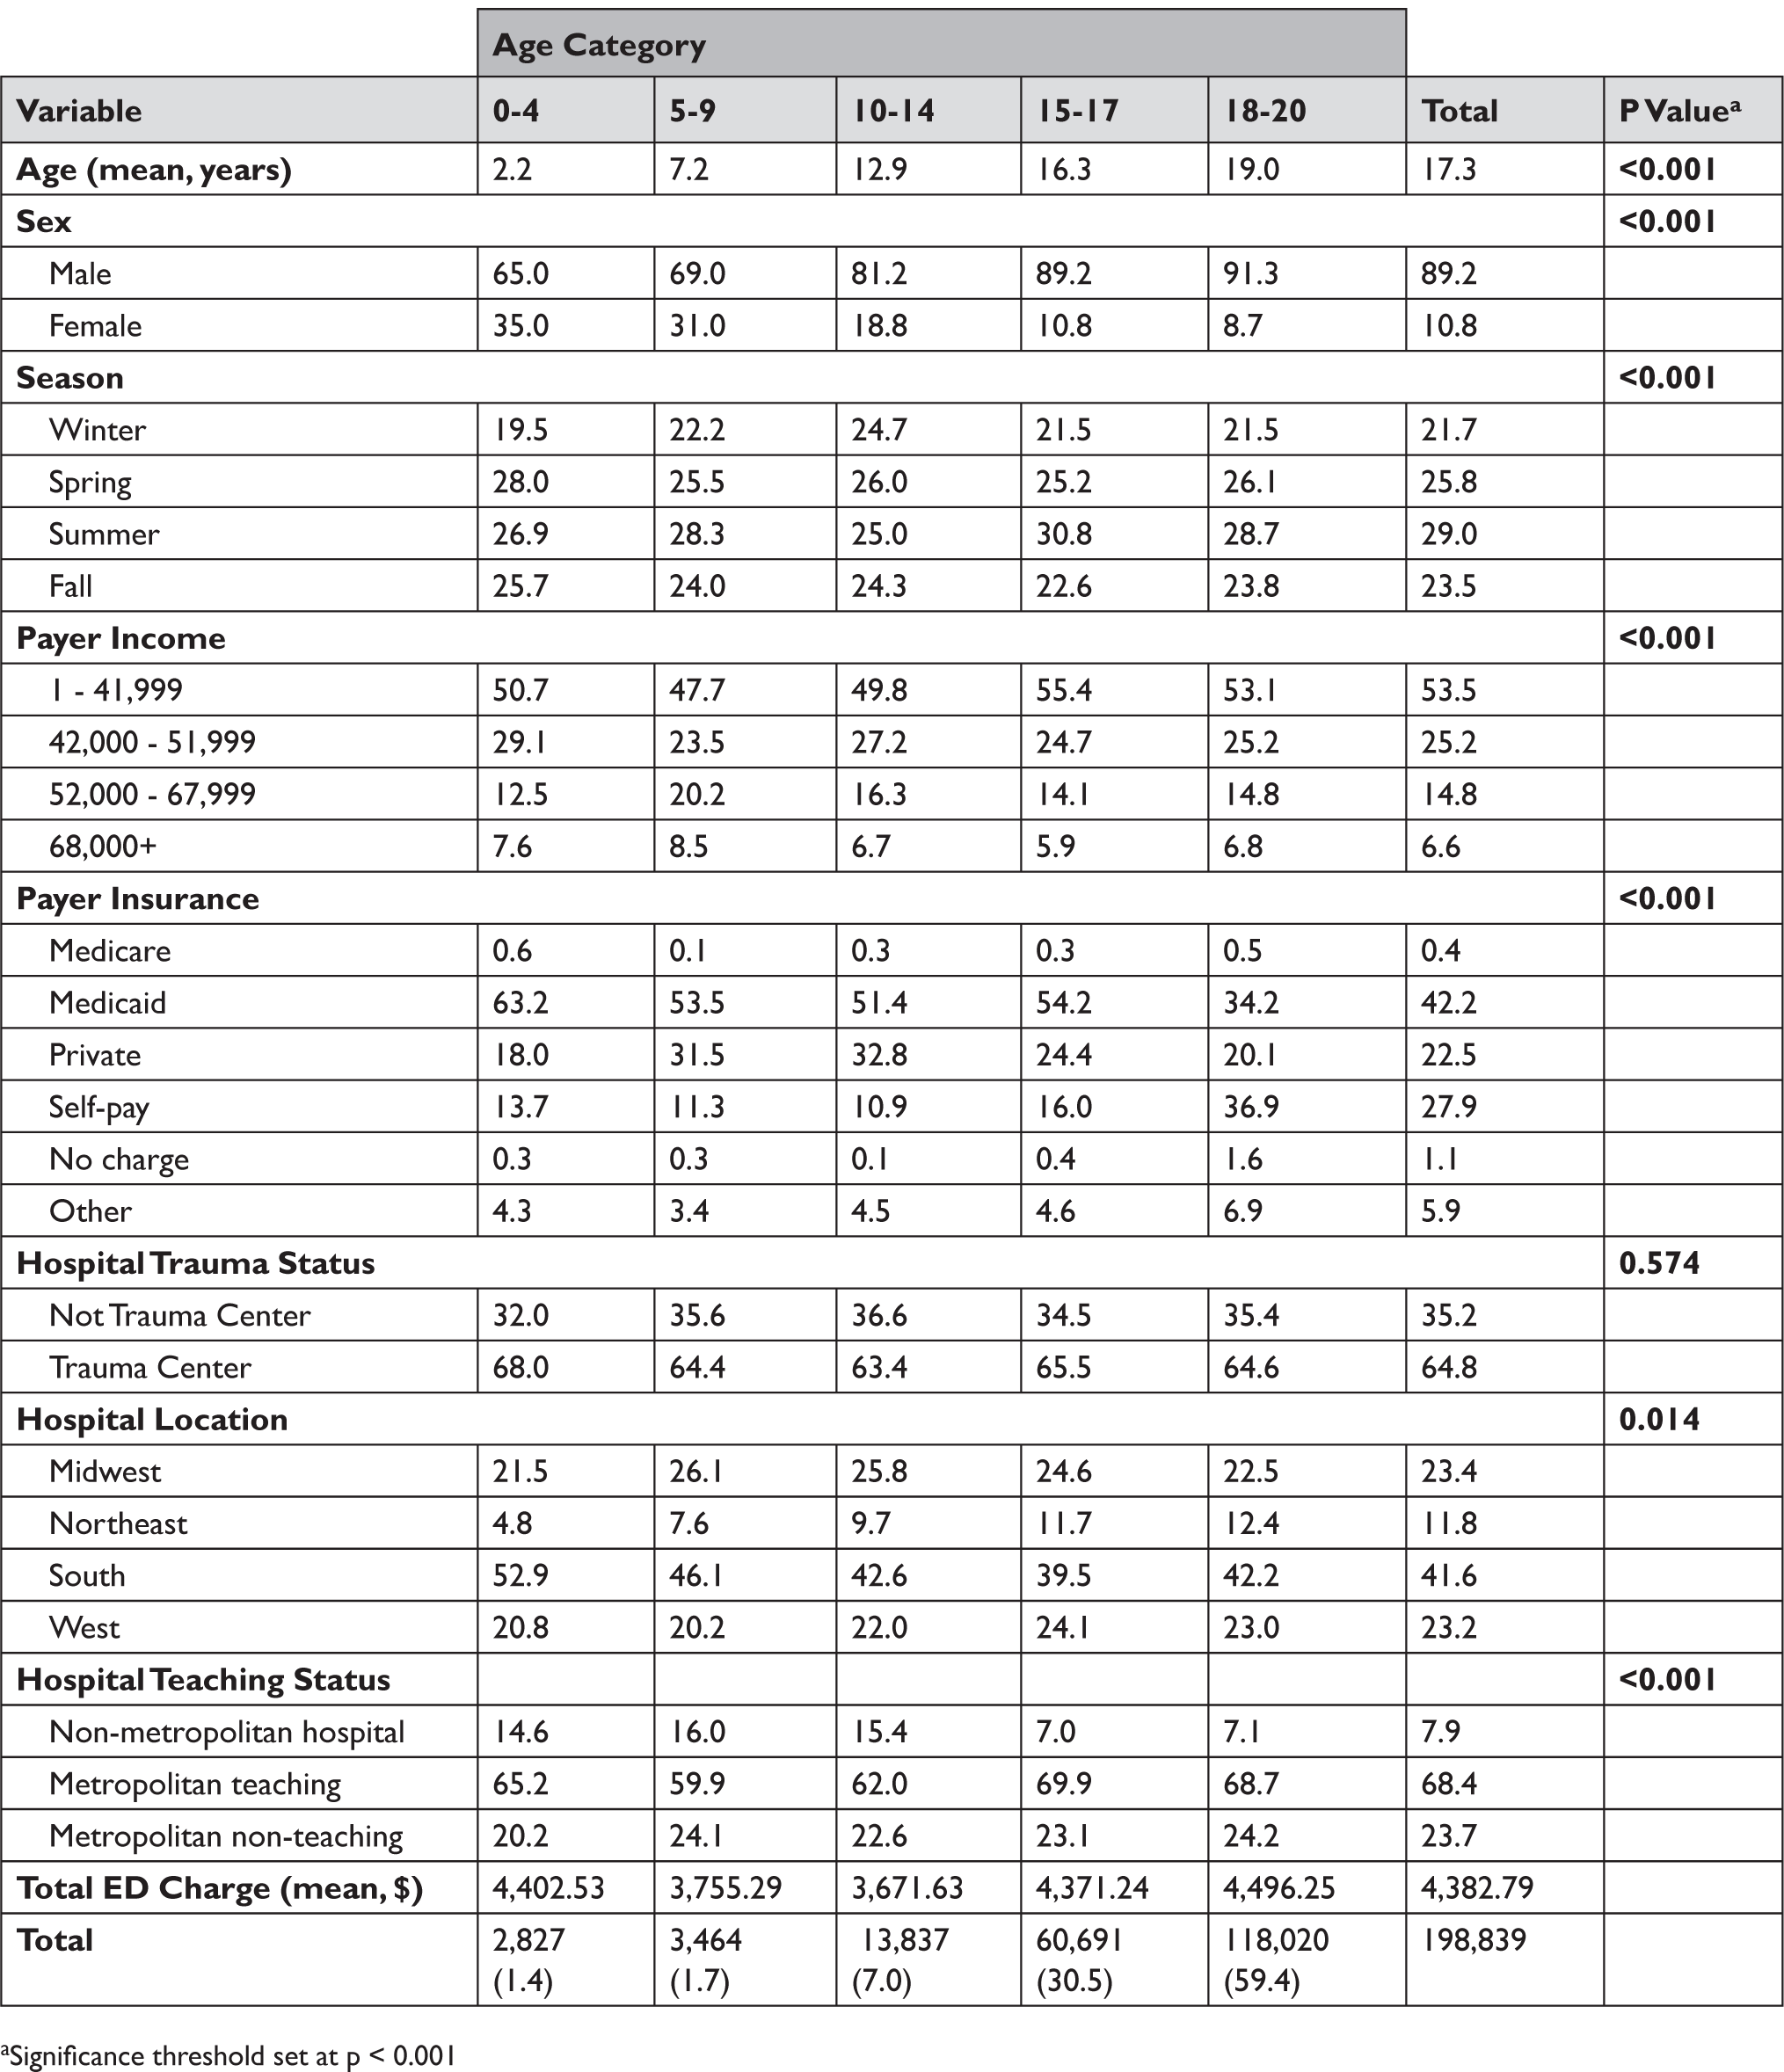
Demographic and Hospital Characteristics of Patients Presenting with Gunshot Injuries from 2006-2015

a Significance threshold set at p < 0.001
Emergency department visits and inpatient stays were characterized by demographic factors (age, sex, survey year), socioeconomic factors (insurance type, median household income by zip code), hospital characteristics (teaching status, trauma designation, location), cause of injury (unintentional, suicide, assault, legal intervention, undetermined), and type of firearm (handgun, shotgun, hunting rifle, military, other). Outcome variables of interest included inpatient admission and mortality. Geography was defined by HCUP into the 4 census regions (West, Midwest, Northeast, South). 2018 American Community Survey data was used to determine the likelihood of children to visit the ED for a gun related injury. As an exploratory analysis, we compared the rates of death within the NEDS dataset (Online Supplemental Table 2) to deaths reported by the CDC (Online Supplemental Table 3).
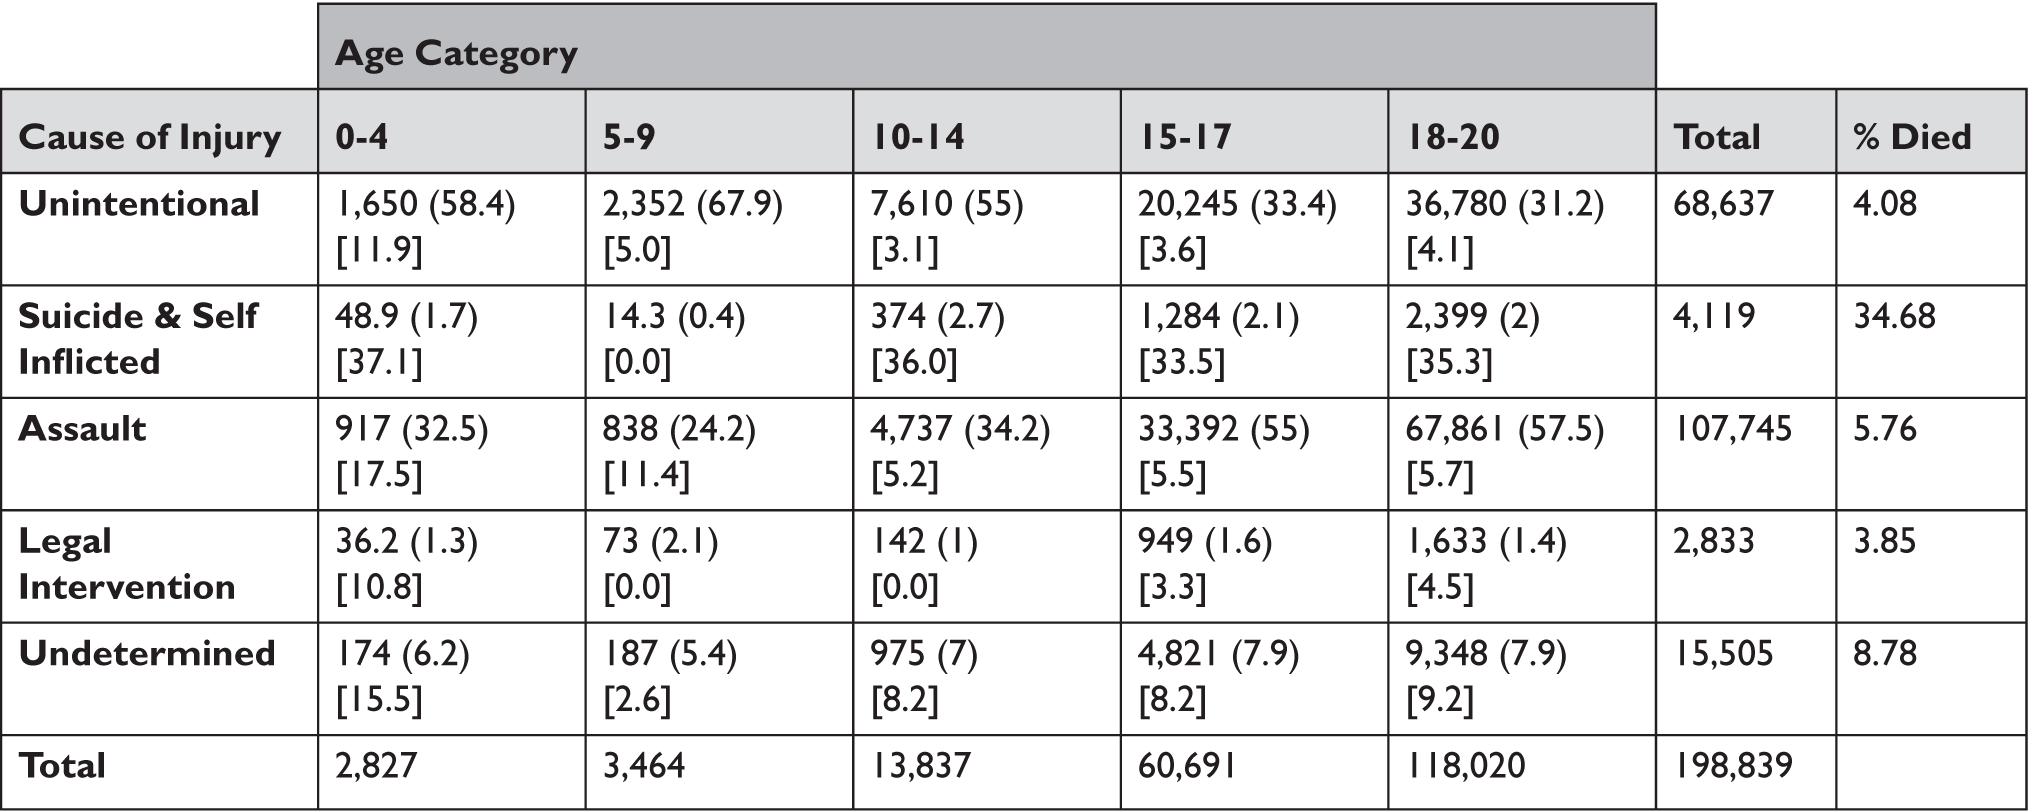
Cause of Firearm Injury by Age Category, weighted count (% of age cat) [% died] from 2006-2015

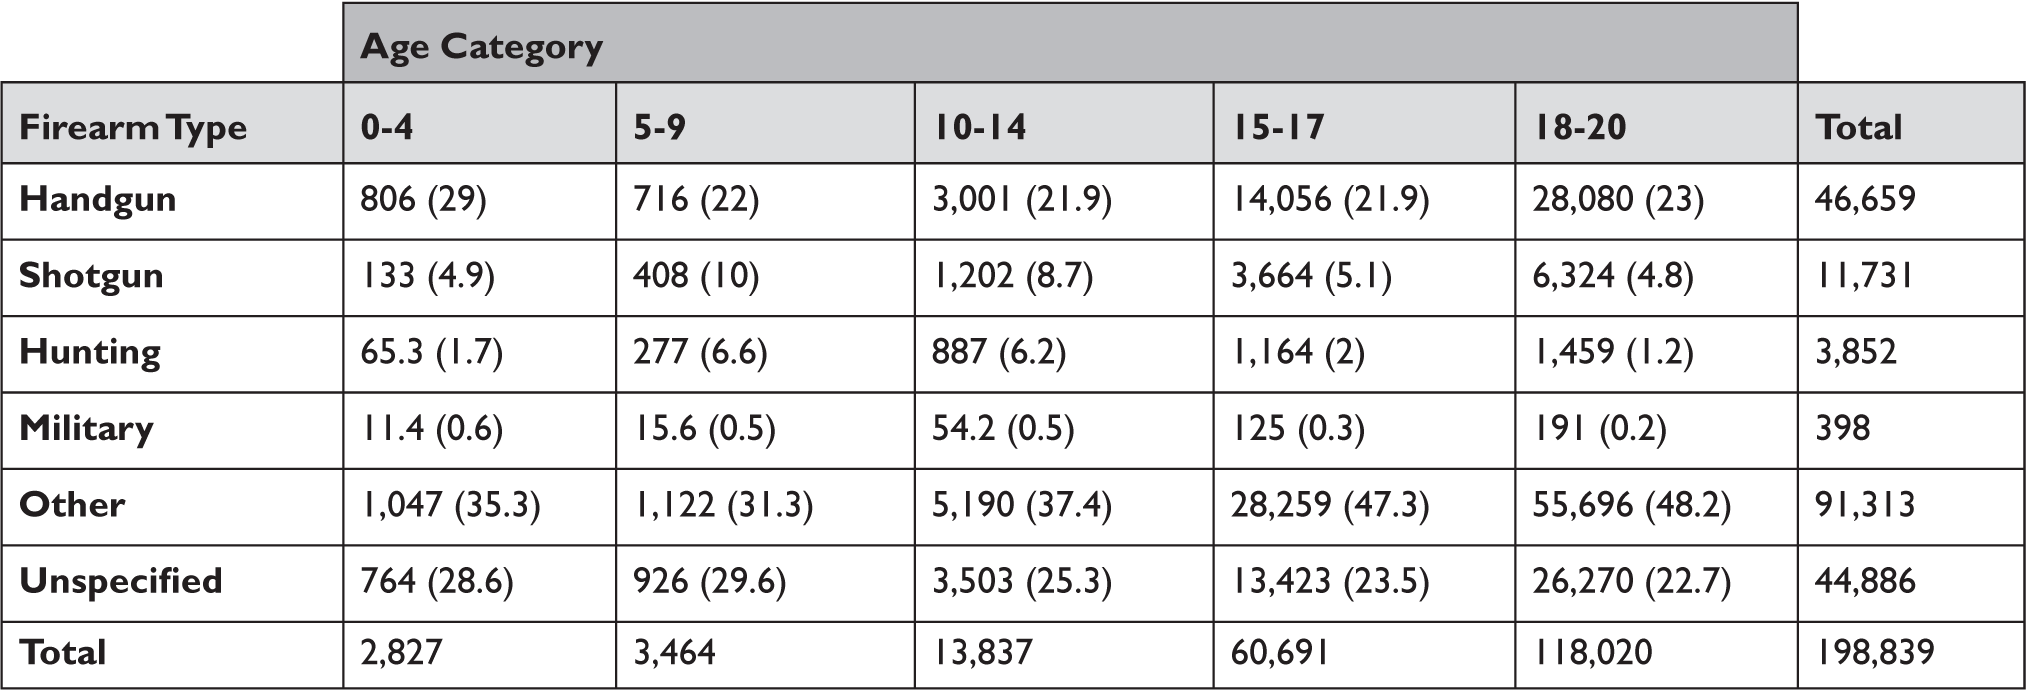
Type of Firearm Involved by Age Category, weighted count (% of age cat) from 2006-2015

Statistical Analysis
Univariable analysis comparing demographic, socioeconomic, and hospital-related factors between patients of different age groups was carried out using the chi-squared test. Descriptive analyses were also incorporated to characterize cause of firearm injury, type of firearm involved, and ED status and disposition by age group. Total ED charges were estimated and compared by age group. Weighted frequencies were incorporated in all analyses to produce national estimates. Hypothesis testing was 2-sided, and P < .001 was used to indicate statistical significance for all comparisons. Because of the large sample size in this data set, this P value was chosen to increase the likelihood of obtaining clinically relevant findings. Data analysis was carried out using Stata, version 13.1 (StataCorp LP).
Population-adjusted ED visits per 100,000 persons was estimated by taking the estimated ED visit per census region during the study period (2006-2015) and dividing by the American Community Survey population of that age group as of 2018.
CDC death rates were extracted from the CDC WONDER database by requesting data for ages 0-20, for the years 2006-2015, for deaths due to firearm injury as identified by ICD-10 cause of death codes with at least one death during the study period (Online Supplemental Table 3).6 We intended to provide comparison of CDC data and NEDS data to show that there are more firearm deaths in this country beyond what is shown in NEDS since people die before reaching the ED. Given the difficulty in comparing two different datasets, a formal statistical comparison of death rates between the two datasets was not performed.
Results
Demographics
Overall, we found an estimated 198,839 incidents of firearm related emergency department visits over 2006-2015 for youth age < 21, which represents 19,884 annual visits. The majority (59.4%) of these visits occurred for youth aged 18-20, and the average age of all visits was 17.3 years. However, we estimated 2,827 visits for children aged 0-4 years (1.4%). We found that generally, youth who experienced firearm injury were male (89.2%), from the lowest income quartile (53.5%), and presented to metropolitan teaching and non-teaching hospitals (68.4% and 23.7%). Medicaid was the most common insurance (42.2%). We also found that geographically, a plurality of firearm injuries occurred in the South (41.6%). A plurality of events occurred in the summer (29.0%). Demographic data is shown in Table 1.
Cause of Injury
There were 5 categories of firearm injury reported (Table 2). Overall, there were an estimated 107,745 incidences of assault and 68,637 incidences of unintentional injury. Depending on the child's age, different causes of injury were relatively more or less prevalent. In the youngest ages (age 0-4), unintentional (accidental) firearm injury was most prevalent (58.4%), though a significant fraction also presented to the ED due to assault (32.5%). However, for the 18-20 age group, the majority of injuries were due to assault (57.5%). There were 2,833 incidences of injury due to legal intervention and 4,119 incidents of suicide and self-inflicted injury. An estimated 15,505 ED visits were due to firearm injury of undetermined cause.
Type of Firearm Used
Table 3 identifies the type of firearm implicated in the ED visit. The plurality of injuries occurred from unspecified firearms (22.7-29.6%) or “other” (31.3-48.2%). Of the identified firearms, handguns were by far the most common (21.9-29.0%) particularly for the youngest presenting patients (age 0-4). Much less common were injuries due to shotguns (4.8-10.0%), hunting guns (1.2-6.6%), or military-style guns (0.2-0.6%).
Vital Status and Disposition from the ED
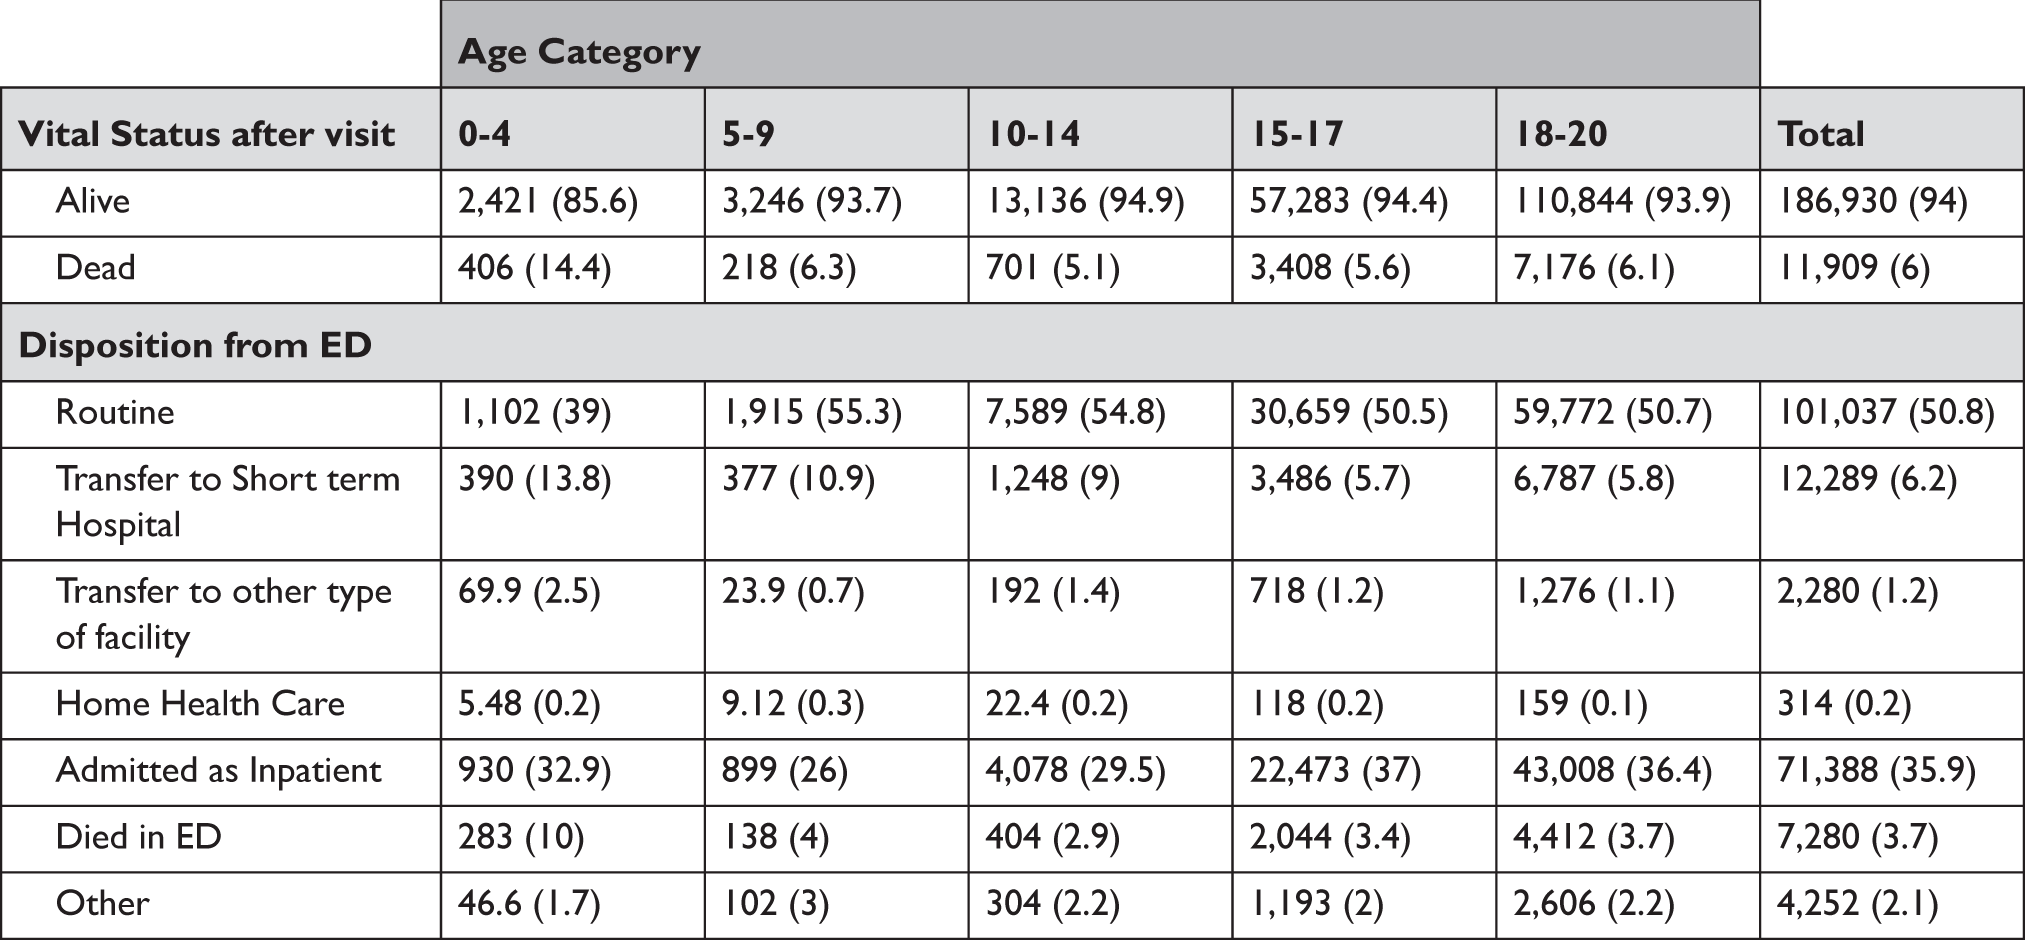
After presenting to the ED, there were an estimated 11,909 youth deaths from firearms in the years examined. In particular, the youngest patients (age 0-4) had the highest proportion of deaths after presenting to the ED (14.4%). There were 71,388 hospitalizations after presentation to the ED. Other dispositions are outlined in Table 4. Based on the NEDS data, suicide and self-inflicted injuries presented as the category with the highest death rate (89.2%) with the death rate increasing by age. Unintentional causes presented as the category with the lowest death rate (2.9%) with the death rate decreasing with age (Online Supplemental Table 2).
Vital Status after Visit and Disposition from ED by Age Category, weighted count (% of age cat) in 2006-2015

In comparing the number of deaths that occur after presenting to the ED, data from the CDC indicates a much higher overall burden of death from firearm injury (Online Supplemental Table 3), which may reflect the number of youth that die before presenting to the ED. Both the NEDS and CDC data demonstrate an increasing firearm injury trend by age for suicide and homicide (Online Supplemental Table 3).
Likelihood of Children Visiting the ED by Region
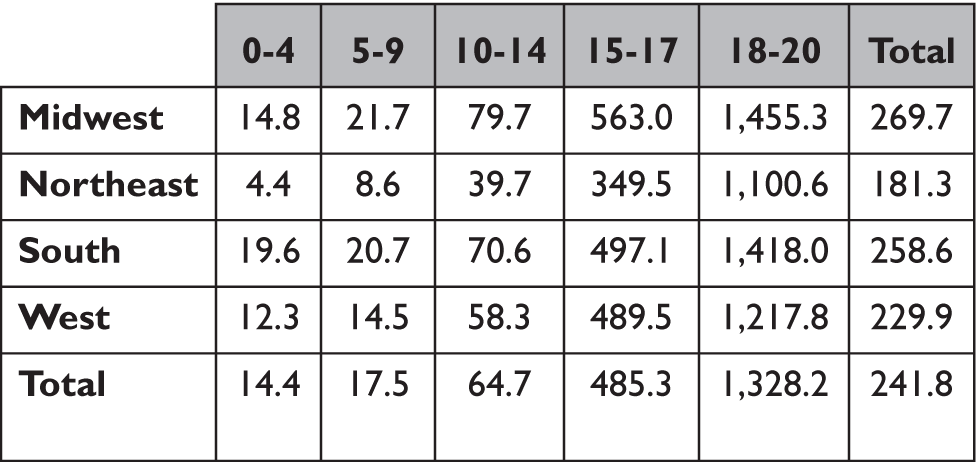
Table 5 demonstrates the gun-related ED visits per 100,000 children based on 2018 American Community Survey data. Children in the Midwest were 1.5 times more likely to visit the ED for a gun-related injury than children in the Northeast. Children in the South were 1.4 times more likely than children in the Northeast to present to the ED for a gun-related injury. Youths aged 18-20 were 92.3 times more likely to visit the ED for a gun-related injury than children aged 0-4. Children aged 0-4 in the South were 4.5 times more likely than children aged 0-4 in the Northeast to present to the ED for a gun-related injury. For a trend analysis, Online Supplemental Table 4 demonstrates the number of ED visits per 100,000 children based on 2018 American Community Survey data.
Gun-Related ED Visits from 2006-2015 per 100,000 Children in Each Region Using 2018 American Community Survey Data

Discussion
Firearm injuries are all too frequent among youth. Our sample estimated 198,839 emergency room visits and 11,909 deaths for youth age < 21. Injuries impacted all age groups and were particularly deadly for the youngest children, age 0-4. Firearm injuries occurred most frequently in males, individuals in the South, and most commonly presented to metropolitan emergency departments. Handguns were the most commonly identified firearm that caused injury, being almost 3 times as common as shotgun and hunting rifle injuries. It is evident that firearm injuries are a major public health problem for which a comprehensive strategy is needed. The high number of youth firearm injuries every year suggests urgent action is needed to protect youth. Stronger minimum age laws, safe storage laws, and child access prevention laws all aim to protect youth specifically, and should be further adopted, although better data on where and how these injuries occurred would allow for more specific policy recommendations.
The NEDS data does not contain detail about where the gun injury took place (e.g., in the home, outdoors) or who fired the weapon (e.g., other youth, an adult). However, the extent to which youth are being injured by firearms in the United States underscores the need for greater regulation targeted at protecting children and youth.
Minimum age laws, safe storage laws, and child access prevention (CAP) laws are examples of policies which explicitly aim to prevent youth access and exposure to firearms. Handguns were the weapon most likely used in the NEDS data. And while under federal law, a person must be 21 to buy a handgun from a federally licensed dealer, he must only be 18 to purchase a handgun from an unlicensed dealer in a casual sale. There is opportunity to raise the minimum age for handgun purchase to 21 for all sales.
Safe storage and CAP laws are policies which intend to keep firearms away from children in the home. While NEDS does not contain data about whether an injury was the result of a child having firearm access in the home, the most likely place a child can access a gun is in the home. A RAND survey of the evidence for CAP laws found that CAP laws may decrease the risk of unintentional injury and death in children.Reference Smart, Morral, Smucker, Cherney, Schell, Peterson and Ahluwalia7 Policymakers are urged to expand safe storage laws, which require that firearms be stored unloaded and locked, and CAP laws, which place liability on adults who permit youth to have access to a firearm without supervision.
There are significant medical implications of our study. Our work is consistent with a large body of work investigating youth firearm injuryReference Nelson, Dodington, Violano, Baum and Bechtel8 — and it is crystal clear that firearm-related injury is a significant issue for the youth population. Medical practitioners should make conversations about gun safety, including gun storage, part of routine medical care for any household with children. As firearm injury disproportionately impacts male youth, male youth especially should be targeted for education. Households with handgun ownership and youth should also be a focus for targeted intervention and education. This is particularly urgent as approximately 4.6 million youth live in homes in which at least one firearm is loaded and not locked in secure storage.Reference Azrael, Cohen, Salhi and Miller9 Given the over 190,000 emergency department visits for firearm injury for youth age < 21, the NIH should consider firearm injury for targeted research and interventions as well.
There are several limitations of our analysis. First, the National Emergency Department Sample provides estimates of patients who presented to an emergency department but does not include patients who die from injury and therefore do not present to the emergency department. Therefore, our study undercounts the number of youth firearm-related death and injury. Second, the NEDS data represents administrative data and not direct evaluation of written medical records. Misclassification of the cause of emergency room visits is therefore possible (e.g., within the “type of firearm” category, “other” likely includes some handgun and shotgun injuries due to data entry errors). Third, NEDS does not include data on the identity of who shot the firearm (e.g., a family member), where the injury took place (e.g., in the home), or race of the patient. Access to this information would allow better tailored policy recommendations. Fourth, while similar trends in death rate amongst age categories were seen when comparing the death rates in the NEDS data to CDC data, comparing different datasets presented with additional limitations. Though uncommon, some people may visit the ER multiple times and others do not present to the ER before dying. Lethal injuries that do not present to the ED are not accounted for in the NEDS dataset and therefore it is difficult to compare trends between the two datasets.
Finally, it is important to acknowledge similarities and differences in results between our analysis and those which have used other data sources, such as National Electronic Injury Surveillance System (NEISS),10 the National Hospital Ambulatory Medical Care Survey,11 and CDC data. The NEISS, sponsored by the National Center for Injury Prevention and Control of the Center for Disease Control and the US Consumer Product Safety Commission, samples from around 100 hospitals out of the 5000+ US hospitals with EDs. The NEISS collects data through information entered by an ED staff member and also conducts phone calls and on-site interviews. In a report in the journal Pediatrics, Fowler et al.12 reported only a fraction of deaths compared to the number that our study estimates. This difference stems from our inclusion of patients aged 18-20 as “youth,” whereas Fowler et al. included patients aged 0-17. We felt that it was important to include these patients aged 18-20 who, though legally adults, are often included as “youth” in epidemiologic studies. Furthermore, we felt that including these patients would more accurately reveal the breadth of injury caused by firearms. In a study whose results are more similar to ours, Srinivasan et al.13 used National Hospital Ambulatory Medical Care Survey (NHAMCS) data to estimate firearm injury for patients aged 0-19 years. Finally, CDC data indicates almost 6-fold more deaths than our study estimates (58,932 deaths in CDC vs. 11,909 deaths in NEDS). This is likely due to the lethal nature of many firearms injuries, causing death before presentation to ED is possible. We believe it is likely that our evaluation of the NEDS dataset greatly underestimates the morbidity and mortality from firearms injury in the US.
Conclusion
Youth firearm injury is a significant public health problem. If no action is taken and rates of firearms injuries continue at the same rate, then over a hundred thousand youth will likely present to the ED with a firearm injury over the coming decade and more than 10,000 youth will die. Male youth, youth in the South, and youth in environments with handguns — as opposed to shotguns — are particularly at risk for injury. Children aged 0-4 are at highest risk of death if they experience a firearm injury. The extensive burden of firearm injury on youth underscores the need for better policy to protect children in the United States. The federal minimum age should be raised to 21 for handgun purchase from all sellers (not just from federally licensed dealers), and safe storage and CAP laws should be expanded. With better data on who obtained the firearm, the location of the injury, and who fired the weapon, these policies could be more targeted. Further study and intervention to address this youth public health crisis is absolutely critical.
APPENDIX Supplemental Tables
Supplemental Table 1. E-Codes Used to Identify Patients in the NEDS Database That Presented to the ED for Firearm-Related Injury

Supplemental Table 2. Overall Death Rate from NEDS Data for Different Age Groups by Cause of Injury for the Years 2005-2016

Supplemental Table 3. CDC Data on Firearm Death Rates from CDC WONDER Database, for Years 2006-2015

ICD-10 cause of death codes for Unintentional injury (W32, W33, W34), Suicide (X72, X73, X74), Homicide (X93, X94, X95), Undetermined (Y22, Y23, Y24), and Legal Intervention / Operations of War (Y35.0, Y36.4) were used to classify injury intent. Crude rate per 100,000 was calculated by CDC WONDER. (http://wonder.cdc.gov)
Supplemental Table 3b. CDC Data on Firearm Death Rates From CDC WONDER Database, for Years 2006-2015

Firearm injury intent was classified by website menu option. Crude rate per 100,000 was calculated by CDC WONDER. (http://wonder.cdc.gov)
Supplemental Table 4. Gun-Related ED Visits from 2006-2015 per 100,000 Children Each Year Using 2018 American Community Survey Data