
Introduction
Water pollution has become one of the biggest concerns confronting human society attributing to the ever-increasing development of the industry.[Reference Garcia and Brillas1] Organic pollutants such as textile dyes, phenols, antibiotics, and pesticides contributed a large part to the water pollution, causing water ecosystem unbalanced, even humans cancer, and mutation.[Reference Schwarzenbach, Egli, Hofstetter, von Gunten and Wehrli2–Reference Loos, Locoro, Comero, Contini, Schwesig, Werres, Balsaa, Gans, Weiss, Blaha, Bolchi and Gawlik4] Conventional technologies such as adsorption, coagulation, chemical oxidation, and membrane separation, are applied for wastewater treatment. However, for adsorption and coagulation, they only remove pollutants from wastewater physically and cannot degrade pollutants into environmentally friendly compounds. And methodologies based on chemical and membrane techniques often suffer from high operating cost and secondary pollution.[Reference Khin, Nair, Bahu, Murugan and Ramakrishna5] Advanced oxidation processes, including photocatalysis, Fenton reaction, electrocatalysis, and ozonation, have emerged as a class of promising technologies for water purification due to their high degradation efficiency, easy handling, and good reusability. In particular, benefiting from the powerful ability to degrade a wide range of organic pollutants, photocatalysis has gotten a rapid development in water treatment.[Reference Klavarioti, Mantzavinos and Kassinos6, Reference Reddy, Reddy, Kwon, Kim, Akter and Kalagara7]
TiO2, one of the most promising semiconductor photocatalysts, has obtained a wide application in the field of environmental management due to the intrinsic characteristics of good chemical inertness, low cost, and nontoxicity. Nevertheless, the limited visible light utilization and rapid recombination of photogenerated electrons and holes enormously impeded the practical application of TiO2. For the purpose of taking full advantage of sunlight, many attempts that aimed to develop visible-light-active TiO2 nanomaterials, such as doping with transition metal ions or non-metals, photosensitizing, coupling with other semiconductors, and loading noble metals have been made, and the resultant materials exhibited enhanced photocatalytic performance for water treatment under visible light or sunlight.[Reference Pelaez, Nolan, Pillai, Seery, Falaras, Kontos, Dunlop, Hamilton, Byrne, O′Shea, Entezari and Dionysiou8] Unfortunately, these TiO2 photocatalysts are often in the form of the nanoparticle, which would be a great challenge to reclaim them from water to prevent the secondary pollution.[Reference Dong, Zeng, Tang, Fan, Zhang, He and He9] To this end, one-dimensional (1D) TiO2 nanomaterials with the characteristics of the large surface area, high aspect ratio, and good continuity, have been widely adopted to improve the recycling ability in water decontamination, meanwhile could maintain good photocatalytic activity.[Reference Wang, Li, Shi and Yu10, Reference Lee, Mazare and Schmuki11] Recently, electrospun nanofibers, as one of the representatives of 1D nanomaterials, have been considered as a promising candidate for practical applications owing to their intriguing properties of 1D nanomaterials and the ability to assemble into free-standing membranes.[Reference Wang, Si, Wang, Sun, El-Newehy, Al-Deyab and Ding12–Reference Si, Wang, Yan, Yang, Yu and Ding14] In addition, electrospun nanofibers can be easily modified via combining with other techniques such as hydrothermal, solvothermal, and in situ polymerization, thus showing great potential in exploring various kinds of visible-light-responsive TiO2.[Reference Zhang, Li, Shao, Li, Zhang, Zhang, Wang, Lu and Liu15–Reference Liu, Miao, Liu, Ding, Tjiu, Cui and Liu18]
In this Prospective paper, we will summarize the recent progress in the fabrication of visible-light-responsive TiO2-based electrospun nanofibrous materials for the degradation of organic water contaminants. Strategies for improving the photocatalytic activity of TiO2-based nanofibrous materials are highlighted. We begin this paper with the fundamental properties of electrospun TiO2 nanofibers (TNFs), and then concentrate on the manufacturing methods of visible-light-responsive TNFs for organic pollutants degradation. Finally, current challenges in association with the visible-light-responsive TiO2-based nanofibrous materials and outlooks are addressed.
Fundamental properties of TNFs
Phase structures
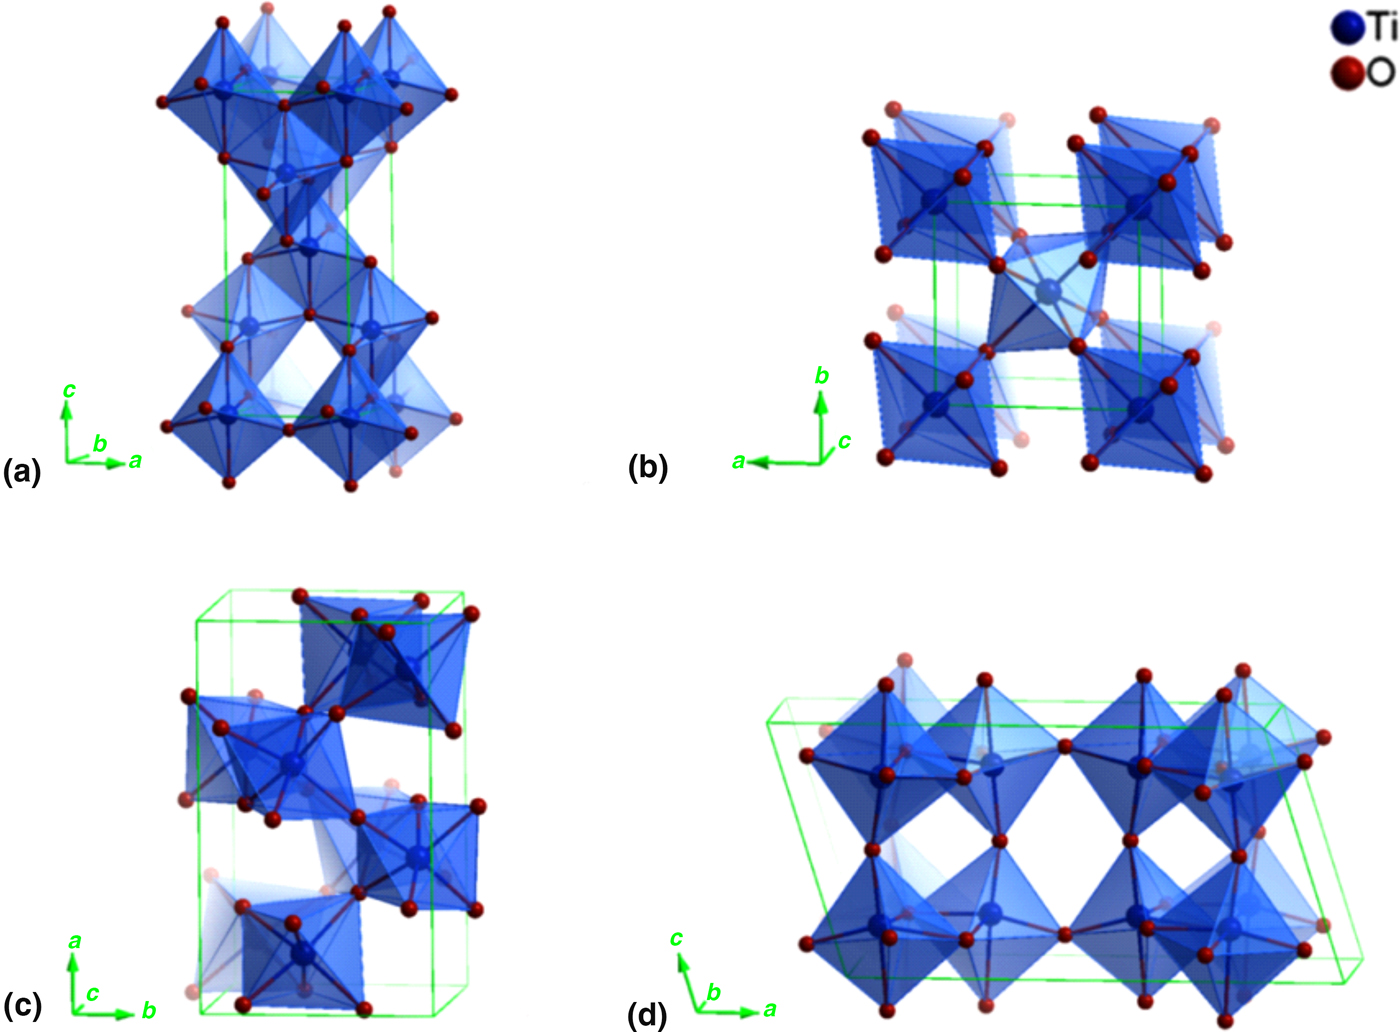
Phase structures play an important role in the photocatalysis reaction for TiO2. Up to now, four different polymorphs of TiO2 including anatase, rutile, brookite, and TiO2 (B) have been reported, all of which consist of TiO6 octahedra formed by one Ti4+ ion and six O2− ions. Phase structures lie with the spatial arrangement of TiO6 octahedra (Fig. 1). In anatase structure, four edges are shared for each octahedron, and octahedra link to each other through shared edges, resulting in zigzag chains parallel to {221} plane; as for rutile, two opposite edges are shared for each octahedron, which connects in linear chains in {001} direction.[Reference Ma, Wang, Jia, Chen, Han and Li19, Reference Gopal, Chan and DeJonghe20] Despite the difference in crystal form, anatase and rutile both exhibit a tetragonal structure. In brookite and TiO2 (B) not only edges but also corners are shared, giving orthorhombic and monoclinic structure, respectively.[Reference Tompsett, Bowmaker, Cooney, Metson, Rodgers and Seakins21, Reference Feist and Davies22]
Phase structures of TiO2: (a) anatase, (b) rutile, (c) brookite, and (d) TiO2 (B). Reprinted with permission from Ref. Reference Ma, Wang, Jia, Chen, Han and Li19 (American Chemical Society, 2014).

For electrospun TNFs, the phase structures can be regulated through changing the calcination parameters, especially the calcination temperature. Generally, the phase structure of TNFs transfers from anatase to anatase/rutile mixed-phase, then to rutile with the calcination temperature elevating. It should be noted that the phase transform temperature is not always the same, and it could be affected by impurities (e.g., cations, anions, and other metal oxides) which were introduced into TNFs, as well as the polymers in the electrospinning precursor solutions.
Basic photocatalytic reactions
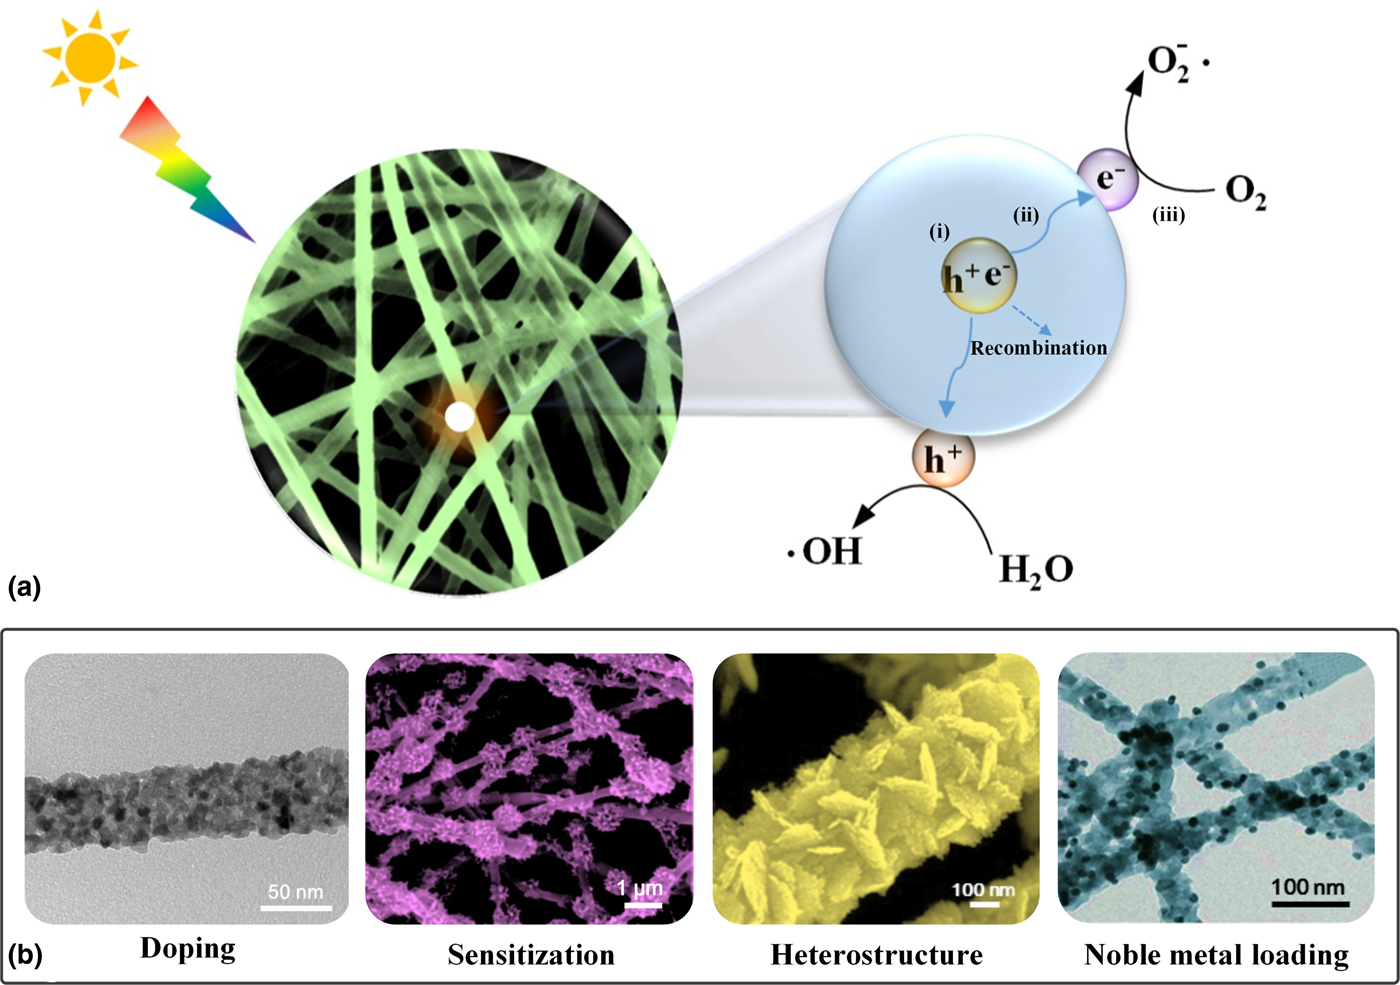
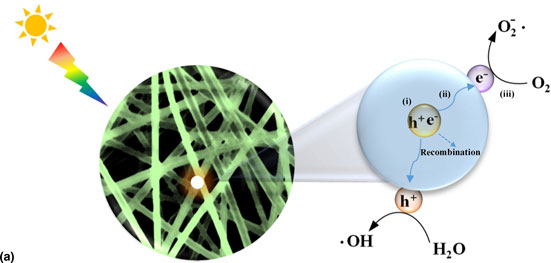
Photocatalytic processes of degrading organic pollutants into harmless substances in water based on electrospun TiO2 nanofibrous materials can be divided into three main steps, which are schematically shown in Fig. 2(a): (i) TiO2 absorbs photons with energy no less than the band gap (E g), and then electrons in valence band (VB) are excited to the conduction band (CB), forming electron-hole pairs with electron (e−) in CB and hole (h+) in VB; (ii) electron-hole pairs migrate in TiO2, leading to charge separation; (iii) photogenerated carriers that reach to the surface of TiO2 react with compounds in water.[Reference Wang, Tadé and Shao23] In step (iii), typically, the photogenerated holes oxidize the H2O to hydroxyl radical (·OH) [Eq. (1)]; the photoexcited electrons reduce molecular oxygen that adsorbed on the TiO2 to superoxide radical anion ( ${\rm O}_2^ - $) [Eq. (2)], which further reacts with H+ to generate hydroperoxyl radical (·OOH) and subsequently forms hydrogen peroxide (H2O2) [Eqs. (3) and (4)]. The resultant reactive oxygen species (ROS) (i.e., ·OH,
 ${\rm O}_2^ - $, ·OOH, and H2O2) can mineralize organic pollutants into CO2, H2O, and mineral salts [Eq. (5)].[Reference Rajeshwar, Osugi, Chanmanee, Chenthamarakshan, Zanoni, Kajitvichyanukul and Krishnan-Ayer24, Reference Tachikawa, Fujitsuka and Majima25]
 $${\rm h}^ + + {\rm H}_{\rm 2}{\rm O} \to \cdot {\rm OH} + {\rm H}^ + $$
 $${\rm e}^ - + {\rm O}_{\rm 2} \to {\rm O}_2^ - $$
 $${\rm O}_2^ - + {\rm H}^ + \to \cdot {\rm OOH}$$
 $$ \cdot {\rm OOH} + \cdot {\rm OOH} \to {\rm H}_{\rm 2}{\rm O}_{\rm 2} + {\rm O}_{\rm 2}$$
 $${\rm ROS} + {\rm pollutants} \ldots \to {\rm C}{\rm O}_{\rm 2} + {\rm H}_{\rm 2}{\rm O} + {\rm mineral}\,{\rm salts}$$
(a) Schematic illustration of photocatalytic reaction process on TiO2-based materials. (b) Images of TiO2-based electrospun nanofibers for visible-light photocatalysis, reprinted with permission from Ref. Reference Alves, Berutti and Bergmann27 (Elsevier, 2013), Ref. Reference Zhang, Shao, Guo, Zhang, Mu, Cao and Liu29 (American Chemical Society, 2011), Ref. Reference Shang, Wang, Zhang, Sun, Wang and Zhou31 (American Chemical Society, 2009), and Ref. Reference Misra, Singh and Gupta33 (The Royal Society of Chemistry, 2017), respectively.

It should be noted that the photogenerated electron-hole pairs may recombine or be captured by the defect sites before they migrated to the surface of TiO2. The efficiency of visible-light-driven photocatalytic processes underlying organic degradation depends on a great extent on the photocatalysts’ capability of absorbing visible, even infrared light, and their ability to suppress the rapid combination of photogenerated electron and hole.[Reference Chen, Liu, Yu and Mao26] In response to the need for more wide light absorption of TNFs under sunlight, concentrated efforts have been focused on varying their chemical composition by introducing certain cations or anions via one-step electrospinning, surface modification with photosensitizers, and so on.[Reference Boyer, Liu, Zhang, Ehrlich, McCarthy, Tong, DeCoste, Bernier and Jones17, Reference Alves, Berutti and Bergmann27–Reference Zhang, Shao, Guo, Zhang, Mu, Cao and Liu29] On the other hand, to achieve efficient charge separation, researchers have tried to construct nanostructures (e.g., nanoparticles, nanosheets, and nanorods) and load cocatalysts on the surfaces of TiO2 nanofibrous materials.[Reference Baiyila, Wang, Li, Sharileaodu, Li, Xu, Liu, Duan and Liu30–Reference Misra, Singh and Gupta33] Some representative visible-light-responsive TiO2-based nanofibrous materials are shown in Fig. 2(b).
TNFs with enhanced light harvesting ability
As mentioned above, light absorption plays an important role in the photocatalytic reaction. Pure TiO2 nanofibrous materials can only absorb ultraviolet light (UV) due to their intrinsic wide band gap (for anatase, E g = 3.2 eV). According to the principle that the more light TiO2 can absorb, the more excited charges are likely to be on the surface, which means that more charges can participate in the degradation of organic pollutants, enormous attempts have been taken to prepare TiO2-based nanofibers with a wide range of light absorption by doping with cations and/or anions to generate a new energy level, thus narrowing the band gap of TiO2, or by modifying the TNFs with photosensitizers that do not change the electronic band structure of TiO2.
Doping
As an effective strategy for modifying the electronic band structure of TiO2, doping TNFs with ions has been considered as a promising option to extend the absorption of TiO2 into the visible light region. Cations or anions introduced into TiO2 can replace the titanium atom or oxygen atom, thus altering the chemical composition of TiO2 and then changing the optical response.[Reference Chen and Mao34]
Doping with cations
Generally, cations doped TNFs are obtained through adding corresponding metal alkoxides or metal salts into precursor solutions for electrospinning followed by the calcination process. When doping with cations, a new energy level that can accept electrons from the VB is incorporated into the band gap of TiO2, thus narrowing the forbidden gap and rendering the doped TiO2 absorb light with longer wavelengths.
Different kinds of cations (e.g., Fe3+, V5+, W6+, and Er3+) have been introduced into electrospun TNFs to enhance the visible light photocatalytic performance, and a majority of efforts were concentrated on the doping with transition metal cations.[Reference Shahini, Ashkarran, Hamidinezhad and Bahari35–Reference Xu, Wang, Shang, Gao, Zhang and Ren41] Ruggieri et al. reported Cu-, W-, and Fe-doped electrospun TNFs, and studied the effects of doping dosage on the degradation rate of rhodamine 6 G (Rh6) under both visible light and natural sunlight.[Reference Ruggieri, Camillo, Maccarone, Santucci and Lozzi37] They found that when the concentrations of cations were 0.01 at.%, all the doped TNFs achieved the highest photocatalytic degradation efficiency under visible light irradiation, among which W-doped TNFs exhibited the best performance. While under natural sunlight, Cu- and Fe-doped TNFs still showed the highest degradation rate with doping concentration of 0.01 at.%, but for W-doped sample, the optimum concentration was 0.1 at.%. In such a condition, Fe-doped TNFs exhibited the best ability to remove Rh6 compared with Cu- and W-doped TNFs. It should be noted that the optimum doping concentrations are not changeless for degrading different organic pollutants. For example, in the research conducted by Shahini et al., the degradation rate of methyl orange reached the maximum value when the Fe content was about 0.18 at.%.[Reference Shahini, Ashkarran, Hamidinezhad and Bahari35] In addition to transition metals, rare earth metals that include lanthanide series, scandium, and yttrium, are also important dopants applied to prepare visible-light-responsive TNFs. In a typical experiment, rare earth metal salts are mixed with titanium alkoxides to form precursor solutions for electrospinning, and the lanthanide elements usually exist in the form of oxides rather than ions in TNFs due to their relatively large radii in comparison with Ti4+. Up to date, Er3+ is the most widely investigated rare earth ion to design visible-light-responsive TNFs for the degradation of organic pollutants including MO, rhodamine B (RhB) and phenol.[Reference Worayingyong, Sang-urai, Smith, Maensiri and Seraphin38–Reference Lee, Kim, Cho and Oh40]
Doping with anions
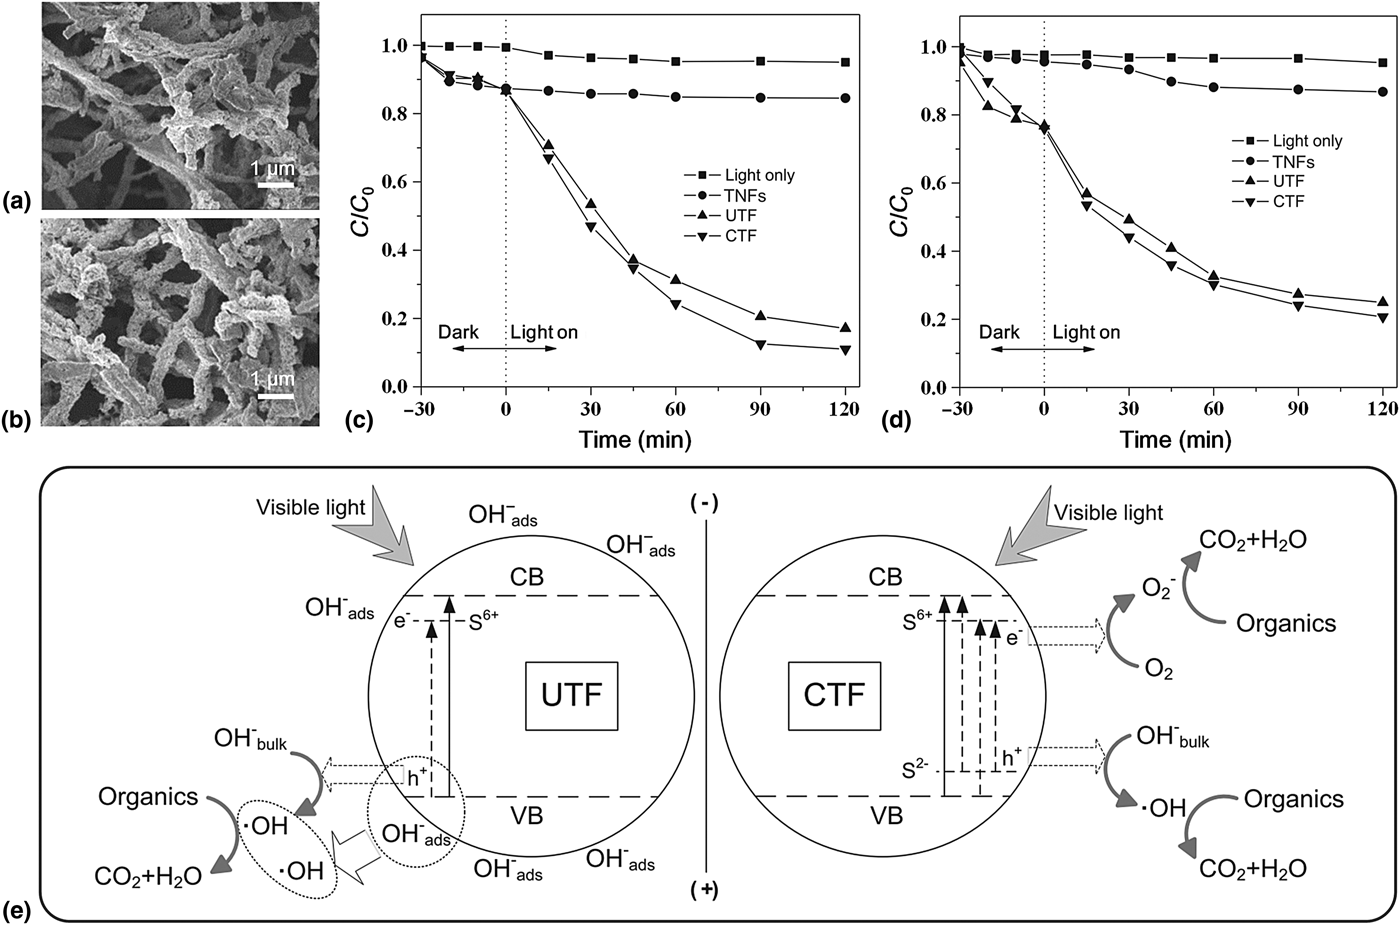
Since Asahi et al. demonstrated that nitrogen-doped TiO2 was effective for visible light photocatalysis in 2001,[Reference Asahi, Morikawa, Ohwaki, Aoki and Taga42] studies on anion-doped TiO2 have gotten a rapid development. Taking advantage of the unique properties of electrospun nanofibers as mentioned above, anion-doped TNFs received much attention.[Reference Camillo, Ruggieri, Santucci and Lozzi43, Reference Dai and Yin44] Different from cations-doped TiO2, anion-doped TiO2 extends light absorption through introducing a new energy level near the VB edge to narrow the band gap of TiO2. Up to now, TNFs have been doped with C, N, S, and so on to realize their photocatalytic water purification under the visible or solar light.[Reference Ma, Xin, Gao and Wu28, Reference Dai and Yin44, Reference Li, Zhang, Huang and Pan45] More recently, Ma et al. fabricated electrospun S-doped TNFs by adding two different sulfur sources—thiourea and CS2—to the precursor solutions, and the resultant nanofibers were named UTF and CTF, respectively (Fig. 3).[Reference Ma, Xin, Gao and Wu28] After calcination, the surfaces of the fibers became coarser, which resulted in many large interconnected holes in the TNFs, as well as the formation of a three-dimensional (3D) fibrous network [Figs. 3(a) and 3(b)]. Compared with bare TNFs, both of the UTF and CTF enhanced the ability to absorb visible light and obviously improved the degradation efficiency towards RhB and phenol, respectively [Figs. 3(c) and 3(d)]. Interestingly, CTF showed better photocatalytic performance than UTF, and this phenomenon was attributed to the different sulfur precursors. As shown in Fig. 3(e), in the UTF system, S6+ ions served as cations and formed intra-band-gap states close to the CB edges. While in the CTF system, anionic S-doped TNFs were generated, in which several new impurity levels were introduced between the CB and VB, and more oxygen vacancies were generated. As a result, anionic S-doped TNFs showed higher quantum efficiency than cationic S-doped materials.
Scanning electron microscope (SEM) images of (a) UTF and (b) CTF calcined at 500 °C. Visible light photodegradation plots of (c) RhB and (d) phenol. (e) Possible photodegradation mechanism of S-doped TNFs under visible-light irradiation. Reprinted with permission from Ref. Reference Ma, Xin, Gao and Wu28 (Elsevier, 2014).

Co-doping with cations and anions
Cation and anion co-doping has proven to be another effective approach to extend the visible light absorption range of TiO2. Recently, electrospun Fe3+ and N co-doped TNFs were prepared by Yu et al.[Reference Yu, Jin, Li, Wang and Liang46] and the best photocatalytic performance with the largest visible light absorption was obtained when the dosage of Fe3+ and N co-doping was 0.5%. Upon increasing the dosage of dopants more than 0.5%, the degradation rate got decreased, which could be attributed to the reason that at higher dosages the formed oxygen vacancies and Fe3+ acted as electron-hole recombination sites, thus suppressed photocatalytic activity.
Photosensitization
Surface modification utilizing photosensitizers that comprise organic dyes, conjugated polymers (CPs), narrow bandgap semiconductors, and quantum dots, has been widely investigated to improve the light harvesting ability of TiO2 nanofibrous materials.[Reference Boyer, Liu, Zhang, Ehrlich, McCarthy, Tong, DeCoste, Bernier and Jones17, Reference Liu, Miao, Liu, Ding, Tjiu, Cui and Liu18, Reference Zhang, Shao, Guo, Zhang, Mu, Cao and Liu29, Reference Zhang, Zhou, Fu and Wang47–Reference Li, Zhu, Cao, Yang and Li49] When visible light illuminates the sensitized TiO2 nanofibrous materials, photosensitizers will absorb the light first, then be excited and inject electrons into the CB of TiO2. Subsequently, the electrons in CB react with O2 to produce  ${\rm O}_2^ - $ which could degrade organic pollutants in the water. In addition, by virtue of the large specific surface area and 3D structure of electrospun TiO2 nanofibrous materials, more amount of sensitizers are able to exist on the surface of the TNFs, which favors the enhancement of photocatalytic performance for water purification.
Organic dyes sensitization
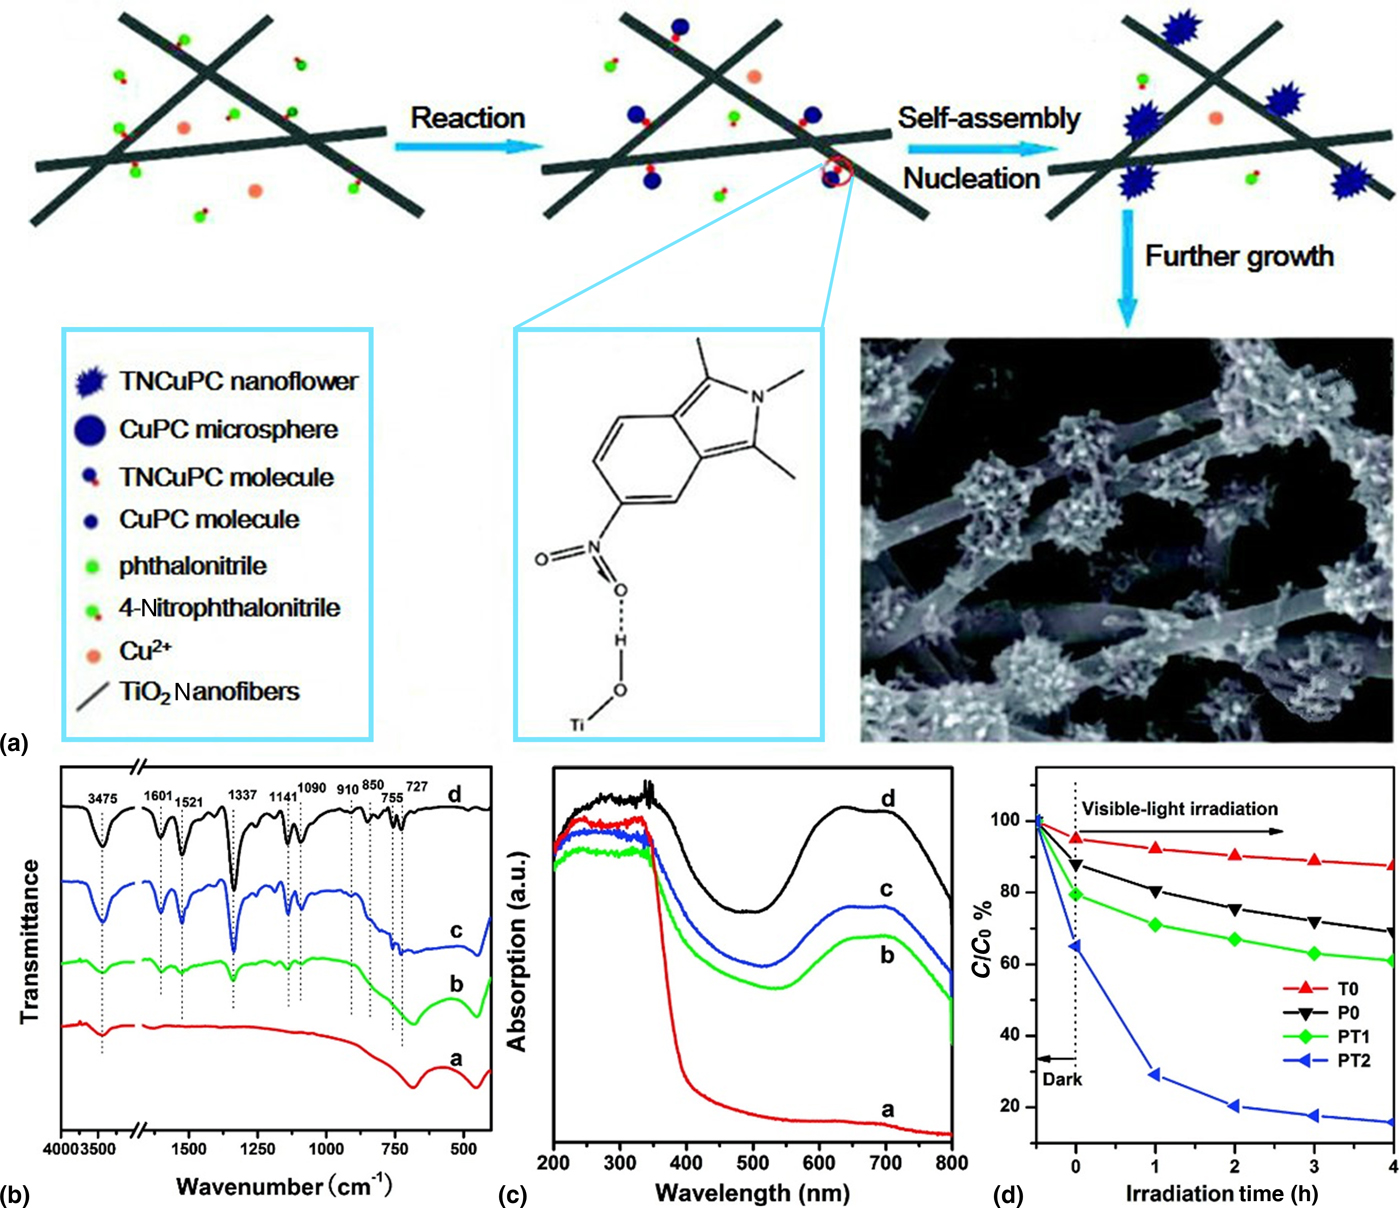
Organic dyes have been widely applied to improve the light absorption properties of TiO2 nanofibrous materials in term of water decontamination.[Reference Boyer, Liu, Zhang, Ehrlich, McCarthy, Tong, DeCoste, Bernier and Jones17, Reference Zhang, Shao, Guo, Zhang, Mu, Cao and Liu29, Reference Zhang, Zhou, Fu and Wang47] Metallophthalocyanines with advantages of nontoxicity and good chemical stability have become important parts of organic dyes. Zhang et al. synthesized visible-light-responsive TNFs with 2,9,1623-tetranitrophthalocyanine copper (II) (TNCuPc) as sensitizer through combining electrospinning technique with solvothermal treatment for the degradation of RhB [Fig. 4(a)].[Reference Zhang, Shao, Guo, Zhang, Mu, Cao and Liu29] It was found that the NO2 groups played an important role in the process of constructing TNCuPc/TiO2 hierarchical nanostructures. Due to the interactions between the NO2 groups of TNCuPc and the OH groups of TiO2, TNCuPc was successfully synthesized and robustly immobilized on the surface of TNFs [Fig. 4(b)]. Based on the introduction of TNCuPc, the developed composite presented visible light absorption in the range from 600 to 750 nm compared with bare TNFs [Fig. 4(c)]. As a result, under the illumination of 150 W xenon lamp (Xe lamp), TNCuPc/TiO2 degraded 87% of RhB in 4 h, while the degradation was only 9% for bare TNFs [Fig. 4(d)]. In addition to TNCuPc, tetranitrophthalocyanine zinc was also introduced onto TNFs, and resultant materials showed obvious visible light absorption compared with bare TNFs, as well as enhanced photocatalytic performance for the degradation of RhB.[Reference Zhang, Zhou, Fu and Wang47] Apart from the metallophthalocyanines, ruthenium (Ru) complexes were also applied to modify the TNFs, for example, Boyer et al. prepared cis-dichlorobis(2,2’-bipyridyl-4,4’-dicarboxylic acid) ruthenium (II) (Ru(dcbpyH2)2Cl2) sensitized TNFs for the degradation of phenazopyridine.[Reference Boyer, Liu, Zhang, Ehrlich, McCarthy, Tong, DeCoste, Bernier and Jones17]
(a) Schematic illustration of the synthesis of TNCuPc/TiO2 hierarchical nanostructures. (b) Fourier transform infrared spectra and (c) UV-vis reflectance spectra of the samples: bare TNFs (T0) (curve a), TNCuPc/TiO2 hierarchical nanostructures (PT1) (curve b), TNCuPc/TiO2 hierarchical nanostructures (PT2) (curve c) and TNCuPc without TNFs (P0) (curve d). (d) Changes of the concentration of RhB over different samples. Adapted with permission from Ref. Reference Zhang, Shao, Guo, Zhang, Mu, Cao and Liu29 (American Chemical Society, 2011).

CPs sensitization
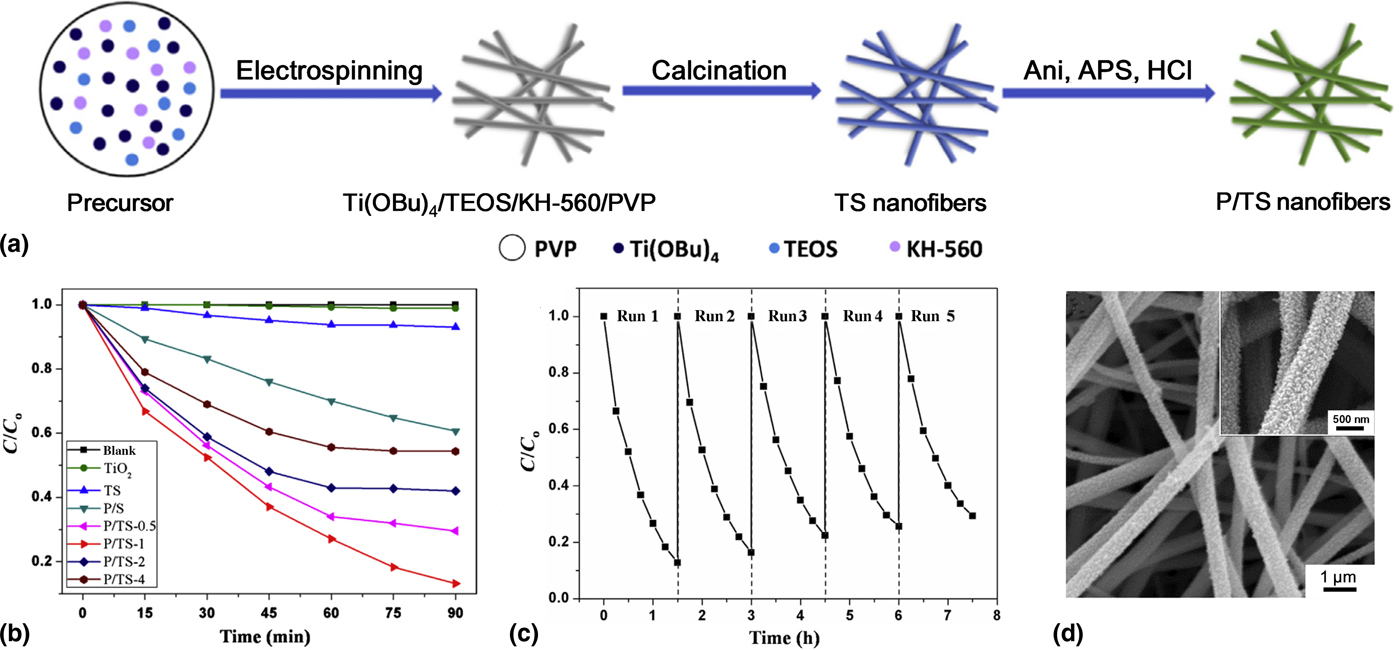
Modifying TNFs with polymers, especially CPs that possess fascinating properties associated with extensively delocalized π-network and conformationally restricted polymer chains, has obtained much attention. Recently, Liu et al. designed polyaniline (PANI) sensitized TiO2/SiO2 (P/TS) nanofibrous membranes through combining electrospinning technique with in situ polymerization method for the photocatalytic degradation of MO under visible light irradiation (Fig. 5).[Reference Liu, Miao, Liu, Ding, Tjiu, Cui and Liu18] Electrospun TiO2/SiO2 (TS) nanofibrous membranes served as the template for the polymerization of PANI, as shown in Fig. 5(a). The resultant material retained the benefits of electrospun nanofibrous materials for the diffusion of reactants as well as the enhanced visible light absorptions owing to the optimum loading amount of PANI. Benefiting from the strong hydrogen bonding interactions between hydroxyl groups of TS and aniline monomers, PANI were uniformly and firmly absorbed on the TS. Furthermore, the positively charged PANI and negatively charged MO interacted with each other chemically, which could promote the absorption as well as the degradation of MO [Fig. 5(b)]. After five recycling tests, the P/TS nanofibrous membranes still exhibited good photocatalytic performance with PANI nanoparticles robustly immobilized on the surface of TS nanofibers [Figs. 5(c) and 5(d)], showing an excellent reusability.
(a) Schematic diagram illustrating the preparation of P/TS nanofibrous membrane. (b) Visible-light photocatalytic degradation curves of MO on TiO2 powder, TS, PANI-coated SiO2 and P/TS nanofibrous membranes. (c) Concentration changes of MO during the five repeated processes on P/TS nanofibrous membranes. (d) SEM images of P/TS nanofibrous membranes after five cycles. Reprinted with permission from Ref. Reference Liu, Miao, Liu, Ding, Tjiu, Cui and Liu18 (Elsevier, 2014).

Quantum dots sensitization
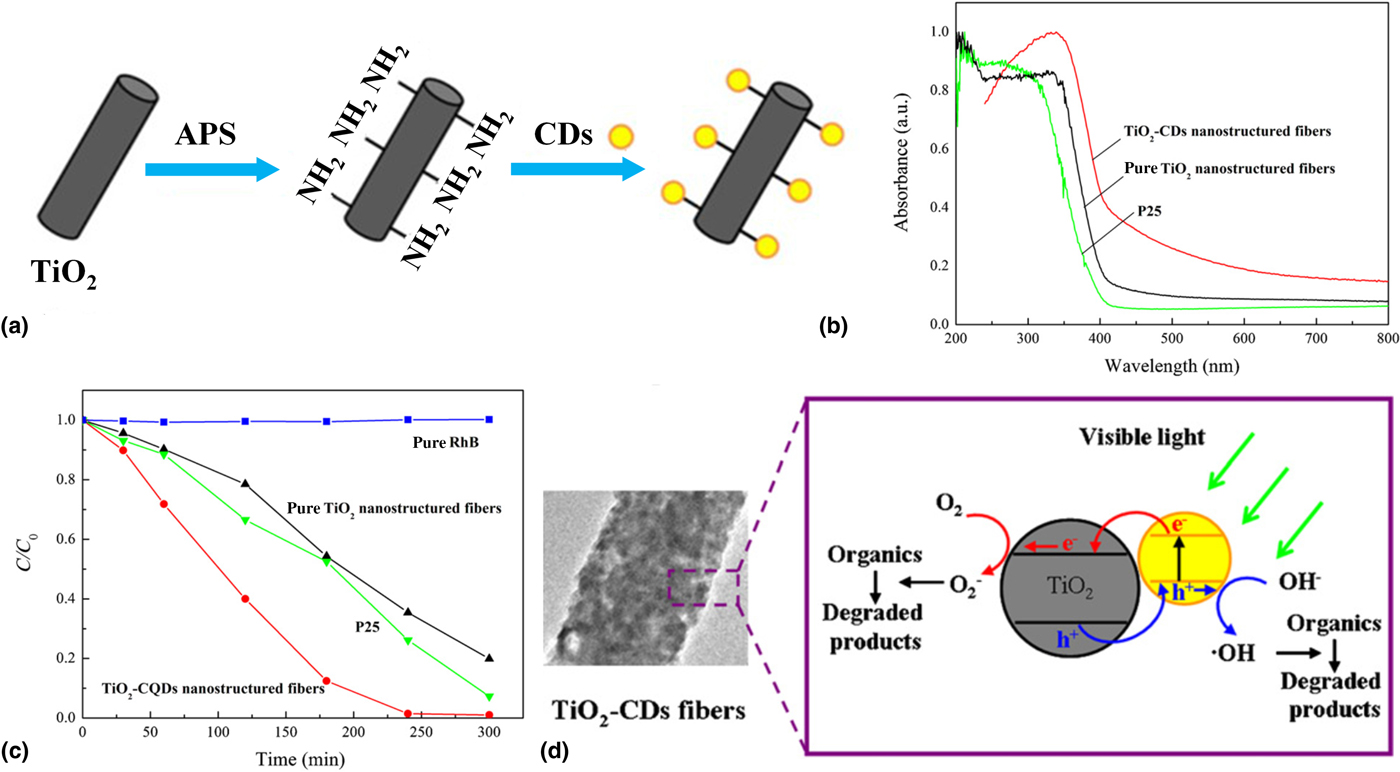
Quantum dots, with their unique properties associated with the ability to control light absorption range through changing the sizes and multiple exciton generation phenomena, can act as a class of potential component to develop photocatalytic materials.[Reference Likodimos50] On account of their ease of synthesis, low cost, non-toxicity, and up-converted photoluminescence, carbon quantum dots (CDs), one type of carbonaceous material, have great promise in visible-light photocatalysis.[Reference Yu, Shi, Zhao, Waterhouse, Wu, Tung and Zhang51, Reference Hu, Wei, Chang, Trinchi and Yang52] Recently, Li et al. demonstrated the fabrication of CDs-sensitized TNFs with CDs on the surface of TNFs via reflux method (Fig. 6).[Reference Li, Zhu, Cao, Yang and Li49] TNFs were dispersed in ultra-pure water, then a certain amount of 3-aminopropyl trimethoxysilane (APS) which functioned as a bridge to connect the TiO2 and CDs, and CDs aqueous solution were added to the above suspension in turn [Fig. 6(a)]. The resultant materials presented light absorption ability in the visible region and enhanced photocatalytic performance for RhB degradation [Figs. 6(b) and 6(c)], which was attributed to the inherent properties of CDs as well as a joint electronic system formed between TiO2 and CDs. As illustrated in Fig. 6(d), CDs were excited through absorbing visible light, and injected electrons into the CB of TiO2, then reduction and oxidation reaction took place on the surfaces of TiO2 and CDs, respectively.
(a) Schematic illustration of the formation of TiO2-CDs nanostructure fibers. (b) UV-vis diffuse reflectance spectra of P25, bare TNFs and TiO2-CDs nanostructured fibers. (c) Time-dependent visible light photocatalytic degradation of RhB. (d) A mechanistic proposal for the degradation of RhB under visible light irradiation. Reprinted with permission from Ref. Reference Li, Zhu, Cao, Yang and Li49 (Elsevier, 2013).

TNFs with promoted charge separation ability
Efficient photogenerated charge separation is another pivotal factor that determines the photocatalytic performance under visible light irradiation. When coupling TiO2 with another semiconductors to form heterostructures, the photogenerated electrons and holes will transfer to each other owing to their different positions of CB and VB. Electrons in a semiconductor with more negative CB level will transfer to the CB of the other semiconductor, and holes in a semiconductor with more positive VB level will transfer to the VB of the other semiconductor, thus realizing the separation of electron-hole pairs. Therefore, construction of heterojunction has been regarded as one of the effective strategies to promote the charge separation of TiO2-based nanofibrous materials.[Reference Wan, Wang, Yang, Si, Chen, Ding, Sun, El-Newehy, Al-Deyab and Yu53–Reference Han, Wang, Lei, Wang, Wu, Shi and Li57] In addition, loading metal catalysts with a large work function (e.g., Pt, Au, and Ag) on the surface of TNFs, is another strategy to effectively retard electron and hole recombination owing to the Schottky barrier at the interface of metals and TiO2.[Reference Su, Liu, Zhang, Zhang and Shao58–Reference Shahini and Ashkarran60]
Construction of heterojunction
Generally, electrospun TiO2-based photocatalysts with heterojunction are fabricated through two ways: (1) growing or loading other semiconductors onto the surfaces of TNFs via hydrothermal, solvothermal, and so on;[Reference Zhang, Li, Zhang and Wang32, Reference Mu, Chen, Zhang, Guo, Zhang, Zhang, Sun, Shao and Liu54, Reference Li, Lin, Chen, Niu, Liu, Zhang and Qu55] (2) electrospinning the mixed precursor solutions of TiO2 and other semiconductors, then followed by a calcination process.[Reference Wang, Liu, Huang, Li, Cao, Xu, Meng, Wang and Zhu61, Reference Li, Hao, Zhang, Shao and Hu62] The semiconductors coupled with TNFs can be classified into the following types: metal oxides,[Reference Zhang, Li, Zhang and Wang32] metal sulfides,[Reference Li, Chen, Niu, Han, Zhang, Liu, Lin and Qu63] carbon-based materials [e.g., graphene oxide (GO)],[Reference Zhang, Zhang, Xie, Guo, Lyu, Li, Sun, Wang and Guo64] bismuth-based materials,[Reference Liao, Ma, Dong and Qiu65] and other semiconductors [e.g., graphitic carbon nitride (g-C3N4)].[Reference Han, Wang, Lei, Wang, Wu, Shi and Li57]
Metal oxide/TiO2 composites
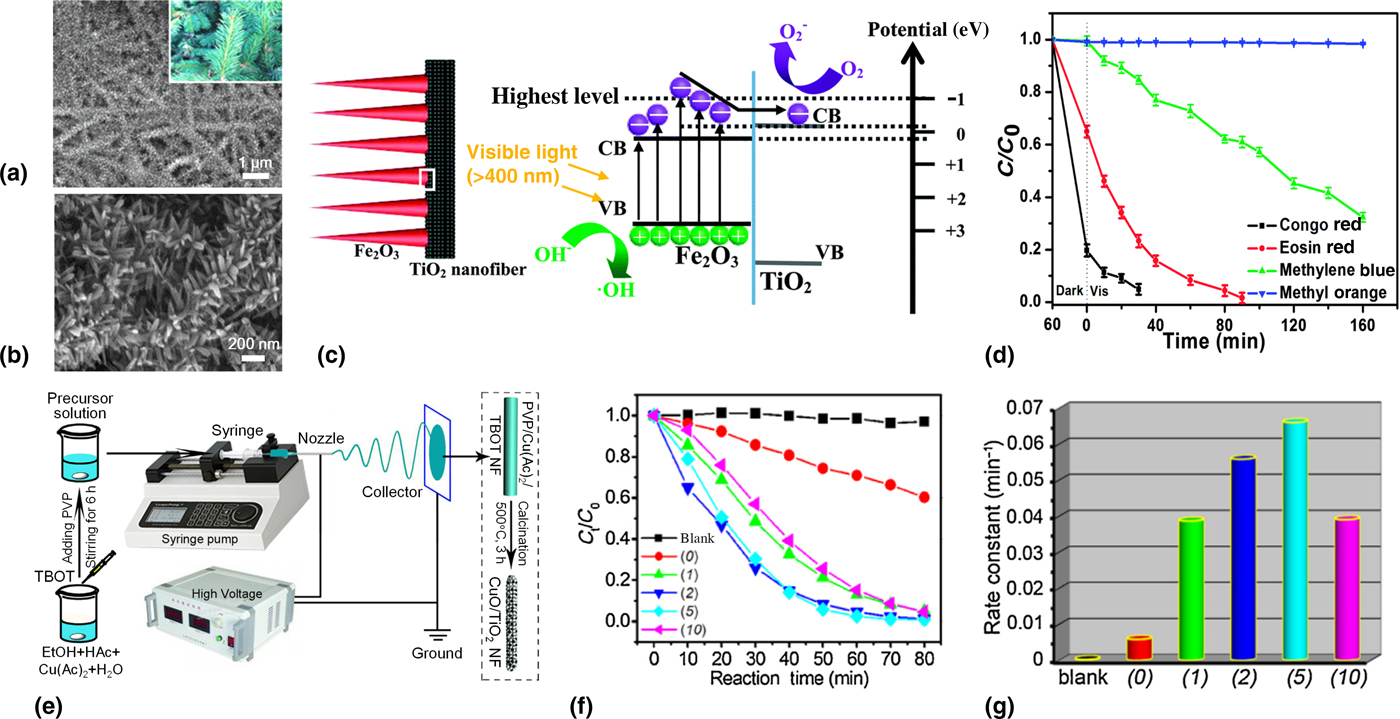
For the past few years, the coupling of TNFs with metal oxides that possess narrow band gap has been demonstrated to be an effective approach to decrease the recombination rate of the photogenerated electron-hole pairs.[Reference Wang, Su, Qiao, Liu, Su, Zhu and Liu66–Reference Wang, Zhang, Liu, Zhu, Liu and Su68] Recently, Li et al. prepared novel branch-like nanocomposites with plenty of hematite (ɑ-Fe2O3) nanorods on the electrospun TNFs through the combination of an electrospinning method and a hydrothermal approach [Figs. 7(a) and 7(b)].[Reference Li, Lin, Chen, Niu, Liu, Zhang and Qu55] The 3D interconnected framework made up of staggered nanofibers provided an ideal platform for the loading of ɑ-Fe2O3. As illustrated in Fig. 7(c), upon visible light, reached the surface of ɑ-Fe2O3/TiO2 composites, electrons in VB of ɑ-Fe2O3 were excited to the corresponding CB. Electrons in the high-energy region of ɑ-Fe2O3 transferred to the CB of TiO2, while holes retained in its VB, which realized effective charge separation. Benefiting from the enhanced separation of electrons and holes, high specific surface area derived from the branch-like structure, and an appropriate proportion of ɑ-Fe2O3 and TiO2, the as-prepared materials presented reinforced visible light degradation abilities towards Congo red (CR), eosin red, methylene blue (MB), and MO [Fig. 7(d)]. In addition, as an anionic dye, CR exhibited strong electrostatic interactions with the as-prepared composites, meanwhile, its 1D long-chain could be highly adsorbed by 1D fibers, thus it could be degraded more effectively as compared with other dyes under the same experimental conditions.
SEM images of the α-Fe2O3/TiO2 heterostructure in low (a) and high resolution (b), and the inset in (a) is the possible corresponding morphology graph. (c) Schematic illustration of the charge separation between TiO2 and Fe2O3 in the α-Fe2O3/TiO2 heterostructure under visible light. (d) Photocatalytic degradation curves of different dyes under visible light irradiation. Reprinted with permission from Ref. Reference Li, Lin, Chen, Niu, Liu, Zhang and Qu55 (The Royal Society of Chemistry, 2016). (e) Schematic for the fabrication of CuO/TiO2 hybrid nanofibers. (f) Changes in RhB concentration with the increasing of irradiation time. (g) Photodegradation rate constants of RhB. (0), (1), (2), (5), and (10) represent the mass percentage of CuO in CuO/TiO2 nanofibers, and “blank” means without any photocatalysts. Reprinted with permission from Ref. Reference Li, Hao, Zhang, Shao and Hu62 (Elsevier, 2017).

To further increase the heterojunction interfaces, more recently, CuO/TiO2 hybrid nanofibers were fabricated via electrospinning a homogeneous solution of tetrabutyl titanate (TBOT), cupric acetate [Cu(Ac)2·H2O], ethanol (EtOH), acetic acid (HAc), as well as polyvinylpyrrolidone (PVP), then followed by calcination process [Fig. 7(e)].[Reference Li, Hao, Zhang, Shao and Hu62] Through one-step electrospinning, both of the CuO and TiO2 were contained within the nanofibers, which endowed a large amount of heterojunction interfaces between the two components, thus facilitated better electron-hole separation via an interfacial charge transfer process. The developed nanofibrous materials exhibited an obvious enhancement of the photocatalytic degradation of RhB under visible light irradiation, and 10.6 times of the reaction rate with respect to that of bare TNFs [Figs. 7(f) and 7(g)].
Metal sulfide/TiO2 composites
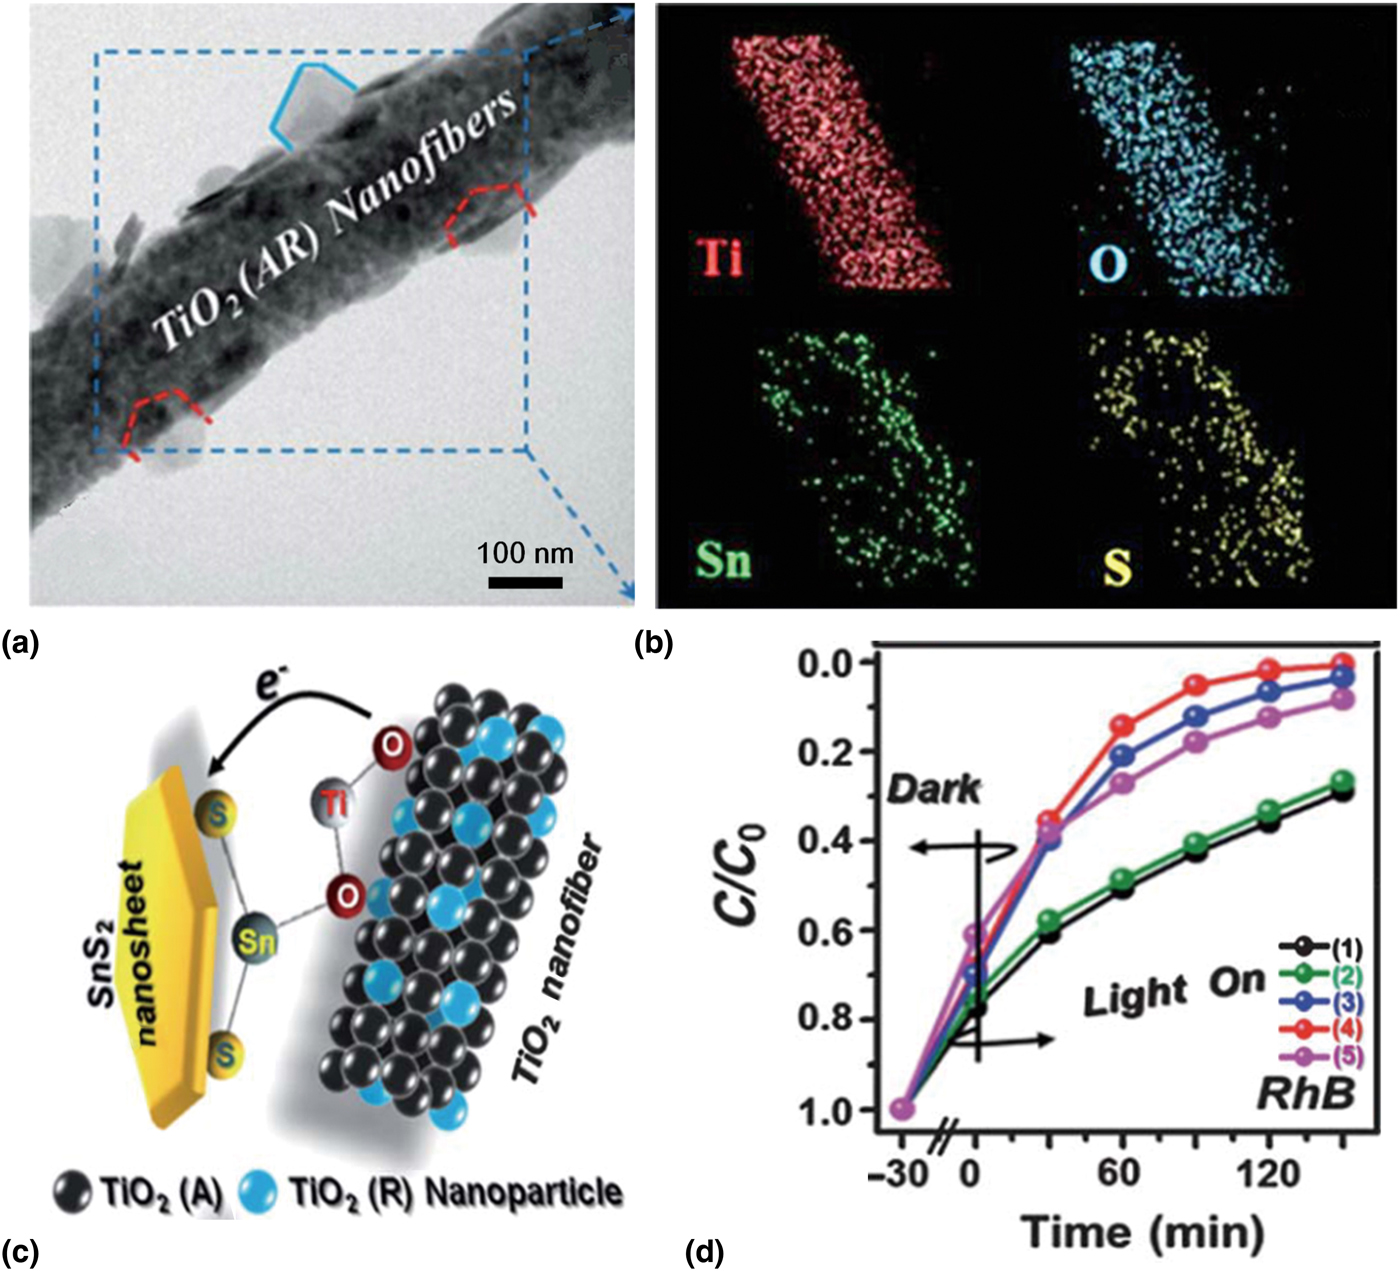
As an important class of narrow band gap semiconductors, metal sulfides are usually used to form composites with TiO2. CdS is one of the most widely investigated metal sulfides to couple with TNFs.[Reference Li, Chen, Niu, Han, Zhang, Liu, Lin and Qu63, Reference Yang, Zhang, Chang and Yan69, Reference Chang, Ren, Yang, Yan and Sun70] Despite the fact that CdS materials have a narrow band gap of ~2.4 eV and a favorable band alignment with TiO2 for effective photogenerated charge transfer, which make them an ideal candidate for fabricating heterojunction with TNFs, the high toxicity of Cd2+ poses an obstacle to their practical application. To tackle this problem, narrow band gap metal sulfides with low toxicity such as In2S3 and SnS2 have been paid intensive attention to be coupled with TNFs.[Reference Zhang, Li, Shao, Li, Zhang, Zhang, Wang, Lu and Liu15, Reference Zhang, Shao, Li, Sun, Zhang, Mu, Zhang, Guo and Liu71] A typical example is given by the study of SnS2 nanosheets assembled onto electrospun TNFs via hydrothermal method.[Reference Zhang, Shao, Li, Sun, Zhang, Mu, Zhang, Guo and Liu71] The as-prepared SnS2/TiO2 composite with a mixed-phase structure of TiO2 containing both anatase and rutile (AR) presented rough surfaces decorated with highly dense SnS2 nanosheets. As shown in Figs. 8(a) and 8(b), the grown SnS2 nanosheets were in hexagonal structures and lay uniformly on the surface of TNFs. Interestingly, it was demonstrated that the flat-lying growth of SnS2 nanosheets on the TNFs made the interfacial lattice mismatch between SnS2 nanosheets and TiO2 relative low, which meant the formed interface was less defective and abrupt, thus facilitating the transfer of the charges. Furthermore, a bond configuration of S-Sn-O-Ti was formed at the SnS2/TiO2 interface, indicating the existence of heterojunction interfaces which could provide a channel for improving the charge carrier transfer [Fig. 8(c)]. Based on the successful construction of heterojunction between SnS2 nanosheets and TNFs, the SnS2/TiO2 (AR) materials showed the best visible-light photocatalytic activity among the as-prepared samples [Fig. 8(d)].
(a) Transmission electron microscope (TEM) image of SnS2/TiO2 (AR) hierarchical nanostructures. (b) Elemental mapping images of Ti, O, Sn, and S. (c) Schematic showing the possible bonding configurations of the SnS2/TiO2. (d) Concentration changes of RhB as a function of irradiation time on different samples: (1) TNFs (anatase phase), (2) TNFs (AR), (3) SnS2/TiO2 (anatase phase), (4) SnS2/TiO2 (AR), and (5) SnS2 nanosheets. Reprinted with permission from Ref. Reference Zhang, Shao, Li, Sun, Zhang, Mu, Zhang, Guo and Liu71 (The Royal Society of Chemistry, 2013).

Carbon-based materials/TiO2 composites
Carbon-based materials (e.g., carbon nanotubes, GO, and CDs), possess the property of large electron storage capacity that can capture the photogenerated electrons and enhance the charge transfer across the interface, and the ability to adsorb organic pollutants on the surface of photocatalysts.[Reference Kongkanand, Domínguez and Kamat72, Reference Zhao, Liu, Cao, Zhan, Shi, Yang, Zhou and Xu73] In recent years, coupling TNFs with carbon-based materials has gained a lot of attention. Zhang et al. reported the visible light photocatalytic degradation of RhB on TiO2/carbon core/shell (TiO2@C) nanofibers which were fabricated by combining the electrospinning technique with hydrothermal method.[Reference Zhang, Shao, Zhang, Zhang, Mu, Guo and Liu74] It was demonstrated that the graphite carbon shell was deposited on the surface of TNFs via C-O-Ti bonds, as a result, the as-prepared composite exhibited high separation efficiency of photogenerated electrons and holes. In a further study, Ag nanoparticles (Ag NPs) were incorporated onto the surface of TiO2@C nanofibers via an in situ reduction approach, in which the Ag NPs dispersed well inside the carbon layer.[Reference Zhang, Shao, Zhang, Zhang, Mu, Guo, Sun and Liu75] Moreover, after three cycles of photocatalytic test for the degradation of RhB, Ag NPs still highly dispersed in the carbon layer with insignificant loss. Benefiting from the photosynergistic effect among the TiO2, carbon, and Ag, the designed TiO2@C/Ag nanofibers exhibited better photocatalytic degradation performance to RhB than TiO2@C nanofibers.[Reference Zhang, Shao, Zhang, Zhang, Mu, Guo and Liu74] Recently, based on its superior electrical conductivity, large specific surface area, and excellent structural flexibility, GO was introduced into the precursor solution of TiO2 for the organic pollutants degradation.[Reference Zhang, Zhang, Xie, Guo, Lyu, Li, Sun, Wang and Guo64] For this fabricated materials, TNFs were segregated by GO nanosheets, and compared with bare TNFs, the recombination of electrons and holes was effectively inhibited. Consequently, the photocatalytic reaction apparent rate constant of TiO2/GO composite nanofibers is 14.8 times higher than that of bare TNFs for the degradation of MB. In addition, the TiO2/GO composite nanofibers showed effective recyclability after four times photocatalytic test.
Bismuth-based materials/TiO2 composites
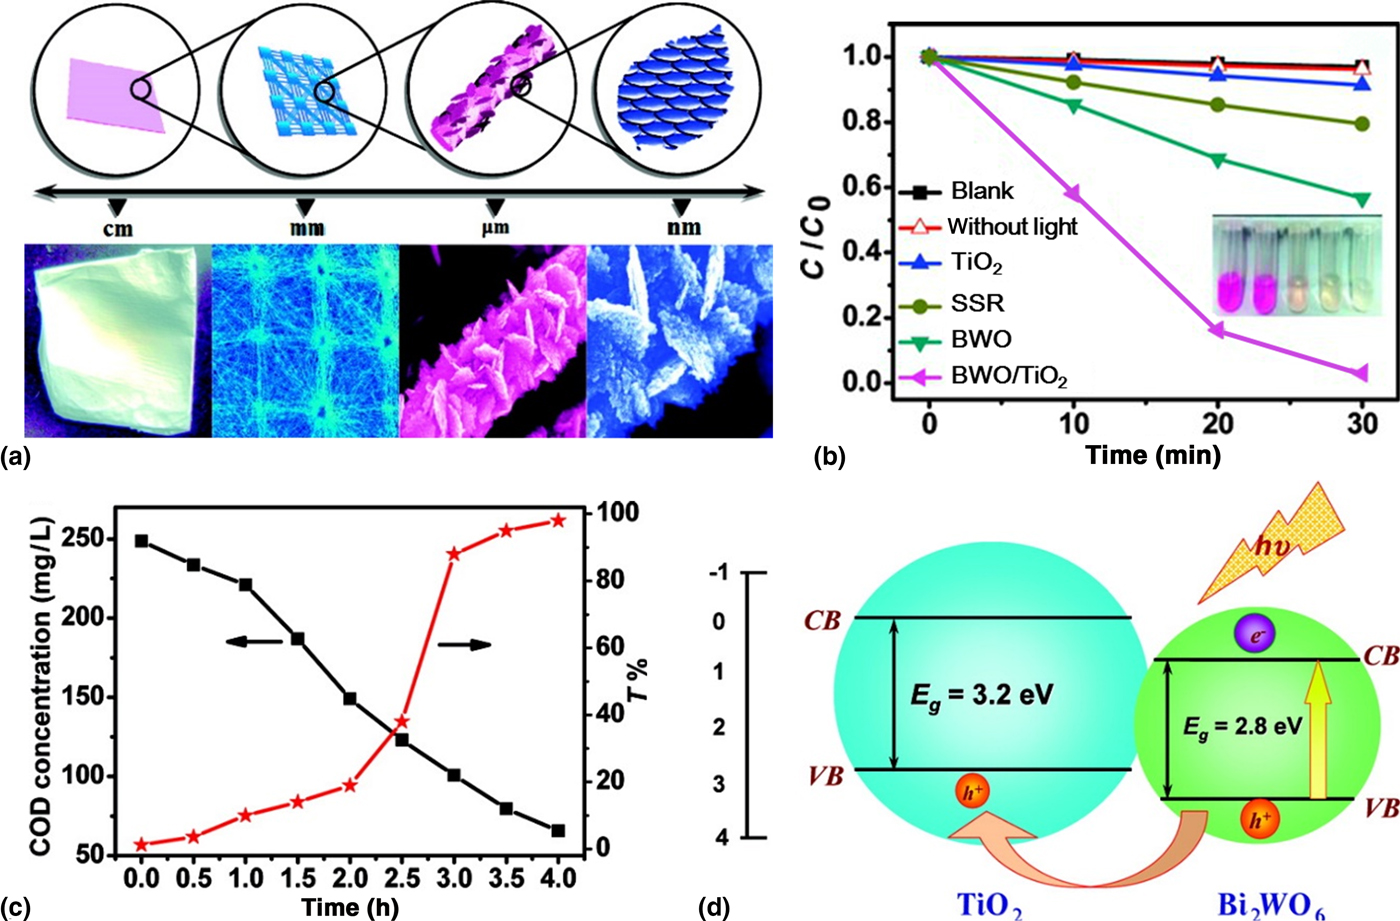
The unique property that the electronic structure comprises Bi 6s orbital and O 2p orbital in valence band, renders bismuth-based nanomaterials a narrow band gap (less than 3.0 eV) and good visible-light-responsive ability.[Reference Zhao, Li and Zou76, Reference Noguchi, Goto, Miyayama, Hoshikawa and Kamiyama77] Up to now, bismuth-based materials that were coupled with TNFs for water purification mainly include bismuth oxyhalides (BiOX, X = Br, I),[Reference Liao, Ma, Dong and Qiu65, Reference Luo, Chen, Huang, Liu and Fang78, Reference Wang, Sunarso, Zhao, Ge and Chen79] bismuth oxide (Bi2O3),[Reference Li, Cao, Shao and Wang80] bismuth titanate (e.g., Bi4Ti3O12 and Bi2Ti2O7),[Reference Cao, Li, Wang, Zhang, Zhang, Shao and Liu81, Reference Zhou, Zhang, Tu, Tian, Cai, Hu and Zhu82] bismuth tungstate (Bi2WO6),[Reference Shang, Wang, Zhang, Sun, Wang and Zhou31] bismuth vanadate (BiVO4),[Reference Guo, Li, Che, Wang, Wu, Zhang and Mu83] bismuth molybdate (Bi2MoO6),[Reference Zhang, Shao, Mu, Zhang, Guo, Zhang and Liu84] and bismuth ferrite (BiFeO3).[Reference Yang, Liu, Wei, Pan, Xiong and Shi85] Benefiting from the high porosity and large surface area of electrospun nanofibers, TNFs show great promise for the growth and uniform distribution of secondary nanostructures.[Reference Zhang, Shao, Mu, Zhang, Guo, Zhang and Liu84, Reference Zhang, Wang, Song, Si, Zhuang, Yu and Ding86–Reference Kanehata, Ding and Shiratori88] In the study of fabricating Bi2WO6/TiO2 nanocomposites, Shang et al. found that TNFs were an indispensable substrate for the growth of Bi2WO6 nanoplates. In other words, without TNFs, Bi2WO6 only existed in the form of nanoparticles.[Reference Shang, Wang, Zhang, Sun, Wang and Zhou31] As shown in Fig. 9(a), a patterned TNFs with slant Bi2WO6 nanoplates that were composed of densely packed nanoparticles were fabricated, and many pores were found among the nanoplates, thus providing more active sites and small molecules transporting paths for degrading the pollutants efficiently. Compared with bare electrospun TNFs and powdery Bi2WO6/TiO2 that was obtained via solid-state reaction, the designed nanocomposites showed distinct enhancement for the decomposition of RhB under visible light [Fig. 9(b)]. From the aspect of the practical application, the mineralization degree of the organic pollutants is an important indicator for measuring the photocatalytic activity of photocatalysts, and generally, it could be evaluated through testing the chemical oxygen demand (COD) or total organic carbon.[Reference Shang, Wang, Zhang, Sun, Wang and Zhou31, Reference Zhang, Liu, Xiu, Lu, Sun and Liu89] As shown in Fig. 9(c), the COD concentration decreased and the transmittance increased significantly with increasing irradiation time, which further indicated the degradation ability of Bi2WO6/TiO2 in water purification. Under the visible light irradiation Bi2WO6 was excited, and due to the VB level of Bi2WO6 was lower than that of TiO2, holes transferred from Bi2WO6 to TiO2, while electrons maintained in the CB of Bi2WO6, thus realizing the separation of charge carriers [Fig. 9(d)]. Additionally, the loosely packed structure of TNFs which acted as the holes-accepting semiconductors could facilitate more holes on the TiO2 surface and electrons on the Bi2WO6 surface, thus enhancing the photocatalytic reaction.
(a) The sketch map and images of Bi2WO6/TiO2 hierarchical heterostructures at different magnifications. (b) Photocatalytic degradation of RhB in the presence of different catalysts under visible-light irradiation. (c) Variations of COD and transmittance of RhB aqueous solutions with irradiation time. (d) Schematic diagram for energy band matching and electron-hole separation. Reprinted with permission from Ref. Reference Shang, Wang, Zhang, Sun, Wang and Zhou31 (American Chemical Society, 2009).

In addition, when coupling bismuth-based materials with TNFs, the morphologies of secondary structures are also an important factor affecting the photocatalytic performance. In certain cases, during the process of constructing secondary structures on TNFs, with the increase of precursor concentration, bismuth-based materials evolved from nanoparticles to nanosheets/nanoplates, then to bigger size nanoparticles. It was demonstrated that bismuth-based materials in the forms of nanosheets/nanoplates favored more for the photocatalytic reaction than nanoparticles, which was ascribed to the higher specific surface area of nanosheets/nanoplates.[Reference Liao, Ma, Dong and Qiu65, Reference Zhang, Shao, Mu, Zhang, Guo, Zhang and Liu84]
Other semiconductors/TiO2 composites
In addition to the aforementioned materials that coupled with TNFs, semiconductors such as g-C3N4, Ag3PO4, and InN, are also utilized to develop novel TiO2-based visible-light-responsive photocatalysts.[Reference Han, Wang, Lei, Wang, Wu, Shi and Li57, Reference Xie, Yang, He, Cheng, Mao, Jiang, Song and Xiong90, Reference Su, Li, Chen, Hu and Yan91] In particular, as a new metal-free and visible-light-active semiconductor, g-C3N4 possesses characteristics of the suitable band gap (2.7~2.8 eV), low cost, ease of preparation, high chemical stability, and pollution-free, thus its coupling with TNFs has gained incessant research interest.[Reference Jiang, Yuan, Pan, Liang, Zeng, Wu and Wang92] To form g-C3N4/TiO2 heterojunction, approaches involving blending electrospinning and two-nozzle electrospinning, as well as combining electrospinning with other techniques (e.g., in situ evaporation and gas-solid reaction) are applied.[Reference Han, Wang, Lei, Wang, Wu, Shi and Li57, Reference Adhikari, Awasthi, Kim, Park and Kim93–Reference Zhou, Shao, Li, Wang, Guo and Liu95]
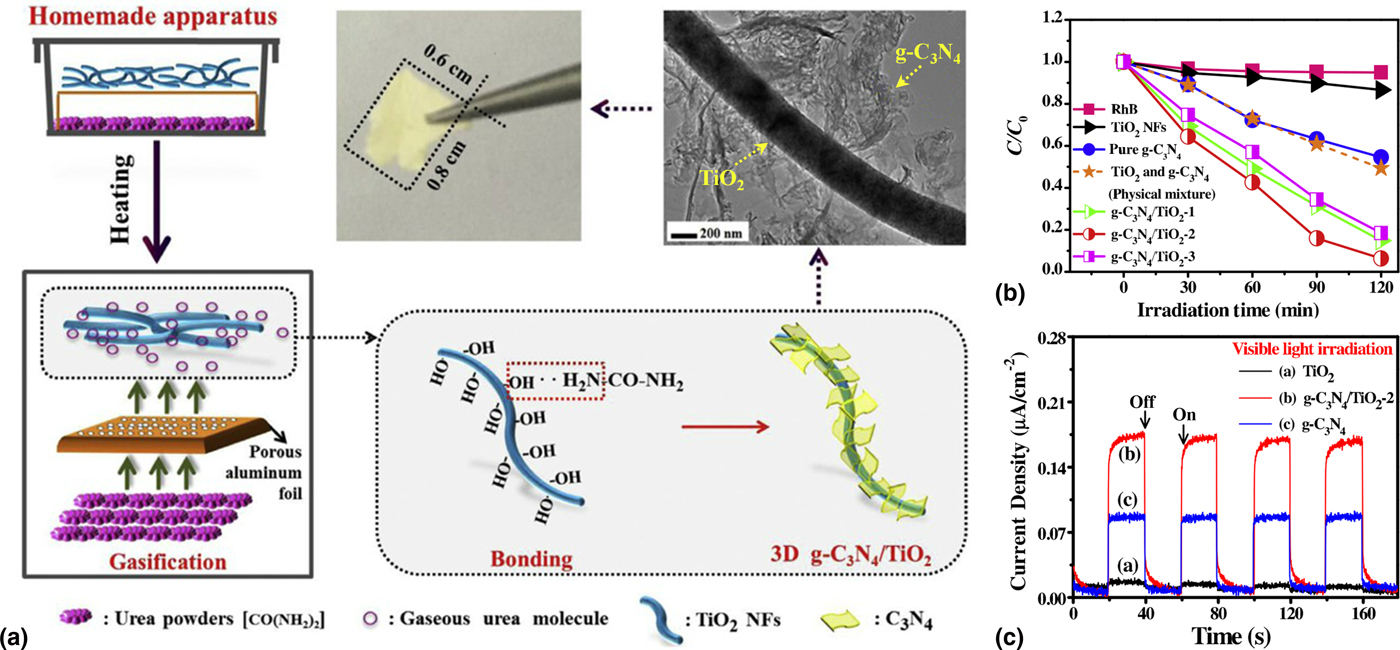
Recently, g-C3N4 was added into the precursor solution to prepare g-C3N4/TiO2 nanofibers via blending electrospinning technique combined with the calcination process.[Reference Han, Wang, Lei, Wang, Wu, Shi and Li57] It is worth noting that during the calcination process, nitrogen derived from the partial decomposition of g-C3N4 nanosheets was doped into TNFs. Taking advantage of the heterojunction between TiO2 and g-C3N4, as well as N-doping, g-C3N4/N-doped TiO2 nanofibers exhibited the highest first-order rate constant which was 7.3 times and 3.6 times higher than that of TNFs and g-C3N4 nanosheets, respectively, for the degradation of RhB under the simulated solar light. Additionally, in a research conducted by Adhikari et al., TNFs/g-C3N4 nanocomposite was fabricated in virtue of an angled two-nozzle electrospinning method.[Reference Adhikari, Awasthi, Kim, Park and Kim93] As a result, TNFs were dispersed on the surfaces of g-C3N4 nanosheets, which provided sufficient intimate contact between TiO2 and g-C3N4, thus promoting the charge separation more effectively and showing highly efficient for the degradation of RhB and reactive black (RB-5). More recently, Zhou et al. reported a gas-solid method to prepare hierarchical heterostructures of g-C3N4 nanosheets/TiO2 nanofibers (g-C3N4/TiO2 HHs).[Reference Zhou, Shao, Li, Wang, Guo and Liu95] Different from the conventional method that g-C3N4 grew on the surface of TNFs through calcining their physically mixed precursors, here, the precursor of g-C3N4 was gasified into molecules and g-C3N4 was in situ polymerized on the surface of TNFs [Fig. 10(a)]. The combination of gas–solid reaction and 3D porous network structure endowed the as-prepared materials with an excellent visible light photocatalytic performance for the degradation of RhB [Fig. 10(b)]. Moreover, the successful construction of heterojunction between g-C3N4 and TiO2 provided a better separation of electrons and holes, as evidenced by the enhanced photocurrent of g-C3N4/TiO2 HHs, which was twice of g-C3N4 electrode [Fig. 10(c)].
(a) Schematic illustration for the fabrication of 3D g-C3N4/TiO2 HHs. (b) Photocatalytic degradation of RhB over the as-fabricated materials under visible light irradiation. (c) Photocurrent spectra of TiO2 NFs, g-C3N4/TiO2 HHs and pure g-C3N4 electrodes. Reprinted with permission from Ref. Reference Zhou, Shao, Li, Wang, Guo and Liu95 (Elsevier, 2017).

Loading of cocatalyst
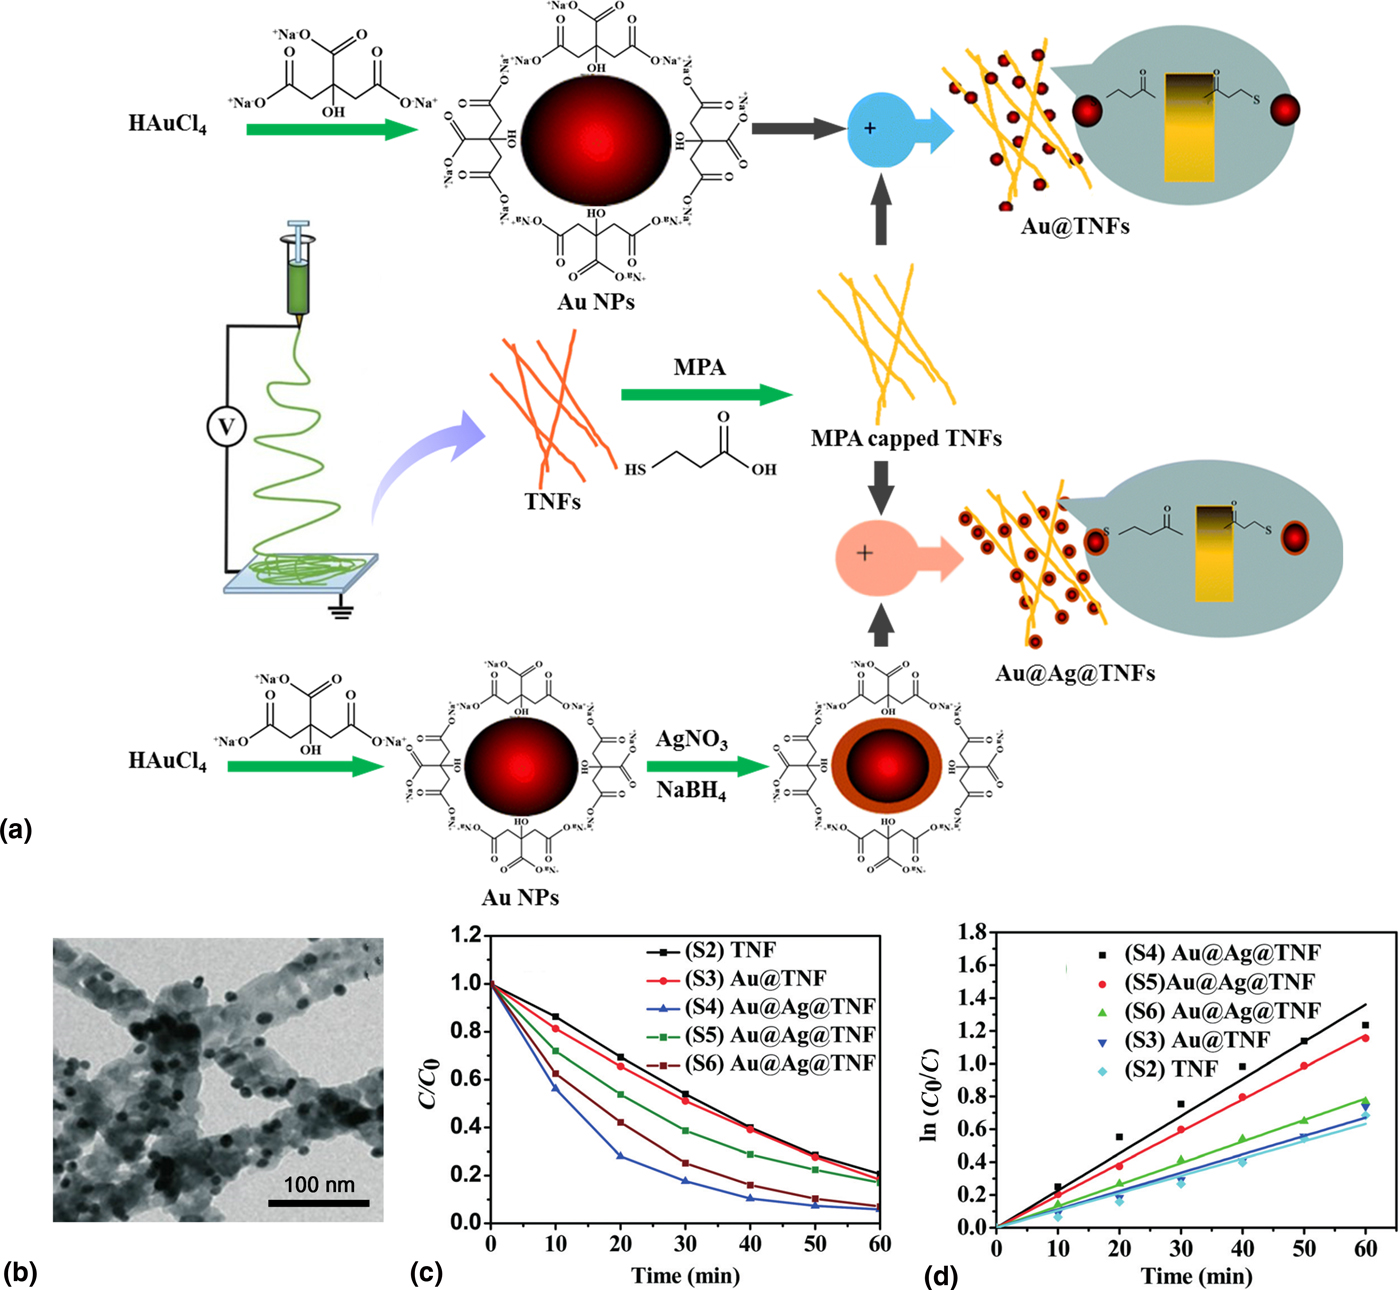
Based on the large work function, noble metals (e.g., Pt, Au, and Ag) usually have strong ability of trapping electrons, which could promote interfacial charge transfer and delay the recombination of the electron-hole pairs; on the other hand, under the action of the electromagnetic field of incident light, the conduction band electrons in the noble metal will oscillate collectively, which is called surface plasmon resonance, thus rendering the noble metals exhibiting the ability to absorb visible light.[Reference Reddy, Reddy, Kwon, Kim, Akter and Kalagara7] Therefore, loading noble metals on TNFs is an effective strategy to fabricate visible-light-active photocatalysts.[Reference Yang, Lu, Ye, Yu and Chang59] Recently, Misra et al. synthesized Au@Ag NPs with a core-shell configuration to modify the TNFs.[Reference Misra, Singh and Gupta33] In their study, Au@Ag bimetallic NPs were loaded on the surface of TNFs by using mercaptopropionic acid as a linker molecule, of which the COOH groups could interact with OH groups on TNFs and S-H groups could attach to the Ag NPs; as a contrast, Au@TNFs were also prepared, where S-H groups interacted with the Au NPs [Fig. 11(a)]. As illustrated in Fig. 11(b), Au@Ag NPs with uniform size were well dispersed on the surface of TNFs. When degrading MB under solar light, the resultant Au@Ag@TNFs and Au@TNFs both showed better photocatalytic performance than bare TNFs [Figs. 11(c) and 11(d)], which could be ascribed to the formation of the Schottky barrier at the interface of Au@Ag bimetallic NPs and TNFs. Moreover, it was demonstrated that the photocatalytic activity of Au@Ag@TNFs was much higher than that of Au@TNFs under visible light irradiation. Therefore, it is easy to understand the fact that loading bimetallic NPs on TNFs would not only further extend the range of visible-light harvest but also inhibit charge recombination more effectively. A similar study on Ag-Au NPs loaded TNFs using a combination of photodeposition and electrospinning technique was reported by Shahini et al. for the degradation of RhB under a low-power LED visible light.[Reference Shahini and Ashkarran60]
(a) Synthesis procedure of Au@TNFs and Au@Ag@TNFs. (b) TEM image of Au@Ag@TNFs. (c) Time-dependent photocatalytic degradation of MB by different samples under solar light irradiation. (d) Kinetics of MB degradation by different samples under solar light irradiation. Adapted with permission from Ref. Reference Misra, Singh and Gupta33 (The Royal Society of Chemistry, 2017).

Conclusions and outlook
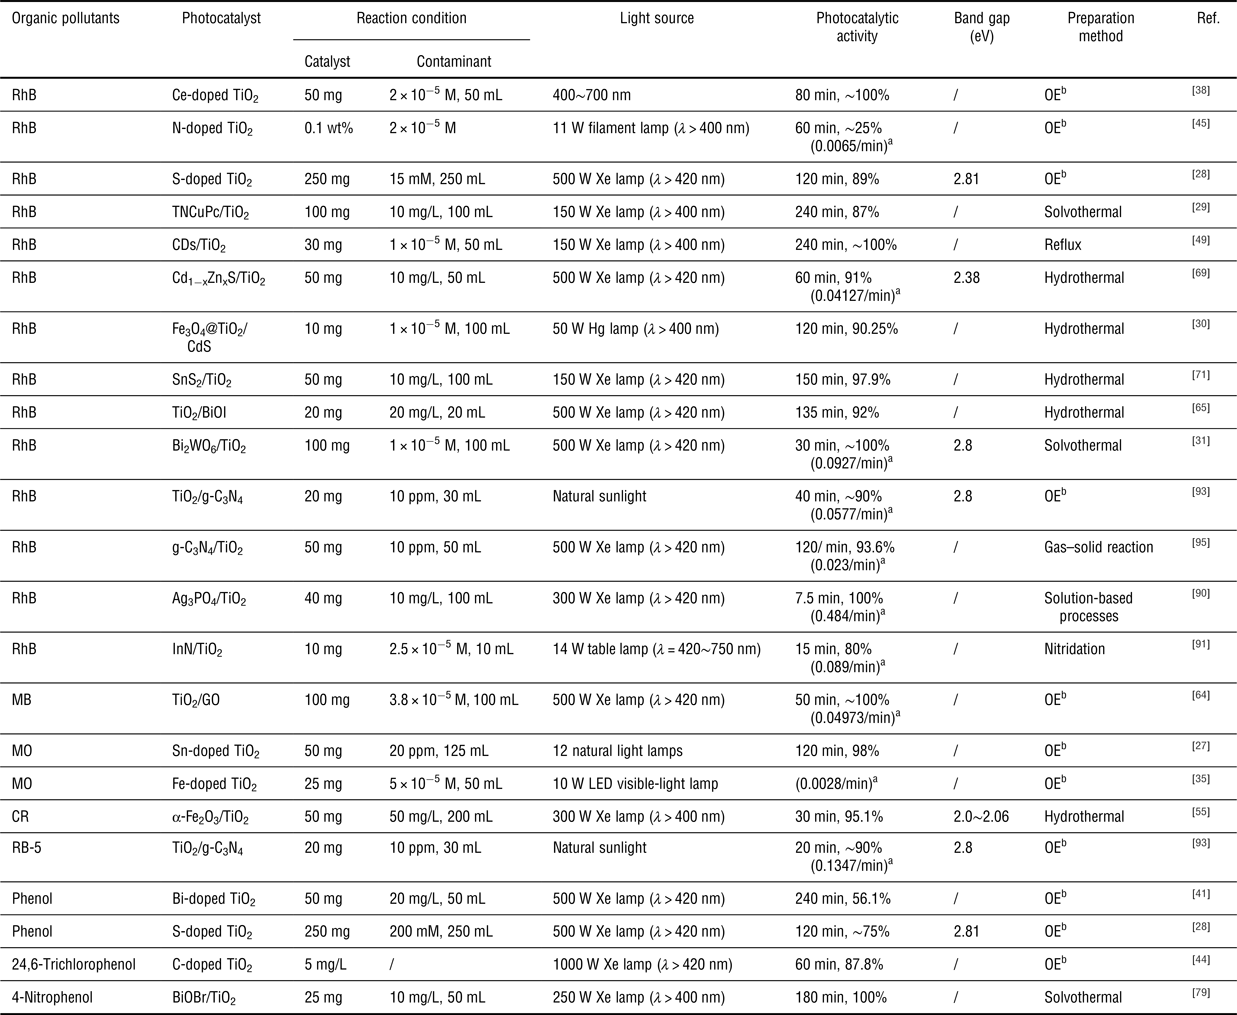
With the ability to prepare nanofibrous materials that have the large specific surface area, high aspect ratio, and easy combination with other techniques, electrospinning technique has been considered as a versatile and effective method for fabricating TiO2-based nanofibrous materials, including visible-light-active photocatalysts for organic pollutants degradation in water. The past years have witnessed the rapid expansion of research in this field, and various kinds of TiO2-based nanofibrous materials for the elimination of organic pollutants (e.g., dyes and phenols) have been developed, as summarized in Table I.
Summary of TiO2-based nanofibrous materials for organic pollutants degradation.

a First-order degradation rate constant.
b One-step electrospinning.
Though TiO2-based nanofibrous materials present great potential for the practical application in organic pollutants degradation due to their ease of recycling from wastewater in comparison with TiO2 nanoparticles, and many strategies have been used to enhance their visible light photocatalytic activity, there still exist many challenges. Initially, from the viewpoint of practical application, the tensile strength of the as-prepared material is an indispensable part that must be considered, however, rare research has involved this aspect. On the other hand, most of the designed materials suffer from poor flexibility, which poses an obstacle to recycle them easily. Therefore, it is of great significance to develop TiO2-based nanofibrous materials with robust mechanical strength. Furthermore, despite the fact that electrospun nanofibrous materials can be fabricated on a large scale,[Reference Song, Wang, Yan, Yu, Sun and Ding96–Reference Si, Mao, Zheng, Yu and Ding98] the TiO2-based nanofibrous materials reported in current research are still at laboratory study level which are limited by the functionalization methods (e.g., hydrothermal), thus large-scale and high-quality production of TiO2-based nanofiber photocatalysts are urgently desired. Additionally, current resultant materials generally exhibit highly effective photocatalytic activity for specific kind of organic pollutant (e.g., RhB), thus concentrated efforts need to be focused on exploiting more versatile photocatalysts for the treatment of wastewater. Although there are many challenges needed to be addressed in the future, electrospinning technique has great promise for designing and fabricating TiO2-based nanofibrous materials with integrated properties of high visible-light photocatalytic activity, robust tensile strength, and excellent flexibility. We expect an in-depth investigation of electrospun TiO2-based nanofibrous materials in the field of environmental management, which will drive their practical applications in essence.
Acknowledgments
This work is supported by the Innovation Program of Shanghai Municipal Education Commission (No. 2017-01-07-00-03-E00024), the Program of Shanghai Academic Research Leader (No. 18XD1400200), and the Fundamental Research Funds for the Central Universities (No. 18D310109).