


Western Mexico encompasses the modern-day regions of Michoacán, Colima, Jalisco, Nayarit, and Sinaloa, and occasionally extends to parts of Guanajuato, Aguascalientes, Zacatecas, Durango, and Guerrero. This expansive area boasts a highly varied and contrasting landscape. The distinct geographic features are matched by an abundant array of natural resources, which the pre-Hispanic inhabitants skillfully harnessed for sustenance and for crafting tools and adornments (Espejel Carbajal Reference Carbajal and Claudia2024).
The western region of Mexico is likely the sub-area of Mesoamerica with the least information about its pre-Hispanic cultural history. This shortage of archaeological data stems partially from the limited research conducted in the area. It was often thought that the western and northern zones of Mesoamerica lacked large urban centers, relegating them to secondary importance (Williams Reference Williams, Williams and Novella1994).
In the mid-1970s, scholars began introducing new perspectives, identifying two distinct cultural traditions: (1) a Mesoamerican tradition, noted for its “long history of continuity in art, religion, iconography, and worldview,” and (2) the typical tradition of western Mexico, characterized by the “shaft tomb” cultures (Meighan 1974, cited in Williams Reference Williams, Williams and Novella1994). Moreover, Meighan and Nicholson (1979, cited in Williams Reference Williams, Williams and Novella1994) suggested that western Mexico likely shared a similar pattern of village agriculture with Mesoamerica until the beginning of the Christian era (Williams Reference Williams, Williams and Novella1994).
One of the pioneers in presenting evidence of a more developed western Mexico was the archaeologist Phil Weigand, who observed that in the valley and mountain systems in a vast area of western Mexico there were many types of settlements, such as hamlets, mining complexes, emporiums, fortifications, villages, towns, etc. (Weigand Reference Weigand1992). These elements led him to propose the existence of a complex hierarchy of settlements before the arrival of Cortés, also proposing the name “Teuchitlán tradition” (Weigand Reference Weigand, Michael and Phil1985). Weigand (Reference Weigand, Michael and Phil1985) recognized the nuclear area of this tradition in the Teuchitlán municipality, north of Teuchitlán town (Figure 1), located west of Guadalajara city, in the state of Jalisco. The Teuchitlán tradition’s architectonic evidence begins its development as early as 1000 b.c. (Weigand Reference Weigand, Williams, Mestas and López2009). Its development is estimated to have taken place between 500 b.c. and a.d. 450 but its rise is generally dated to the Formative period’s end, ca. a.d. 200 (Smith Reference Smith2007). The tradition is rather abruptly extinguished at the end of the Classic period, ca. a.d. 500 (Weigand Reference Weigand, Williams and Weigand1996). The Teuchitlán tradition inhabits a nuclear area extending beyond the current Jalisco state (e.g., Cabrero and López Reference Cabrero García and López Cruz2009), occupying zones of the modern Mexican states of Nayarit, Zacatecas, Colima, Michoacán, with the main area being in Jalisco (Figure 1).
Distribution of shaft tombs in the states of Jalisco, Michoacán, Nayarit, and Colima. Dashed lines correspond to river courses. Open small circles are the most important sites with shaft tombs. Dark gray circled area corresponds to the Teuchitlán tradition main development. Light gray area denotes Teuchitlán tradition influence (after Weigand Reference Weigand, Peter and Ember2001).

The term “tradition” was proposed by Weigand (Reference Weigand, Michael and Phil1985, Reference Weigand, Weigand, Beekman and Esparza-Lópe2008), focusing on long-duration features that interconnect in time. Circular central plazas and conical step pyramids made with concentric circles that show a high proportionality and symmetry (Weigand Reference Weigand, Vernon and David1991) are the most distinctive hallmark characterizing the Teuchitlán tradition (Figure 2). The unusual conical structures, denominated as guachimontones (the same name as the nuclear plaza or archaeological site, at Teuchitlán town), are “unique in the Mesoamerican architectural repertoire and indeed are not found anywhere else in the world” (Weigand Reference Weigand, Peter and Ember2001, p. 402).
Archaeological site of Los Guachimontones, located to the north of Teuchitlán village, western Mexico. Photography looking southwards.

On the other hand, it seems that the Teuchitlán tradition was intertwined with what is known as the shaft-tomb tradition, a distinctive funerary practice that is notably prominent within the tradition (Weigand Reference Weigand, Vernon and David1991). Earlier shaft tombs are considered a precursor to the Teuchitlán tradition (Beekman Reference Beekman1994). The shaft-tomb tradition extended across Jalisco, Colima, and Nayarit from 500 b.c. to a.d. 600, covering the Late Preclassic and Early Classic periods (Galván-Villegas Reference Galván-Villegas1991; Schöndube Reference Schöndube and Muriá1980).
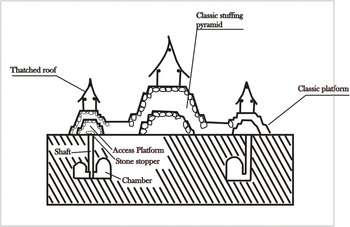
Five construction elements distinguish the Los Guachimontones archaeological site (Weigand Reference Weigand, Williams, Mestas and López2009). The first three constitute platforms, altars, and sidewalks of circular shape (Figure 2), crowned with square or rectangular pyramids or structures as the fourth construction element. On occasion, these edifices present funeral chambers of the shaft-tomb type below the patio or beneath the central altar (Esparza-López Reference Esparza-López2015), and these tombs constitute the fifth architectonic element (Figure 3).
Schematic view of a guachimonton. Beneath it some shaft tombs are depicted (after Weigand Reference Weigand1993).

Archaeological findings and reports from looters in the region indicate a very close link between the circular architecture of the Late Formative period and the shaft tombs (Beekman and Weigand Reference Beekman and Weigand2000; Weigand Reference Weigand and Macias1989). It is important to mention that this association is not absolute. Shaft tombs from earlier phases have different architectural association patterns. For instance, the shaft tombs of the San Felipe phase (Middle Formative) are often located beneath circular platforms that appear to be independent structures (Weigand Reference Weigand and Macias1989).
Shaft tombs are subterranean structures composed of a vertical or near-vertical shaft leading to one or more horizontal chambers (Figure 3). These tombs are typically excavated into volcanic tuff or soft, unconsolidated sediments. The horizontal chamber, which varies significantly in size, constitutes the actual burial space. The depth of the shaft, generally cylindrical or quadrangular in shape with a diameter ranging from 50 to 90 cm, depends on the underlying rock hardness and the social status of the deceased, and varies from 3.5 to 20 meters. Monumental tombs have been discovered with a vertical shaft that is between 12 and 20 meters deep and with three to five chambers (Weigand Reference Weigand, Williams, Mestas and López2009). There are a large number of sub-monumental tombs that do not have well-defined shafts and chambers; these have a depth of no more than two meters and often have a boot shape (Galván-Villegas Reference Galván-Villegas1991). This type of tomb has a wide distribution outside the nuclear area. Actually, the term “shaft-and-chamber tomb” could be used in place of “shaft tomb” (Mountjoy and Rhodes Reference Mountjoy and Rhodes2018).
The connection between vertical shaft and horizontal chambers was traditionally sealed by the constructors with flat rocks, leaving a chamber filled with air. This relatively empty cavity allows the use of practically any geophysical method to infer its depth and size.
The primary areas where these shaft tombs are found form a northwest–southeast corridor. The municipalities of Magdalena and Zapopan, in Jalisco state, contain maybe the largest number of these tombs (Figure 4). In Zapopan, shaft graves have been discovered in the Atemajac Valley, as well as in the Bugambilias and Tabachines localities (Galván-Villegas Reference Galván-Villegas1991) (Figure 4).
Relief map with some important localities with discovered shaft tombs in central Jalisco. Black circles indicate location of Santa Quiteria (SQ) and Los Guachimontones (Gu) archaeological sites. Black squares indicate actual populations. Other symbols are: M = Magdalena, TV = Tequila Volcano, Teu = Teuchitlán, Teq = Tequila, Am = Amatitán, EA = El Arenal, LP = La Primavera caldera, Bu = Bugambilias, Z = Zapopan, Tab = Tabachines, and AV = Atemajac Valley.

Beekman and Galván-Villegas (Reference Beekman and Galván-Villegas2006) attribute a recent resurgence of interest in the shaft tombs of western Mexico, in part, to the publication of salvage excavations conducted 30 years ago in the Atemajac Valley (Figure 4). These salvage excavations were carried out rapidly to prevent further disturbance of the exposed remains by looters. Despite the urgency, the amount of information recovered and the thoroughness of the analysis and publication surpassed that of any prior shaft-tomb research (Beekman and Galván-Villegas Reference Beekman and Galván-Villegas2006).
By means of the obsidian-hydration dating method, the tombs of the Atemajac Valley have been placed in a timeframe from approximately 750 b.c. to a.d. 450 (Galván-Villegas Reference Galván-Villegas1991), a period defined as the Tabachines phase, which corresponds approximately to the Preclassic and Early Classic (as a note: in the Preclassic, cultures such as the Olmec, the Zapotec, the Teotihuacan, and the Mayan developed and flourished). A slightly different range of dates, from 300 b.c. to a.d. 550, is based on radiocarbon dating and regional ceramic comparisons (Beekman and Galván-Villegas Reference Beekman and Galván-Villegas2006).
It is unknown what language people spoke during the life of the shaft-tomb tradition, though some scholars (e.g., Beekman and Galván-Villegas Reference Beekman and Galván-Villegas2006) propose a Nahuatl affiliation. This detail is significant because, in the pre-Columbian Nahuatl world, caves held diverse functions and meanings. They served as shelters, habitation sites, ritual spaces associated with lineage and passage, astronomical observatories, quarries, dwellings for the gods of water and death, and symbols of the earth’s mouth or womb, the underworld, and fantastical spaces (Manzanilla et al. Reference Manzanilla, Barba, Chávez, Tejero, Cifuentes and Peralta1994). These varied cave interpretations bear similarities to shaft-tomb symbolism.
As previously mentioned, social complexity in the region has garnered attention partly due to critiques that western Mexico was not considered part of Mesoamerica (Weigand Reference Weigand, Michael and Phil1985). The most well-known evidence of social complexity in western Mexico before the Tarascans is represented by the shaft tombs. Evidence recovered in the early 1990s suggested these tombs were associated with significant social inequalities (Galván-Villegas Reference Galván-Villegas1991). It is now clearer that the shaft tombs are closely linked to the surface architecture (Beekman Reference Beekman2010).
Although the shaft-tombs tradition seems to be older than the Teuchitlán tradition, there is a shift away from the smaller centers to larger sites such Los Guachimontones (Teuchitlán), or Santa Quiteria (El Arenal; ), in Jalisco state.
Given their importance in the Teuchitlán cultural tradition and the need to locate them accurately and protect them from looting, shaft tombs deserve to be investigated using geophysics, specifically through the method known as electrical resistivity tomography (ERT). In addition to this brief analysis of the state of knowledge of the Teuchitlán tradition, we present a study that demonstrates the effectiveness of a single ERT profile in identifying the electrical signatures of shaft tombs. We conducted ERT surveys on a circular structure known to contain previously discovered shaft tombs. This is Circle 6 at the Los Guachimontones archaeological site, which includes three shaft tombs within it (Cach Reference Cach2003; Weigand Reference Weigand, Williams, Mestas and López2009). Two of these tombs exhibit a bottle shape, while the third has a boot shape. Additional ERT surveys to infer the location of other shaft-and-chamber tombs were carried out at two distinct structures within the Santa Quiteria archaeological site, located in the municipality of El Arenal, Jalisco state (Figure 4 for location). This study showcases the ERT sections obtained and verifies the interpreted sources of anomalies by using synthetic models of shaft-tomb structures, thus affirming their shape and features.
Description of study areas
The studied areas correspond to two pre-Columbian sites located in different geographical zones. The first one, already mentioned as Los Guachimontones, is located just north of the modern-day Teuchitlán town (Figure 4), in a basaltic environment. The second one is the so-called Santa Quiteria area, which is located northeast of El Arenal town (Figure 4), in volcanic rhyolitic breccia outcrops. Both sites are located west of Guadalajara city, in western Mexico.
Los Guachimontones archaeological site is the largest and most complex site within the Teuchitlán tradition (Beekman Reference Beekman1994). Indeed it forms part of an important archaeological zone that is open to the public. The ancient village center was occupied by several circular areas (Weigand Reference Weigand, Weigand, Beekman and Esparza-Lópe2008) (Figure 5), each with a multi-level circular step pyramid at its center. There are a total of 10 such circles within Los Guachimontones, including four rectangular plazas and two ball courts, among many other smaller structures (Weigand Reference Weigand, Weigand, Beekman and Esparza-Lópe2008).
Los Guachimontones, Teuchitlán, western México: (a) schematic map (after Weigand Reference Weigand1993); and (b) aerial image looking northwards (Source: Google Earth. Image © 2023 Airbus).

The pyramidal structures are constructed primarily with locally sourced andesitic and rhyolitic rocks. Despite the presence of a shallow volcanic basement underlying the entire area, some shaft tombs have been excavated, reaching depths of approximately three to seven meters (e.g., Cach Reference Cach2003). The structure referred to as the Central Altar of Circle 6 (Cach Reference Cach2003) is particularly intriguing because it houses three shaft tombs. Based on the ceramic objects found within, which are thought to date back to the Early Preclassic period (Cach Reference Cach2003), it is considered that this structure might be an early form of a guachimonton, that is to say, a proto-guachimonton.
The second study site, in the Santa Quiteria archaeological zone, features two distinct points with clear guachimonton vestiges at different elevations (Figure 6a–b). The higher site, termed as Santa Quiteria 1 (SQ1 from now on; see Figures 6b and 7a), situated at 1,510 m above sea level, comprises three main visible circular structures surrounded by rectangular pyramids and a prominent north-oriented ball court.
Santa Quiteria (SQ), El Arenal, México: (a) plan (after Weigand Reference Weigand1993); and (b) aerial view of the site, with the areas of sites SQ1 and SQ2 outlined (Google Earth. Image © 2023 Airbus).

Close-ups of the Santa Quiteria (SQ) sites: (a) SQ1 (Google Earth. Image © 2023 Airbus); and (b) SQ2, with white rectangles and circle indicating a guachimonton (Google Earth. Image ©2025 Airbus ). Coordinates in both figures are in kilometers; ERT (electrical resistivity tomography) profiles are indicated with dashed lines.

The lower site, termed by us as Santa Quiteria 2 (SQ2 from now on; see Figures 6b and 7b), is situated at 1,387 m above sea level, and exhibits thicker soil layers overlying a potential rhyolitic basement. These conditions may have facilitated deeper tomb construction. In SQ2 two ceremonial guachimonton complexes are evident, one of which has been significantly damaged by agricultural machinery (Gustavo Gómez-Gómez, personal communication 2018). Both sites in Santa Quiteria have apparently not been excavated or subjected to any other intervention by any archaeological project.
Methods
Most geophysical surveys applied in archaeology must be coherent in terms of costs, time, and concrete results. For instance, in situations such as the imminent construction of large civil facilities in areas where the presence of significant historical remains has been newly discovered, or when archaeologists need to reduce costs and time in the excavation, salvage, and location of structures, the application of a particular geophysical method with minimal measurements should be sufficient and efficient.
Since the mid-twentieth century, various geophysical methods have been employed to study archaeological sites and address problems in archaeological contexts in many places in the world (e.g., Wynn Reference Wynn1986). It is believed that the initial successful use of resistivity meters and magnetometers for geophysical studies in archaeological sites took place in the United Kingdom, shortly after World War II (Tonkov Reference Tonkov2013). From the 1940s to the end of the 1960s, the field of archaeological geophysics, an emerging subfield of applied geophysics (Tonkov Reference Tonkov2013), experienced a period of stagnation due to limited technological progress. However, the 1980s brought a significant revival, thanks to the advent of microprocessors, which increased computational capabilities, and the development of more sophisticated interpretation algorithms (Tonkov Reference Tonkov2013; Wynn Reference Wynn1986). Recent research on applied geophysics in archaeological settings encompasses works by Stampolidis and Tsokas (Reference Stampolidis and Tsokas2012), Himi et al. (Reference Himi, Armendariz, Teira, González, José Ibáñez, Haïdar-Boustani and Casas2016), Pazzi et al. (Reference Pazzi, Tapete, Cappuccini and Fanti2016), Welc et al. (Reference Fabian, Mieszkowski, Goranka Lipovac Vrkljan and Ana Konestra2017), and Scudero et al. (Reference Scudero, Martorana, Capizzi, Pisciotta, D’Alessandro, Bottari and Di Stefano2018), focusing on Roman or Greek settlements. Additionally, publications like the one edited by Bonsall (Reference Bonsall2019) are noteworthy, though they lack studies conducted in Latin America. In Mexico, the earliest known, but unpublished, geophysical work was conducted by Hans Lundberg, who carried out an electric equipotential survey at an archaeological site to aid in the search for the ancient remains of the Tepexpan Man (de Terra Reference de Terra1947; de Terra et al. Reference de Terra, Javier Romero and Thomas Dale Stewart1949).
It is noteworthy that there is a geophysics laboratory, belonging to Universidad Nacional Autónoma de México, that specializes in combining geophysics with soil studies (Blancas et al. Reference Blancas, Barba, Ortiz, Cuenca-Garcia, Asandulesei and Lowe2024). However, its projects have been confined to specific areas within the state of Mexico. According to the manuscript outlining the research conducted in this laboratory, magnetometry is the most widely used technique, followed by ground-penetrating radar (GPR) and, lastly, electrical studies (Blancas et al. Reference Blancas, Barba, Ortiz, Cuenca-Garcia, Asandulesei and Lowe2024).
However, other researchers have given significant attention to the Teotihuacan archaeological zone since the 1990s, particularly in identifying tunnel locations and their extensions using a range of geophysical techniques such as magnetic gradients, GPR, and ERT (Arzate et al. Reference Arzate, Flores, Chávez, Barba, Manzanilla and Stanley1990; Chávez et al. Reference Chávez, Manzanilla, Peralta, Tejero, Cifuentes and Barba1994; Chávez et al. Reference Chávez, Manuel, Tejero, Barba and Manzanilla2001; Manzanilla et al. Reference Manzanilla, Barba, Chávez, Tejero, Cifuentes and Peralta1994). Initial results from magnetic surveys have been strongly corroborated, first by GPR and subsequently by ERT. Noteworthy findings have also been reported at the El Castillo pyramid in Chichén Itzá, southeastern Mexico, where a karstic system beneath the structure was inferred using ERT (Chávez et al. Reference Chávez, Tejero Andrade, Cifuentes, Argote Espino and Hernández Quintero2018). Most recently, various geophysical studies have been applied to other archaeological sites in Mexico. For example, López García et al. (Reference García, Antonio, Denisse Lorenia Argote Espino, Andrés Tejero Andrade and Oscar Guillermo Huacuja Montiel2019) employ two- and three-dimensional (2D and 3D) ERT to identify excavation-prone structures on terraces in the state of Tlaxcala. Similarly, Argote et al. (Reference Argote, Cifuentes-Nava, Andrés Tejero-Andrade, Martín Cárdenas-Soto, Leobardo Pacheco-Arias, Marco Vigato and Ludovic Celle2024) utilize GPR, ERT, and ambient noise tomography (ANT) to detect structures indicative of earlier site occupations in Mitla, Oaxaca state. Our research team has recently initiated geophysical investigations in the historically significant Mesoamerican western region.
To be specific about the ERT geophysical method employed in this study, its evolution is attributed to significant technological advancements in field data acquisition. Initially known as the multielectrode arrangement (Griffiths and Turnbull Reference Griffiths and Turnbull1985), this technique is widely recognized as electrical resistivity tomography (Shima and Sakayama Reference Shima and Sakayama1987) or electrical resistivity imaging (Griffiths and Barker Reference Griffiths Donald and Barker1993), commonly abbreviated as ERT or ERI, respectively. ERT is consistently used to address shallow subsurface issues and is particularly effective in detecting cavities, walls, and other artificial structures at varying depths (Park et al. Reference Park, Park, Myeong Jong, Kim, Son, Kim, Adekunle and Abraham2014; Tsourlos and Tsokas Reference Tsourlos and Tsokas2011, among many others).
The ERT study was carried out with a SARIS multielectrode system, from Scintrex. SARIS is a computer-controlled system with 25 or more electrodes or probes laid out in a profile at constant intervals (e.g., Chávez et al. Reference Chávez, Manuel, Tejero, Barba and Manzanilla2001). The data obtained are displayed in a pictorial representation of the variation of resistivity in the subsurface, known as electrical imaging. Exact depths ascribed to the resistivity values (Edwards Reference Edwards1977) depend upon the subsurface resistivity distribution, and on the electrode geometry.
Electrical imaging is commonly divided into two steps: (1) the data collection process and (2) the inversion approach to estimate the true subsurface resistivity. The inversion approach can be done in several steps: (1) compute the apparent resistivity, employing a finite-difference or finite-element method; (2) select the nonlinear optimization technique; (3) evaluate the elements of the Jacobian matrix; and (4) solve a set of equations. Independently, the data can be interpreted using forward modeling, which implies synthetic models of the earth.
All field data in this study were collected using a Wenner-alpha electrodic array with 0.5–1 m electrode spacing and up to eight levels of variation in the electrode separation, which corresponds to a maximum penetration depth of approximately five meters (Edwards Reference Edwards1977). In a first step, we traced an almost north–south line over the circular structure denominated Circle 6, or more properly referred to as the Central Altar of Circle 6 (Cach Reference Cach2003), within the Los Guachimontones site (Figure 8). Archaeological works found three shaft tombs beneath this circular structure (Cach Reference Cach2003). Two are shaped like a boot and the third is shaped like a bottle. The survey line covers two of these structures, one of each shape. Both lateral and horizontal resistivity inhomogeneities were expected. A Wenner-alpha electrode arrangement with minimum spacing of 0.50 m between electrodes was selected for its significantly strong signal and for its sensitivity, to resolve vertical resistivity changes (Griffiths and Barker Reference Griffiths Donald and Barker1993).
Circle 6 at Los Guachimontones (as indicated in Figures 5a and 5b): (a) photo looking northwards, with the electrical resistivity tomography (ERT) profile marked with a rope; and (b) scheme of Circle 6 where the shaft tombs and the ERT survey line (a dashed line) are indicated (adapted from Cach Reference Cach2003).

At the other site, despite the presence of agave plants at site SQ1 (Figure 9), we established a north–south ERT profile spanning 38 m in an almost-even place, intersecting two rectangular structures west of the central circular building (see Figure 7a). Furthermore, the SQ2 site is completely even, and considering the visible vestiges of a destroyed guachimonton, it was possible to trace another ERT profile (see Figure 7b).
Agave plants seeded on the Santa Quiteria SQ1 area. The photo looks east, approximately.

Synthetic modeling
A shaft tomb can be represented by a relatively simple geometric model. To enhance the understanding of these archaeological structures in real contexts and to refine data interpretation parameters, several forward-modeling simulations using simplified shaft-tomb models were conducted prior to inverting field ERT data. Factors considered in these models included tomb depth, dimensions, location, shape, and the resistivity contrasts of surrounding geological materials. In the specific case of Los Guachimontones, the andesitic blocks forming the perimeter of the circular structure (Circle 6; see Figure 5) that houses the tombs were incorporated. The simulated tomb shapes replicated the common boot and bottle configurations observed in western Mexico (see, for example, ) and explored in the interior of Circle 6 (Figure 8b).
To model the subsurface with its complex resistivity distribution, we employed the RES2DMOD software (Loke Reference Loke1994). Based on the finite-difference method (Dey and Morrison Reference Dey and Morrison1979), this program enabled us to consider resistivity variations at every point within the subsurface.
Process of inversion of ERT data
The inversion mathematical method developed by Loke and Barker (Reference Loke and Barker1995) was employed to determine the resistivity distribution at depth. This inversion routine is based on the smoothness-constrained least-squares method (SC-LS) (deGroot-Hedlin and ConsReference deGroot-Hedlin and Constabletable 1990; Sasaki Reference Sasaki1992). Conventional inversion methods typically discretize the subsurface into rectangular blocks and optimize an initial model using nonlinear techniques. The least-squares approach, commonly applied (Smith and Vozoff Reference Smith and Vozoff1984; Tripp et al. Reference Tripp, Hohmann and Swift1984), is inherently unstable. However, incorporating a damping factor and smoothing filter, as proposed by deGroot-Hedlin and Constable (Reference deGroot-Hedlin and Constable1990) and Sasaki (Reference Sasaki1992), enhances numerical stability and accelerates convergence.
The inversion process utilizes a finite-difference technique adapted from Dey and Morrison (Reference Dey and Morrison1979) and refined by Loke (Reference Loke1994). This method computes potentials at nodes within a rectangular grid of L × M dimensions, considering varying resistivity values for each block. Subsequently, a pseudosection of apparent resistivities is generated, serving as input for the inversion algorithm to produce a final image of true resistivities (Loke Reference Loke1994). The flexibility of employing a fine mesh enables high-quality modeling of complex geological structures.
The RES2DINV program was employed for the inversion process, utilizing measured apparent resistivity data presented as a pseudoprofile. The program iteratively refines a hypothetical model of true subsurface resistivities. The program simulates the expected apparent resistivities based on the current model (the “forward problem”). By comparing these simulated values with the observed data, an error is calculated and used to update the model. This iterative process continues until the calculated and measured apparent resistivities converge, yielding a final model of subsurface resistivity distribution.
Results and discussion
Synthetic modeling
Resistivity values for the forward models were assigned as follows: 200 Ωm for the host material (composed of soil, clay, and ash tuffs; Cach Reference Cach2003), 800 Ωm for the loose volcanic rocks that function as seals for the vertical shafts (depicted in light blue on Figure 10), and 2 × 10⁶ Ωm for the empty chamber space (Figure 10). The volcanic basement is not included. These resistivity values were adopted from the literature (e.g., Telford et al. Reference Telford, Geldart and Sheriff1990). To introduce variability, diversified orientations were used for the chamber in the boot-shaped tomb and the depths of both tombs. The synthetic models reveal two distinct main high-resistivity anomalies corresponding to the tombs, and two smaller anomalies associated with the andesitic foundations of the circular structure. In all cases, the resistivity anomalies are the signature of the upper part of the models. A shallower tomb depth and a chamber with higher ceiling resulted in larger resistivity anomalies, while the bottle-shaped tomb exhibited a smaller anomaly that tended to merge with the major high-resistivity anomaly associated with the upper part. In addition, the bottle-shaped tomb displays an elongated-and-inclined resistivity signature when its depth and width are increased (Figure 10a–e). The andesite foundations also show a high-value anomaly, which is more clearly observed at the far left of the graphs.
From (a) to (e), synthetic models obtained assuming two shaft tombs with different form and depths: (a) Chamber two meters high, facing north and a bottle.shaped tomb one meter wide; (b) chamber 1.5 meters high, three meters long, facing north and bottle-shaped tomb two meters wide; (c) chamber 1.5 meters high, three meters long, facing south and bottle-shaped tomb two meters wide.… (d) chamber that reaches two meters deep, with one meter high, three meters long, facing south and bottle-shaped tomb two meters wide; (e) shaft tomb with chamber reaching four meters deep, with 3.5 meters high, three meters long, facing south and bottle-shaped tomb two meters wide.

Modeling synthetic tombs with physical properties and dimensions similar to the discovered tombs supports the inversion.
Inverted 2D electrical images of the shaft tombs
Based on synthetic models (Figure 10) and excavation data from Circle 6, at Los Guachimontones, computed apparent resistivities were obtained. The iteration process in the inversion was stopped when the fitting error between the observed and the calculated anomalies presented no further changes. For example, in the inversion shown in Figure 12 the error reached was 3.7 percent after 10 iterations. A notably high resolution is observable in the model (lower panel in Figure 12). A prominent high-resistivity zone is evident in the center of the observed data profile (Figure 12, upper panel). The observed data (Figure 12, upper panel) comprise three anomalies, two of which correspond to the shaft tombs located at an approximate depth of three meters. This depth is consistent with the depth determined through archaeological investigations (Cach Reference Cach2003). Low resistivity readings at distances of 7 and 22 m along the profile suggest potential water infiltration along the andesitic foundations of the circular structure.
A great similarity between the synthetic model in Figure 11e and the observed real data in the upper panel of Figure 12 is observable.
The results of the forward modeling obtained with models similar to the discovered tombs at Circle 6 in Los Guachimontones and the inversion of the real data, provide a control for the inference of non-discovered tombs in Santa Quiteria, in El Arenal, Jalisco, where we surveyed two separate ERT lines, in the sites already denominated as SQ1 and SQ2.
Resistivity at Circle 6, Los Guachimontones: (upper panel) observed resistivity data, with an approximate location of the shaft tombs indicated; and (lower panel) inversion electrical resistivity tomography model.

Resistivity along the profile taken at Santa Quiteria SQ1: (upper panel) observed resistivity data, with arrows indicating the two closed features; and (lower panel) inversion electrical resistivity tomography model.

The initial resistivity tomogram conducted at SQ1 targeted two rectangular mounds flanking one of the site’s monumental circular pyramids, in a 38 m profile with 1 m electrode spacing. The resulting pseudosection reveals resistivity values spanning from approximately 30 Ωm at depth to 500 Ωm near the surface (Figure 13), with a maximum investigation depth of 5.6 m.
Resistivity along the profile taken at Santa Quiteria SQ2: (upper panel) observed resistivity data; and (lower panel) inversion electrical resistivity tomography model.

The apparent resistivity anomalies indicate a relatively irregular stratigraphy, showing two closed features at distances of 14 and 18 m along the profile, indicated with arrows in Figure 13, but the inversion does not resolve them. These anomalous features seem to be located at an approximate depth of two meters (Figure 13, upper panel). As in the inversion of Circle 6, we conducted 10 iterations, arriving at an error of 3.8 percent. The inversion model does not show the presence of any structures as cavities that indicate a shaft tomb in this area, as in the case of Los Guachimontones. However, the two aforementioned closed strong anomalies seem to show, in the inversion model, two structures that reach more than 2 m in depth (Figure 13; lower panel). In addition, there are several high-resistivity features on the surface, which seem to correspond to the rectangular structures that accompany the guachimonton.
The pseudosection of apparent resistivities obtained at the site called SQ2 was 64 m long (Figure 13) and, as can be observed in Figure 7b, was located on an even surface. A 1 m measurement step was also used. The line had an approximate west–east orientation, and ran over what might have been a circular pyramid and one of its rectangular companions.
The apparent resistivity values obtained range from 30 to 500 Ωm, with a maximum investigation depth of 5.6 m.
The measured pseudosection did not exhibit typical stratigraphic patterns of undisturbed subsoil, as expected in the absence of shaft graves. Instead, it revealed a wide anomaly at depth, likely associated with the overlying debris from collapsed structures (Figure 13, upper panel). On the other hand, the inverted model shows a high-resistivity pattern (greater than 300 Ωm), which seems to pertain to the guachimonton basement, apparently buried below two meters in depth. The inversion process converged after 10 iterations with a 2.1 percent error, indicating high-quality resistivity data.
The inverted model (Figure 13, lower panel) suggests the presence of low-resistivity features (40 Ωm approximately), potentially representing cavities filled with clay and terrigenous sediments. The roughly 3.5 m depth of these anomalies supports their interpretation as cavities filled with terrigenous material, while their resistivity values indicate the presence of the aforementioned materials, possibly with moisture content. These features may correspond to tombs concealed during soil reworking with heavy machinery or to ancient, looted tombs.
Conclusions
Over the last 50 years, through the diligent work of archaeologists like Phil Weigand, it has become clear that pre-Hispanic western Mexico harbors a unique culture not previously recognized in the Mesoamerican context, namely, the Teuchitlán tradition. As detailed in this and other works, this tradition is distinguished by several notable characteristics. Two key features include the impressive monumental structures called guachimontones, which have a concentric circular cone shape, and the diverse types of shaft-and-chamber tombs that are associated with these guachimontones. Notably, these particular structures seem to have developed independently of the concentric-cone platform-pyramid tradition.
In relation to the geophysical study carried out to investigate the notable shaft tombs, we have found that the ERT at Los Guachimontones yielded promising results, delineating the geophysical signatures of two distinct shaft-tomb morphologies. A comparison between a synthetic model of two shaft tombs similar in shape, position, and depth to those found in Circle 6 of the archaeological site of Los Guachimontones, along with their electrical properties obtained from specialized literature, demonstrates the reliability of the method for these cases. Synthetic modeling revealed that burial-chamber orientation minimally impacts resistivity anomalies, indicating the limitations of this method in determining chamber positions or directions. As a particular case, and notably, bottle-shaped tombs exhibited resistivity values 10 times higher than boot-shaped counterparts. Based on both theoretical modeling and field data from Circle 6, ERT effectively characterizes shaft tombs shallower than five meters. Optimal survey parameters suggested include profiles exceeding 27 meters with electrode spacings of 1–2 m.
In addition, concurrent resistive tomography investigations have been carried out in the Santa Quiteria area, El Arenal municipality, with the purpose of inferring the location of preserved shaft tombs beneath characteristic rectangular or circular pyramidal bodies of the so-called guachimontones. The site comprises multiple ceremonial complexes at varying elevations and topography, necessitating two survey lines. The first one, SQ1, constrained by terrain and vegetation, covered 38 m. Inversion modeling for SQ1 did not identify a shaft tomb, but indicated substantial subsurface disturbance, likely associated with platform construction. The second line, SQ2, measuring 64 m at 1,375 m above sea level, reveals minimal evidence of a looted or destroyed shaft tomb, but the materials of the foundations of the guachimontones give very clear resistive anomalies.
This study aimed to contribute to the now understood significance of the shaft tombs as an important element of the Teuchitlán culture through the use of ERT at two prominent sites of that culture: the nuclear plaza of Los Guachimontones in Teuchitlán and the Santa Quiteria site in El Arenal municipalities.
Acknowledgements
We express our sincere gratitude to the Los Guachimontones project from the El Colegio de Michoacán and the Instituto Nacional de Antropología e Historia Jalisco Section for providing the necessary facilities for this research. We are also deeply indebted to Gustavo Gómez-Gómez, Paul Calderón, Saira Patricia Romero-Velasco, and Ilya Morales-Gaistardo for their invaluable support and contributions during the field survey. We are also grateful for the perspectives and suggestions of three reviewers, as they greatly contributed to improving this manuscript.