



%20--%3e%3c!DOCTYPE%20svg%20PUBLIC%20'-//W3C//DTD%20SVG%201.0//EN'%20'http://www.w3.org/TR/2001/REC-SVG-20010904/DTD/svg10.dtd'%3e%3csvg%20version='1.0'%20id='Layer_1'%20xmlns='http://www.w3.org/2000/svg'%20xmlns:xlink='http://www.w3.org/1999/xlink'%20x='0px'%20y='0px'%20width='64px'%20height='64px'%20viewBox='5.5%20-3.5%2064%2064'%20enable-background='new%205.5%20-3.5%2064%2064'%20xml:space='preserve'%3e%3cg%3e%3ccircle%20fill='%23FFFFFF'%20fill-opacity='0'%20cx='37.785'%20cy='28.501'%20r='28.836'/%3e%3cpath%20fill='%23595959'%20d='M37.441-3.5c8.951,0,16.572,3.125,22.857,9.372c3.008,3.009,5.295,6.448,6.857,10.314%20c1.561,3.867,2.344,7.971,2.344,12.314c0,4.381-0.773,8.486-2.314,12.313c-1.543,3.828-3.82,7.21-6.828,10.143%20c-3.123,3.085-6.666,5.448-10.629,7.086c-3.961,1.638-8.057,2.457-12.285,2.457s-8.276-0.808-12.143-2.429%20c-3.866-1.618-7.333-3.961-10.4-7.027c-3.067-3.066-5.4-6.524-7-10.372S5.5,32.767,5.5,28.5c0-4.229,0.809-8.295,2.428-12.2%20c1.619-3.905,3.972-7.4,7.057-10.486C21.08-0.394,28.565-3.5,37.441-3.5z%20M37.557,2.272c-7.314,0-13.467,2.553-18.458,7.657%20c-2.515,2.553-4.448,5.419-5.8,8.6c-1.354,3.181-2.029,6.505-2.029,9.972c0,3.429,0.675,6.734,2.029,9.913%20c1.353,3.183,3.285,6.021,5.8,8.516c2.514,2.496,5.351,4.399,8.515,5.715c3.161,1.314,6.476,1.971,9.943,1.971%20c3.428,0,6.75-0.665,9.973-1.999c3.219-1.335,6.121-3.257,8.713-5.771c4.99-4.876,7.484-10.99,7.484-18.344%20c0-3.543-0.648-6.895-1.943-10.057c-1.293-3.162-3.18-5.98-5.654-8.458C50.984,4.844,44.795,2.272,37.557,2.272z%20M37.156,23.187%20l-4.287,2.229c-0.458-0.951-1.019-1.619-1.685-2c-0.667-0.38-1.286-0.571-1.858-0.571c-2.856,0-4.286,1.885-4.286,5.657%20c0,1.714,0.362,3.084,1.085,4.113c0.724,1.029,1.791,1.544,3.201,1.544c1.867,0,3.181-0.915,3.944-2.743l3.942,2%20c-0.838,1.563-2,2.791-3.486,3.686c-1.484,0.896-3.123,1.343-4.914,1.343c-2.857,0-5.163-0.875-6.915-2.629%20c-1.752-1.752-2.628-4.19-2.628-7.313c0-3.048,0.886-5.466,2.657-7.257c1.771-1.79,4.009-2.686,6.715-2.686%20C32.604,18.558,35.441,20.101,37.156,23.187z%20M55.613,23.187l-4.229,2.229c-0.457-0.951-1.02-1.619-1.686-2%20c-0.668-0.38-1.307-0.571-1.914-0.571c-2.857,0-4.287,1.885-4.287,5.657c0,1.714,0.363,3.084,1.086,4.113%20c0.723,1.029,1.789,1.544,3.201,1.544c1.865,0,3.18-0.915,3.941-2.743l4,2c-0.875,1.563-2.057,2.791-3.541,3.686%20c-1.486,0.896-3.105,1.343-4.857,1.343c-2.896,0-5.209-0.875-6.941-2.629c-1.736-1.752-2.602-4.19-2.602-7.313%20c0-3.048,0.885-5.466,2.658-7.257c1.77-1.79,4.008-2.686,6.713-2.686C51.117,18.558,53.938,20.101,55.613,23.187z'/%3e%3c/g%3e%3c/svg%3e)
%20--%3e%3c!DOCTYPE%20svg%20PUBLIC%20'-//W3C//DTD%20SVG%201.0//EN'%20'http://www.w3.org/TR/2001/REC-SVG-20010904/DTD/svg10.dtd'%3e%3csvg%20version='1.0'%20id='Layer_1'%20xmlns='http://www.w3.org/2000/svg'%20xmlns:xlink='http://www.w3.org/1999/xlink'%20x='0px'%20y='0px'%20width='64px'%20height='64px'%20viewBox='5.5%20-3.5%2064%2064'%20enable-background='new%205.5%20-3.5%2064%2064'%20xml:space='preserve'%3e%3cg%3e%3ccircle%20fill='%23FFFFFF'%20fill-opacity='0'%20cx='37.637'%20cy='28.806'%20r='28.276'/%3e%3cg%3e%3cpath%20fill='%23595959'%20d='M37.443-3.5c8.988,0,16.57,3.085,22.742,9.257C66.393,11.967,69.5,19.548,69.5,28.5c0,8.991-3.049,16.476-9.145,22.456%20C53.879,57.319,46.242,60.5,37.443,60.5c-8.649,0-16.153-3.144-22.514-9.43C8.644,44.784,5.5,37.262,5.5,28.5%20c0-8.761,3.144-16.342,9.429-22.742C21.101-0.415,28.604-3.5,37.443-3.5z%20M37.557,2.272c-7.276,0-13.428,2.553-18.457,7.657%20c-5.22,5.334-7.829,11.525-7.829,18.572c0,7.086,2.59,13.22,7.77,18.398c5.181,5.182,11.352,7.771,18.514,7.771%20c7.123,0,13.334-2.607,18.629-7.828c5.029-4.838,7.543-10.952,7.543-18.343c0-7.276-2.553-13.465-7.656-18.571%20C50.967,4.824,44.795,2.272,37.557,2.272z%20M46.129,20.557v13.085h-3.656v15.542h-9.944V33.643h-3.656V20.557%20c0-0.572,0.2-1.057,0.599-1.457c0.401-0.399,0.887-0.6,1.457-0.6h13.144c0.533,0,1.01,0.2,1.428,0.6%20C45.918,19.5,46.129,19.986,46.129,20.557z%20M33.042,12.329c0-3.008,1.485-4.514,4.458-4.514s4.457,1.504,4.457,4.514%20c0,2.971-1.486,4.457-4.457,4.457S33.042,15.3,33.042,12.329z'/%3e%3c/g%3e%3c/g%3e%3c/svg%3e)
1. Introduction
Dense suspensions of solid particles in a Newtonian fluid are found throughout nature, in everything from geophysical phenomena such as landslides and magma flow to processes like the transport of sediment in rivers (Denn, Morris & Bonn Reference Denn, Morris and Bonn2018; Guazzelli & Pouliquen Reference Guazzelli and Pouliquen2018; Hsiao & Pradeep Reference Hsiao and Pradeep2019; More & Ardekani Reference More and Ardekani2020c; Ness, Seto & Mari Reference Ness, Seto and Mari2022). Meanwhile, they are present in many industries such as the manufacture of pastes and ceramics; the production of vaccines and drug formulations; and the preparation of metal pastes for modern fuel cells (Denn et al. Reference Denn, Morris and Bonn2018; Guazzelli & Pouliquen Reference Guazzelli and Pouliquen2018; More & Ardekani Reference More and Ardekani2020c). Nevertheless, there is no unified model to describe their behaviour under flow, which typically departs substantially from classical laws and instead shows capricious rate dependence (Barnes Reference Barnes1989; Bender & Wagner Reference Bender and Wagner1996; Brown & Jaeger Reference Brown and Jaeger2012; Seto et al. Reference Seto, Mari, Morris and Denn2013; Mari et al. Reference Mari, Seto, Morris and Denn2014; Ness & Sun Reference Ness and Sun2015). Hence, the study of dense suspensions remains a diverse sphere of research where experimental and computational studies must be used in parallel to unveil the microscopic mechanisms underlying their bulk rheology and fluid mechanics (Denn et al. Reference Denn, Morris and Bonn2018; Duran Reference Duran2012; More & Ardekani Reference More and Ardekani2020a,Reference More and Ardekanic).
We focus here on suspensions of non-Brownian, non-attractive particles, which often shear thicken at large stresses. The new consensus (Denn et al. Reference Denn, Morris and Bonn2018; Ness et al. Reference Ness, Seto and Mari2022) is that frictional contacts are responsible for this behaviour, although the mechanism by which these contacts occur is still debated (Jamali & Brady Reference Jamali and Brady2019). Experimental measurements of particle–particle-contact physics (Comtet et al. Reference Comtet, Chatté, Nigues, Bocquet, Siria and Colin2017; Hsu et al. Reference Hsu, Ramakrishna, Zanini, Spencer and Isa2018) reveal that static friction is present, although measured sliding coefficients are incongruous with the bulk rheology suggesting that other physics (rolling, twisting, adhesion, contact deformation leading to shear thinning) may also be at play (Lobry et al. Reference Lobry, Lemaire, Blanc, Gallier and Peters2019; Arshad et al. Reference Arshad, Maali, Claudet, Lobry, Peters and Lemaire2021).
Although numerical models which employ fictitious friction coefficients have led to substantial progress in establishing the constitutive behaviour of these suspensions (Mari et al. Reference Mari, Seto, Morris and Denn2014; Ness, Xing & Eiser Reference Ness, Xing and Eiser2017b; Gillissen & Ness Reference Gillissen and Ness2020; Gillissen et al. Reference Gillissen, Ness, Peterson, Wilson and Cates2020) and have shed light on experimental findings (Lin et al. Reference Lin, Guy, Hermes, Ness, Sun, Poon and Cohen2015; Guy et al. Reference Guy, Ness, Hermes, Sawiak, Sun and Poon2020; Singh et al. Reference Singh, Ness, Seto, de Pablo and Jaeger2020), they necessarily miss more detailed aspects of the surface physics involved – especially the effect of physical interlocking between asperities. Other numerical works have made substantial progress in exposing the role of roughness height (More & Ardekani Reference More and Ardekani2020a,Reference More and Ardekanib), but lack explicit asperity interlocking.
In particular, this picture and these models raise fundamental questions about the tribology of particle contacts: (i) What constitutes a contact between suspended particles? (ii) How do lubrication layers break down and are stresses sustained by fluid or solid? (iii) How do we get from surface chemistry to mechanical friction? (iv) How can we apply a ‘coarse-grained’ macroscopic friction coefficient to contacts that may comprise just a few interlocking asperities? Such questions present a new challenge to the field, and their answers will eventually inform the next generation of formulation and synthesis techniques for suspensions with engineered rheology.
Here, we present the first step in adapting our computational approach to this new paradigm. To do so, we omit the Coulombic friction coefficient typically used in dense suspension models (Seto et al. Reference Seto, Mari, Morris and Denn2013; Mari et al. Reference Mari, Seto, Morris and Denn2014) in favour of a more detailed particle surface representation comprising rigid (but frictionless) asperities and a short-range repulsive force. We then subject particle assemblies to simple shear flow and measure their bulk rheology, viz. the reduced suspension viscosity  $\eta _r$ as a function of the solids fraction
 $\phi$ and shear rate
 $\dot {\gamma }$.
2. Simulation methodology
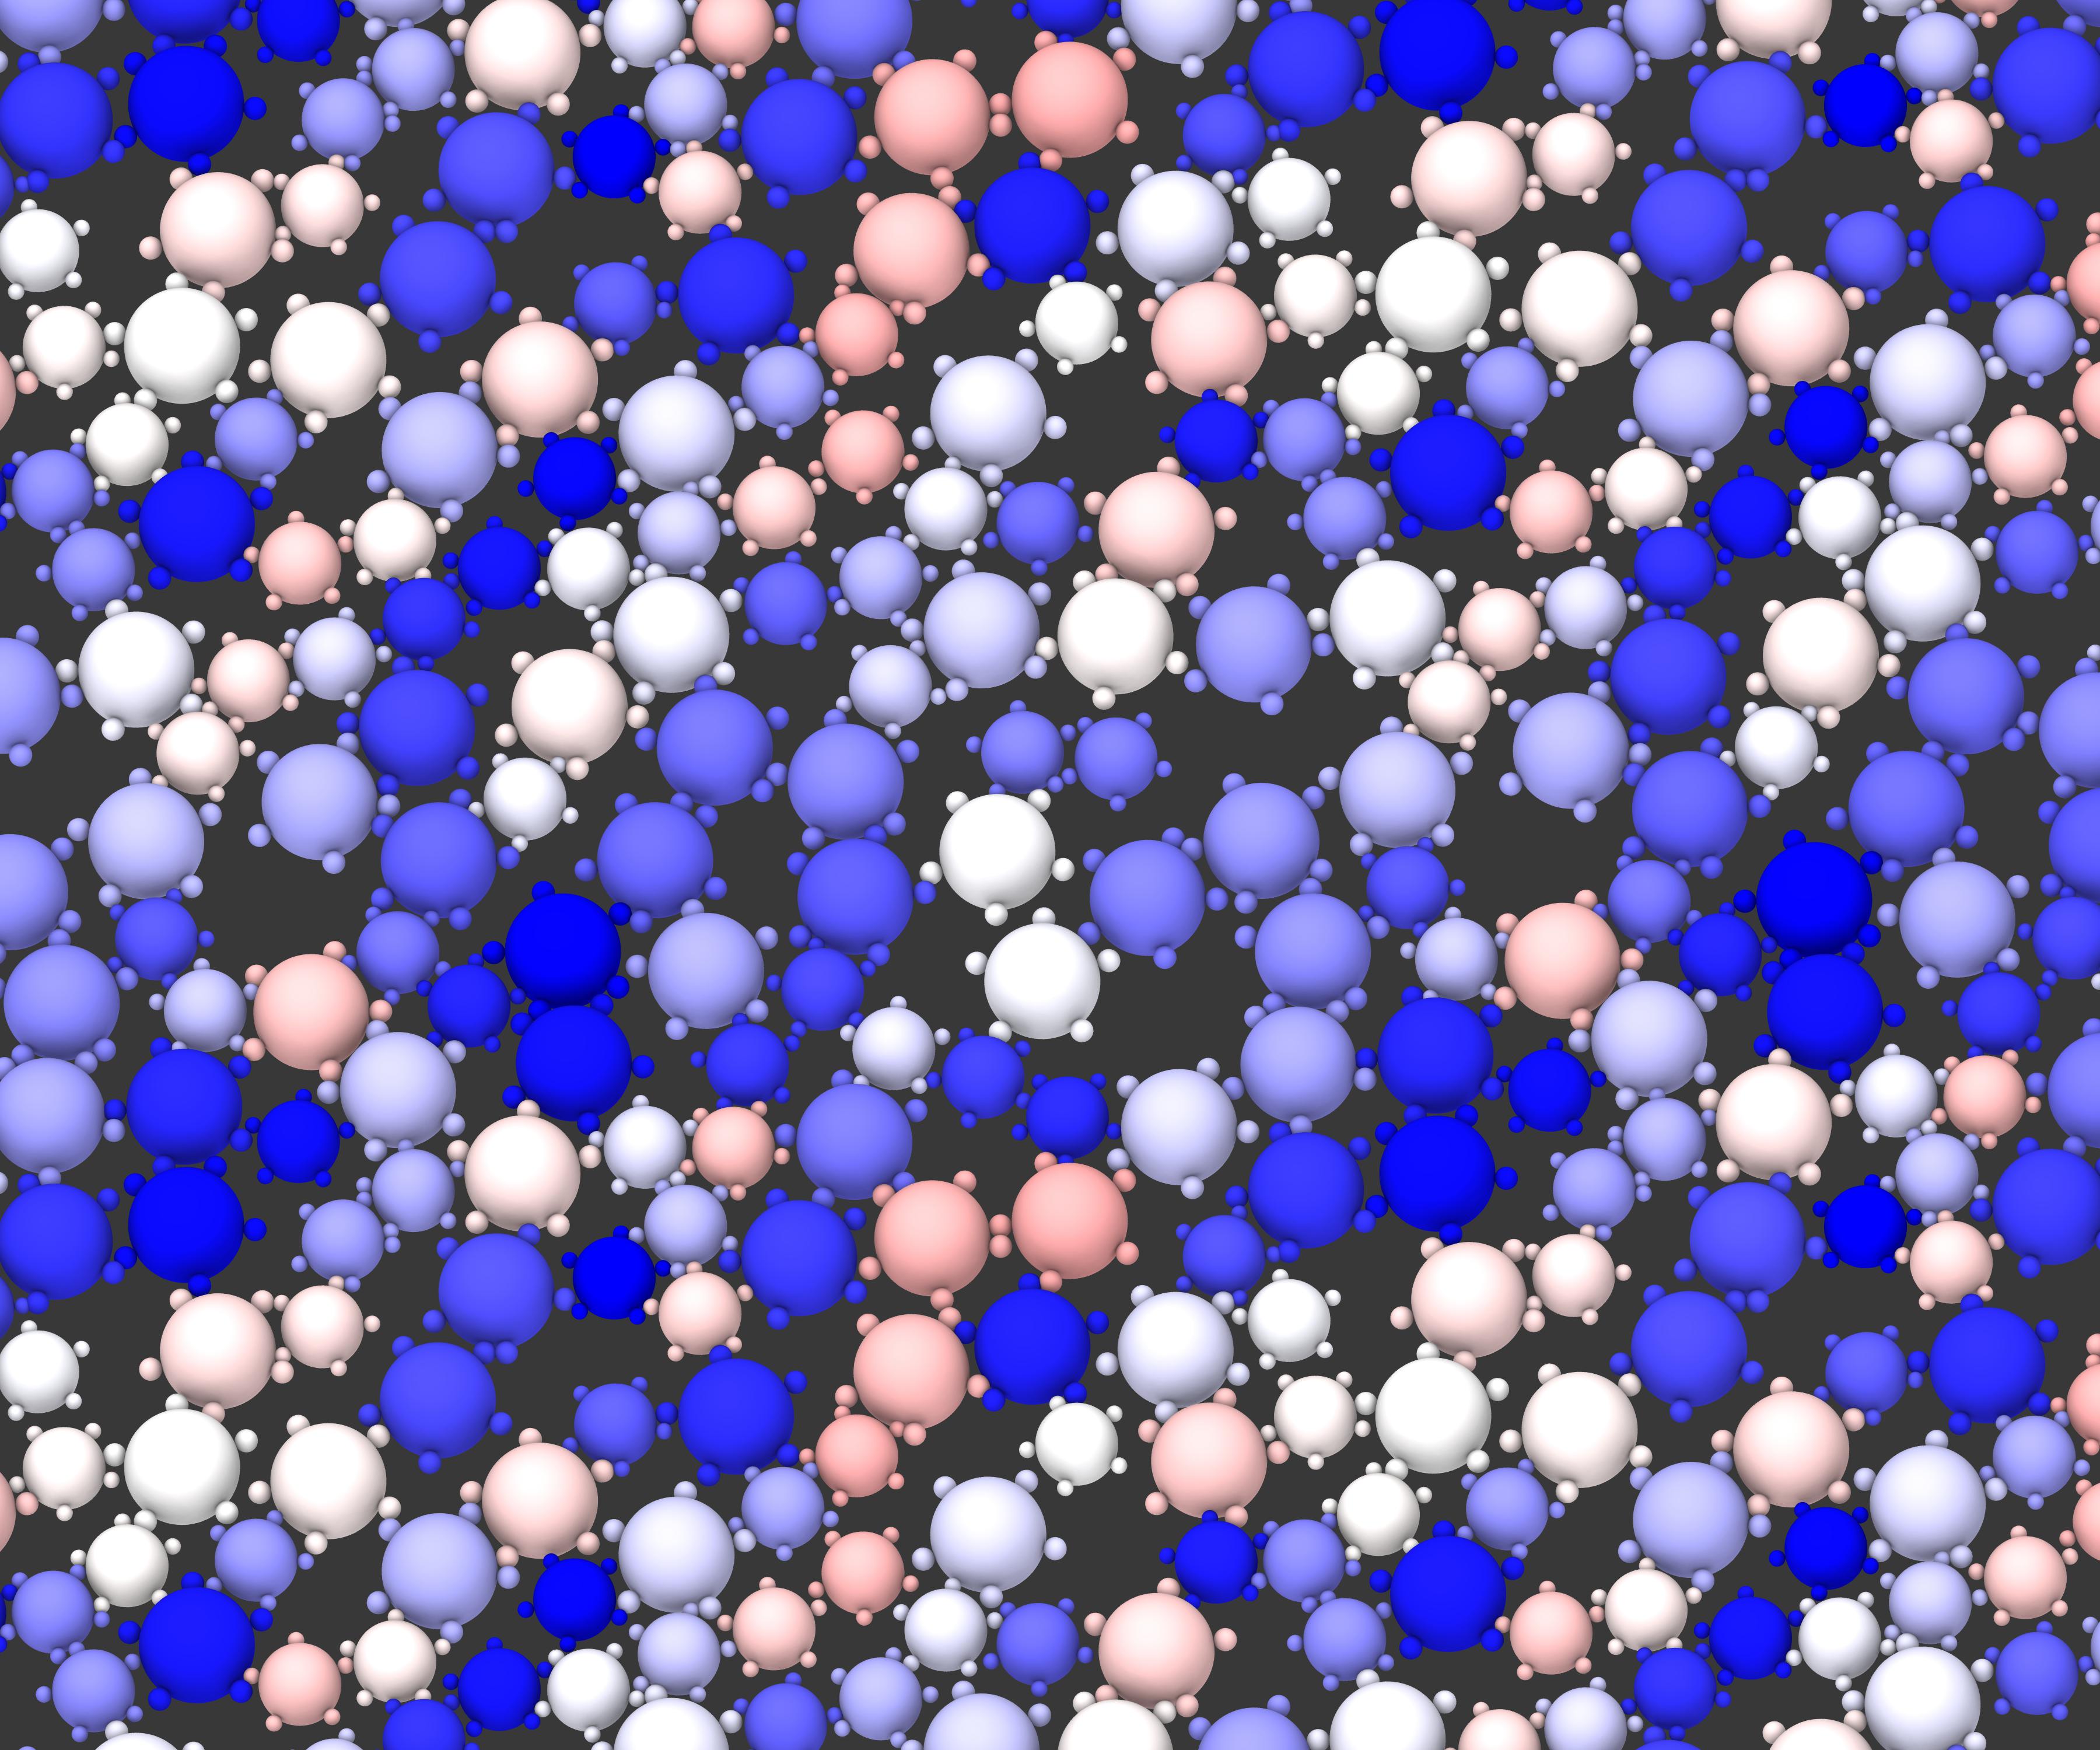
Our model is designed to invoke non-Newtonian suspension rheology (especially shear thickening) without the need for critical load models (Seto et al. Reference Seto, Mari, Morris and Denn2013) nor imposed friction coefficients. Instead, we simulate gear-like aggregate particles, which are almost a two-dimensional (2-D) analogue to those developed experimentally by Hsu et al. (Reference Hsu, Ramakrishna, Zanini, Spencer and Isa2018); figure 1.
Schematic of aggregate particles (coloured by particle). Shown are suspensions with asperity sizes  $k_r=$ (a)
 $0.05$; (b)
 $0.10$; (c)
 $0.20$. Green arrows indicate the imposed velocity profile
 $u_x(y) = \dot {\gamma }y$. Blue dashed circle represents contact with
 $P=0$ (see (3.1)).

We follow an established dense suspension simulation technique (Ness Reference Ness2021) consisting of a discrete element method (Cundall & Strack Reference Cundall and Strack1979) complemented by short-range hydrodynamics (Ball & Melrose Reference Ball and Melrose1997). The basic approach is to: (i) initialise a system of non-overlapping particles at a desired solids fraction  $\phi$; and (ii) evaluate the trajectory of each particle over a series of timesteps by numerically solving Newton's second law under a prescribed background fluid velocity gradient
 $\boldsymbol {\nabla }\boldsymbol {u}^\infty$ and a set of pairwise interactions. When needed, the bulk stress tensor
 $\mathbb {\Sigma }$ is calculated from the interaction forces and particle positions, thus generating rheology data comprising the stress
 $\mathbb {\Sigma }$ as a function of deformation rate
 $\mathbb {E}$ (with
 $\mathbb {E}\equiv \frac {1}{2}(\boldsymbol {\nabla }\boldsymbol {u}^\infty + {\boldsymbol {\nabla }\boldsymbol {u}^\infty }^\mathrm {T}$)) and
 $\phi$.
We consider a dense ( $\phi$ close to the jamming fraction
 $\phi _m$), non-Brownian (
 $k_bT$ omitted) suspension of aggregate particles (described below) under a uniform flow with an imposed deformation rate. The particle properties that set the length, mass and time scales are the characteristic radius
 $a$ (length), the density
 $\varrho$ (mass/length
 $^3$) (taken to be equal to the fluid density) and the normal stiffness
 $k_n$ (mass/time
 $^2$) (with tangential counterpart
 $k_t$). We also define a fluid viscosity
 $\eta _{f}$
 $({\rm mass}/({\rm length}\times {\rm time}))$ and a particle–particle friction coefficient
 $\mu$ (dimensionless) (set to 0 for all aggregate suspensions but used to simulate smooth frictional particles for comparison). The background flow is characterised by a velocity field
 $\boldsymbol {u}^\infty$ (length/time) and its gradient (a tensor, taken to be spatially uniform)
 $\boldsymbol {\nabla }{\boldsymbol {u}}^\infty$ (1/time), the time
 $t$ for which it is applied, and a stress tensor
 $\mathbb {\Sigma }$ (
 ${\rm mass}/({\rm time}^2\times {\rm length})$). Below we address a scalar velocity gradient as
 $\dot {\gamma }$ (
 ${\equiv }\partial u_x/\partial y$) and a scalar stress as
 $\varSigma _{xy}$ (the
 $xy$ component of
 $\mathbb {\Sigma }$). The non-dimensional parameters necessary to fully define a simple suspension under given flow conditions are then:
 $\dot {\gamma } \sqrt {\varrho a^3/k_n}$,
 $\varrho \dot {\gamma }a^2/\eta _{f}$,
 $\mu$,
 $\phi$,
 $\eta _r \equiv \varSigma _{xy}/\eta _{f}\dot {\gamma }$ and
 $\dot {\gamma }t$. Setting the first two quantities
 $\ll 1$ ensures hard particles and inertia-free conditions. The model then produces rate-independent rheology, that is
 $\eta _r=\eta _r(\phi )$ at large
 $\dot {\gamma }t$ (Boyer, Guazzelli & Pouliquen Reference Boyer, Guazzelli and Pouliquen2011).
Particles experience four types of force and torque: drag, pairwise lubrication, pairwise repulsion and pairwise contact. The full form of these is reported by several authors (Trulsson, Andreotti & Claudin Reference Trulsson, Andreotti and Claudin2012; Mari et al. Reference Mari, Seto, Morris and Denn2014; Cheal & Ness Reference Cheal and Ness2018; Ge & Brandt Reference Ge and Brandt2020) and we give a simplified description here.
The Stokes drag on particle  $i$ (radius
 $a_i$) is proportional to the difference between its velocity
 $\boldsymbol {u}_i$ and the fluid streaming velocity at its centre
 $\boldsymbol {u}^\infty (\boldsymbol {x}_i)$
 \begin{equation} \boldsymbol{F}^{d}_i ={-}6{\rm \pi}\eta_{f}a_i(\boldsymbol{u}_i - \boldsymbol{u}^\infty(\boldsymbol{x}_i)) {.} \end{equation}
This force induces flow in the simulation, causing particles to conform to the streaming velocity set by  $\boldsymbol {u}^\infty$. Similarly, a torque acts to cause the particles to rotate with angular velocity set by
 $\frac {1}{2}(\boldsymbol {\nabla }\times \boldsymbol {u}^\infty )$. Neighbouring particles
 $i$ and
 $j$ with centre-to-centre vector
 $\boldsymbol {r}_{i,j}$ (with corresponding unit vector
 $\boldsymbol {n}_{i,j}$) experience lubrication forces (see Kim & Karrila Reference Kim and Karrila1991; Jeffrey Reference Jeffrey1992) dependent on the gap
 $h$ between them and their relative velocity. The leading term of the force (written below for equal-sized spheres) scales with
 $1/h$ and the normal part of the velocity difference
 \begin{equation} \boldsymbol{F}^l_{i,j} = \frac{3}{2}{\rm \pi} a_i^2 \eta_{f}\frac{1}{h}(\boldsymbol{u}_j - \boldsymbol{u}_i)_n {.} \end{equation}
This force opposes relative motion between particle pairs. We also include the  $\log (1/h)$ terms and the tangential components as described in Cheal & Ness (Reference Cheal and Ness2018). A lower limit on
 $h$ (typically
 ${O}(10^{-3}a_i)$) prevents divergence at contact. A torque also acts to resist relative rotation between
 $i$ and
 $j$ (see Cheal & Ness Reference Cheal and Ness2018). Neighbouring particles also experience a repulsive force given by the simple form
 \begin{equation} \boldsymbol{F}^r_{i,j} = F^{rep}\exp\left(\frac{(a_i+a_j)-|\boldsymbol{r}_{i,j}|}{\rho}\right) \boldsymbol{n}_{i,j} {,} \end{equation}
with  $F^{rep}$ the force at contact and
 $\rho$ setting the rate of decay of the force. An overlapping particle pair
 $i$ and
 $j$ experience a pseudo-hard-sphere contact force dependent upon the scalar overlap
 $\delta$ and the tangential displacement accumulated over the duration of the contact
 $\boldsymbol {\xi }$
 \begin{equation} \boldsymbol{F}^c_{i,j} = k_n\delta \boldsymbol{n}_{i,j} - k_t\boldsymbol{\xi} {.} \end{equation}
The friction coefficient  $\mu$ sets an upper bound on
 $\boldsymbol {\xi }$ through
 $|\boldsymbol {\xi }|\leqslant \mu k_n\delta /k_t$ (when
 $\mu =0$ there is no tangential contact force).
The stress contribution from drag forces is proportional to  $\mathbb {E}$. The
 $\alpha,\beta$ component of the stress due to lubrication, repulsion and contact is found, respectively, by summing
 $(F^{l,\alpha }_{i,j}r^\beta _{i,j} + F^{l,\beta }_{i,j}r^\alpha _{i,j})/2$,
 $F^{r,\alpha }_{i,j}r^\beta _{i,j}$ and
 $F^{c,\alpha }_{i,j}r^\beta _{i,j}$ over all interacting pairs. The forces are summed on each particle and the trajectories are then updated using a numerical scheme with timestep chosen to be small compared with
 $\sqrt {\varrho a^3/k_n}$ and
 $\varrho a^2/\eta _{f}$.
Here we address gear-like aggregate particles comprising central hosts with affixed surface asperities, figure 1. Simplifying the contact of two rough surfaces to an interaction between a number of spherically tipped asperities is a longstanding approach in tribology that follows Greenwood & Williamson (Reference Greenwood and Williamson1966). For tractability in a particle-based code aimed at obtaining rheological predictions, we interpret this approach in its simplest form, by fixing spherical asperities to particle surfaces (hemispherical asperities would yield analogous but quantitatively different results since a lower degree of interlocking would occur). This approach offers an explicit description of particle interlocking enabling study of microphysics at a more resolved level compared with those models that apply Coulombic friction.
We consider a 1 : 1 (by number) mixture of host particles with radii  $a_h$ and
 $1.4a_h$ (following conventional practice (Cheal & Ness Reference Cheal and Ness2018)). Aggregates are constructed by fixing small asperity particles (radii
 $k_ra_h$ and
 $1.4k_ra_h$) to host surfaces at equal intervals, and we explore roughnesses
 $k_r = (0.05, 0.10, 0.20)$. The quantity
 $nk_r$ is set to unity, thus specifying the number
 $n$ of asperities on each host. The drag, lubrication and contact forces (with
 $\mu =0$) described above are summed over all particle constituents (host plus asperities) of each aggregate at each timestep before the resultant total force is applied uniformly across all particle constituents taking into account the differing masses of host and asperity. Repulsive forces (
 $\boldsymbol {F}^r$) act on hosts only. Thus, the aggregates behave as rigid bodies (no relative translation or rotation between host and asperities). For comparison, we also simulate smooth particles under the same shearing conditions. These are essentially aggregates with
 $k_r=0$ and with a variable surface friction coefficient
 $\mu$ set either to 0 (frictionless) or 100 (frictional). For simplicity we use a 2-D domain, simulating a monolayer of spherical or spherical-aggregate particles. We consider systems of
 ${O}(10^2)$ aggregate particles, having verified that larger systems produce statistically equivalent results.
We apply simple shear flow with rate  $\dot {\gamma }$ (green lines, figure 1) by tilting the periodic simulation box (at fixed volume) and mapping particle motion across the upper and lower
 $x$ planes using Lees–Edwards conditions. Each simulation is run to
 $\dot {\gamma t}=4$ and bulk properties are time averaged across the steady state (typically observed for
 $\dot {\gamma }t\gtrsim 1$), and across 10 independent realisations. The repulsive force magnitude
 $F^{rep}$ can be used to define a dimensionless shear rate
 $\dot {\gamma }^*=6{\rm \pi} \eta _{f}a^2\dot {\gamma }/F^{rep}$, quantifying rate dependence in our model. The model is implemented in LAMMPS (Plimpton Reference Plimpton1995).
3. Simulation results
The interpretation of the bulk rheology resulting from our model is qualitatively consistent with much of the recent literature (Ness et al. Reference Ness, Seto and Mari2022). We give a brief account of the  $\phi$,
 $\dot {\gamma }^*$ and
 $\rho$ dependence of
 $\eta _r$ before focussing on the microstructural behaviour.
3.1. The effect of solid loading
To study the role of solid loading we consider  $\phi = 0.55\unicode{x2013}0.86$ at intervals of
 $\Delta \phi =0.01$ (where
 $\phi$ takes into account the total aggregate areas (i.e. the combined areas of hosts plus asperities)), ensuring that
 $\phi _m$ is captured in all cases (Kausch, Fesko & Tschoegl Reference Kausch, Fesko and Tschoegl1971). Here,
 $\phi _m$ represents the value of
 $\phi$ at the inflexion in
 $\eta _r(\phi )$ (see below and figure 2). We focus on the particle-contact regime by setting the magnitude of the repulsive force
 $F^{rep}$ negligibly small (equivalent to
 $\dot {\gamma }^*\rightarrow \infty$, and thus recovering rate independence). In all cases
 $\eta _r$ increases according to a power law as
 $\phi \rightarrow \phi _m$, with aggregate particles having smaller
 $\phi _m$ than smooth ones, figure 2. For frictionless smooth particles
 $\phi _m\approx 0.84$, which is in quantitative agreement with Reichhardt & Reichhardt (Reference Reichhardt and Reichhardt2014) and O'Hern et al. (Reference O'Hern, Silbert, Liu and Nagel2003). Frictional smooth particles and each of the aggregate suspensions exhibit
 $\phi _m$ well below this value.
Divergence of the relative viscosity  $\eta _r$ with area fraction
 $\phi$ at
 $\dot {\gamma }^*=\infty$ for each of the suspension types explored. Shown in dashed lines are fits to
 $\eta _r = \nu (1-\phi /\phi _m)^{-\lambda }$. The maximum solid fractions for smooth particles
 $\mu =(0,100)$ and aggregates with
 $k_r=(0.05,0.10,0.20)$ are, respectively,
 $\phi _m=(0.84,0.77,0.74,0.71,0.69)$ (see table 1).

Generally, jamming occurs at lower  $\phi$ as the size of the tangential forces between particles increases in smooth suspensions (i.e. increasing
 $\mu$); while for aggregates
 $\phi _m$ decreases systematically as surface roughness
 $k_r$ is increased. Our chosen values of
 $k_r$ demonstrate a transition from the
 $k_r\to 0$ limit (smooth particles with large
 $\mu$) to saturation (there is not much variation between
 $k_r=0.10$ and
 $k_r=0.20$). The behaviour may deviate at larger
 $k_r$ as aggregates resemble more fractal, floc-like structures that are beyond the scope of this work.
This agrees broadly with the experimental work of Hsu et al. (Reference Hsu, Ramakrishna, Zanini, Spencer and Isa2018) as well as several works recounted by Hsiao & Pradeep (Reference Hsiao and Pradeep2019). Similar to Cheal & Ness (Reference Cheal and Ness2018) the divergence is in the contact contribution to the stress, although interestingly the value of  $\phi$ above which contacts dominate is roughly independent of
 $k_r$ for aggregates despite their differing
 $\phi _m$. Due to the finite stiffness of our simulated particles we observe an overturn in the viscosity at
 $\phi \geqslant \phi _m$, ordinarily only observed experimentally for soft particles (e.g. Nordstrom et al. Reference Nordstrom, Verneuil, Arratia, Basu, Zhang, Yodh, Gollub and Durian2010). Focussing on the behaviour below
 $\phi _m$, a reasonable approximation of the rheology is obtained via the phenomenological expression
 $\eta _r=\nu (1-\phi /\phi _m)^{-\lambda }$, with values of
 $\phi _m$ given in the figure 2 caption, and full fitting parameters given in table 1.
Fitting parameters for the relative suspension viscosity as a function of the solid fraction, with functional form  $\eta _r = \nu (1-\phi /\phi _m)^{-\lambda }$.

3.2. Shear rate dependence
We explored shear rates  $\dot {\gamma }^* = {O}(10^{-4}\unicode{x2013}10^3)$ at modest repulsive force decay rates
 $\rho =3k_ra_h$ (
 $\rho =0.1(a_i+a_j)$ for smooth particles), and a range of
 $\phi <\phi _m$, figure 3. In all cases the model predicts a sequence of shear thinning at
 $\dot {\gamma }^*\lesssim 1$, thickening at
 $1\lesssim \dot {\gamma }^*\lesssim 10^2$ and a quasi-Newtonian plateau at
 $\dot {\gamma }^*\gtrsim 10^2$. The sharp transition from shear thinning to dramatic shear thickening observed by Egres & Wagner (Reference Egres and Wagner2005), Boersma, Laven & Stein (Reference Boersma, Laven and Stein1990) and Hsu et al. (Reference Hsu, Ramakrishna, Zanini, Spencer and Isa2018) is recovered close to
 $\phi _m$ in each case. Shear thickening in our aggregate model occurs as the short-ranged repulsive force gives way to asperity–asperity interactions with increasing
 $\dot {\gamma }^*$. For smooth spheres we observe very modest shear thickening when
 $\mu =0$ as the transition is from repulsive interactions to frictionless contacts as the stress is increased. For
 $\mu =100$ we observe strong shear thickening, similar to the aggregate cases.
Rheology of smooth and aggregate particles, showing the relative viscosity  $\eta _r$ as a function of shear rate
 $\dot {\gamma }^*$ (a,c,e,g,i) and stress
 $\eta _r\dot {\gamma }^*$ (b,d,f,h,j) for several
 $\phi$ (see legends). Shown are: (a,b) smooth frictionless (
 $\mu =0$) particles; (c,d) smooth frictional (
 $\mu =100$) particles; (e,f) aggregates with
 $k_r=0.05$; (g,h) aggregates with
 $k_r=0.10$; (i,j) aggregates with
 $k_r=0.20$. For (a–d)
 $\rho =0.1(a_i+a_j)$; for (e–j)
 $\rho =3k_ra_h$. Insets show sketches of smooth and aggregate particles represented in each panel.

When plotting  $\eta _r(\dot {\gamma }^*)$ (figure 3), we see that aggregates exhibit
 $\eta _r$ significantly higher than those of frictionless and frictional smooth particles when comparing equal
 $\phi$. Meanwhile, as the aggregate
 $k_r$ is increased
 $\eta _r$ generally increases, although comparing
 $k_r=0.10$ with
 $k_r=0.20$ the effect is rather subtle suggesting, interestingly, that these two asperity sizes produce comparable
 $\phi _m$, consistent with figure 2. For example, at
 $\phi =0.68$, we see
 $\eta _r$ increase from
 ${O}(10^1)$ to
 ${O}(10^2)$ for aggregates as their surface roughness is increased from 0.05 to 0.20, compared with
 $\eta _r\approx 20$ for smooth particles with
 $\mu =100$. This is consistent with Pan et al. (Reference Pan, de Cagny, Weber and Bonn2015) and Hsu et al. (Reference Hsu, Ramakrishna, Zanini, Spencer and Isa2018), and a comparison with Tanner & Dai (Reference Tanner and Dai2016) reveals that, at comparable proximity to jamming (comparing data at
 $\phi /\phi _m\approx 0.85$), moving from smooth particles to aggregates with
 $k_r=0.05$ leads to viscosity increases of 1.4 (experiment) and 2 (simulation). The particles used by Tanner & Dai (Reference Tanner and Dai2016) were produced via grinding and have highly irregularly shaped asperities so a precise quantitative match is untenable. Notwithstanding the difficulty in comparing 2-D simulation with 3-D experiment, our aggregate model successfully captures the broad effects of varying surface roughness on suspension viscosity. A more quantitative comparison of simulation and experiment would require extensive 3-D computation involving aggregate particles with geometry closer to those of the experiment.
Looking at the stress dependence (figure 3), we see that for all suspensions thickening starts at a critical dimensionless stress  $(\eta _r\dot {\gamma }^*)^{\dagger} \approx 1$ and reaches a plateau at a second
 $(\eta _r\dot {\gamma }^*)^\ddagger \approx 10^2$. These results being independent of
 $\phi$ and the particle roughness (both
 $\mu$ and
 $k_r$) is consistent with theory (Wyart & Cates Reference Wyart and Cates2014), experiment (Bender & Wagner Reference Bender and Wagner1996; Lootens et al. Reference Lootens, Van Damme, Hémar and Hébraud2005; Brown & Jaeger Reference Brown and Jaeger2012; Guy, Hermes & Poon Reference Guy, Hermes and Poon2015) and other simulations (Mari et al. Reference Mari, Seto, Morris and Denn2014; More & Ardekani Reference More and Ardekani2020b,Reference More and Ardekanic). The generality of this result could, therefore, be used to determine the critical shear rates required for the onset and plateau of shear thickening in a given system.
3.3. Range of repulsive force
Generically, the presence of a repulsive force leads to shear thinning (Ness et al. Reference Ness, Seto and Mari2022). When a suspension is at very low  $(\eta _r\dot {\gamma }^*)$, the relatively large value of
 $F^{rep}$ ensures particles will not come into contact with each other. Each particle is thus surrounded by a repulsive force field into which other particles cannot penetrate. This leads to them appearing artificially larger, with their radius becoming
 $a_{eff}=a_h+\varDelta$. As such we may define a
 $\phi _{eff}$ (larger than
 $\phi$) applicable to the shear thinning regime. Given a viscosity relation such as
 $\eta _r\sim (1-\phi /\phi _m)^{-\lambda }$, increases to
 $\phi$ will naturally lead to increased
 $\eta _r$.
The rate of decay  $\rho$ associated with the repulsive force
 $F^{rep}$ plays a key role, most importantly affecting the rate of shear thinning. For frictionless smooth particles, increasing
 $\rho$ systematically lowers
 $\eta _r$ in the shear thinning region (
 $(\eta _r\dot {\gamma }^*)<(\eta _r\dot {\gamma }^*)^{\dagger}$) as particles are kept at further distance from one another, forcing a more isotropic structure. Increasing the stress shifts the system from being controlled by repulsive forces to being controlled by frictionless contact forces.
The behaviour for frictional smooth particles is rather more subtle. For  $\rho \geqslant 0.1(a_i+a_j)$ there remains a systematic (but very weak) decrease in
 $\eta _r$ with increasing
 $\rho$ during shear thinning, with all cases eventually reaching the same plateau. For
 $\rho =0.01(a_i+a_j)$, however, the behaviour is qualitatively different: here, we see shear thinning at much lower
 $(\eta _r\dot {\gamma }^*)$, before a low
 $\eta _r$ plateau at
 $(\eta _r\dot {\gamma }^*)\approx 1$ that gives way to thickening at
 $(\eta _r\dot {\gamma }^*)>1$. In this case the particles behave almost as frictionless hard spheres until the stress reaches high enough values to induce frictional contact. This is because the added effective volume argument made above is less relevant (since in principle
 $(\phi _{eff}-\phi )\sim \rho ^3$) but nonetheless
 $F^{rep}$ is sufficient to prevent direct particle contact at low stress. Note that figures 4(a) and 4(b) are measured for comparable
 $\phi /\phi _m$ (which means they are at different
 $\phi$). The shear thickening behaviour in figure 4(b) is of the same type as that observed in the ‘electrostatic repulsion model’ of Mari et al. (Reference Mari, Seto, Morris and Denn2014) i.e. a short-ranged repulsive force gives way to contacts with Coulombic friction.
Rheology of smooth and aggregate particles, showing the relative viscosity  $\eta _r$ as a function of repulsive force decay rate
 $\rho$ (see legend). In each case the solid fraction
 $\phi$ is chosen close to frictional jamming, so that
 $\phi /\phi _m\approx 0.93$. Shown are: (a) smooth frictionless (
 $\mu =0$) particles; (b) smooth frictional (
 $\mu =100$) particles; (c) aggregates with
 $k_r=0.05$; (d) aggregates with
 $k_r=0.10$; (e) aggregates with
 $k_r=0.20$. Insets show sketches of smooth and aggregate particles represented in each panel.

For aggregate suspensions the effect of  $\rho$ is largely independent of the asperity size. Interestingly, for small
 $\rho$ (crucially this means
 $\rho \ll k_r a_h$) there is a regime in which the aggregate suspensions are no longer shear thinning. Here, the repulsive force decays so rapidly that it becomes too weak to prevent asperity interlocking: the suspension thus enters a ‘permanently thickened’ state in which asperities are always protruding. For larger
 $\rho$, the repulsive force extends beyond the perimeter of the asperities so that changing
 $\dot {\gamma }^*$ affects the potential for interlocking and therefore controls the rheological response. Specifically, aggregate suspensions show shear thinning followed by shear thickening as the stress is increased (qualitatively similar to frictional smooth particles).
Overall, where a shear thinning region does exist (that is, at low stresses where the coordination number  $Z=0$)
 $\eta _r$ will be independent of the surface particle roughness (i.e.
 $\mu$ or
 $k_r$) at a given
 $\phi$ and
 $\rho$. Meanwhile, the plateau in
 $\eta _r$ above
 $(\eta _r\dot {\gamma }^*)^\ddagger$ is independent of
 $\rho$ but sensitive to
 $\mu$,
 $k_r$ and
 $\phi$.
3.4. Micromechanical mechanisms
We now consider the microstructural behaviour, focussing on the average number of contacts or interlocking particle pairs present at various  $\phi$ and
 $\dot {\gamma }^*$. We use the average mechanical coordination number
 $Z$ (following Sun & Sundaresan Reference Sun and Sundaresan2011) calculated as
 $Z={2N_c}/{N}$, where
 $N_c$ is the number of particle–particle contacts and
 $N$ is the number of ‘whole’ particles (i.e. smooth particles or aggregates). To calculate
 $N_c$ under a given set of conditions, we first evaluated the number of particles separated by a distance less than a minimum distance required for contact. Importantly, smooth and aggregate particles will have different criteria for this. For smooth particles, contacts are identified based on intersecting surfaces (i.e. the scalar separation of the particle centres is less than the sum of their radii). For aggregates, contact detection is more involved as it becomes necessary to identify the point at which sufficient asperity interdigitation occurs to induce particle–particle interlocking (ultimately leading to shear thickening). To do this, we investigated a range of asperity interdigitation thresholds and determined which was most appropriate. We define a contact between aggregates
 $i$ and
 $j$ as occurring when the scalar separation between host particle centres
 $r$ is
 \begin{equation} r\leqslant (a_h^i + a_h^j) + (2-P)(k_r^ia_h^i + k_r^ja_h^j), \end{equation}
with  $P$ the fractional interdigitation of the asperities for a pair of contacting particles (see figure 5a). For
 $P=0$ a contact occurs when one aggregate enters the outer perimeter set by the asperities of another (blue dashed circle in figure 1); for
 $P=1$ a contact occurs when the asperity of one aggregate intersects with the host of another. We thus define a set of new mechanical coordination numbers (subscripts indicate
 $P$ values):
 $Z_0$,
 $Z_{0.125}$,
 $Z_{0.25}$,
 $Z_{0.5}$,
 $Z_{0.75}$. We seek a suitable definition of
 $Z$ sufficiently stringent that the coordination is low (
 ${\approx }0$) at low stress and approaching the isostatic value (
 ${\approx }2\unicode{x2013}3$) at high stress (when
 $\phi$ is close to
 $\phi _m$). Presented in figure 5(b) are
 $Z$ data for aggregates with
 $k_r=0.20$,
 $\rho =3k_ra_h$ and
 $\phi =0.62$.
Mechanical coordination number  $Z$ for smooth and aggregate particle suspensions. (a) Sketches of the relative particle positions for various values of the interdigitation fraction
 $P$; (b) The coordination number measured by different criteria of interlocking, for particles with
 $k_r=0.20$,
 $\phi =0.62$ and
 $\rho =3k_ra_h$; (c) The coordination number (
 $Z, Z_{0.5}$) measured at different
 $\phi$ for smooth and aggregate particles (isostatic points depicted by arrows).

For contacts defined with weak interdigitation ( $Z_0, Z_{0.125}, Z_{0.25}$) the coordination numbers obtained at low stress are too high. That is,
 $Z$ measured by these metrics indicate substantial particle interlocking, inconsistent with the bulk shear thinning behaviour observed. The large value of
 $Z$ means that particles do come into close contact at all stresses, but for small
 $(\eta _r\dot {\gamma }^*)$ the repulsive force is sufficiently high to prevent substantive interlocking.
In contrast, strong interdigitation ( $Z_{0.5}, Z_{0.75}$) only occurs at shear stresses above
 $(\eta _r\dot {\gamma }^*)^\ddagger$, appearing to align with the onset of shear thickening. While an overlap of 75 % only results in small increases in coordination number following shear thickening (settling at values of 0.5, figure 5b), there is a convincing increase in
 $Z_{0.5}$. This suggests that interlocking extending to around 50 % of the asperity size is a good microstructural indicator of the move to shear thickening (indeed the
 $Z_{0.5}$ behaviour mirrors that of the number of mechanical contacts per aggregate, while the effective area fraction of particles with radii
 $a_h + 0.5k_r a_h$ differs from that of our aggregate particles only by a factor of
 $0.25k_r^2$). Using the above definition, we proceed to address the contact number as a function of
 $\phi$ and
 $\dot {\gamma }^*$.
We find that increasing  $\phi$ results in greater (
 $Z_0, Z_{0.5}$), figure 5(c), as expected from the bulk rheology (figure 2). Meanwhile, at a given
 $\phi$, (
 $Z_0, Z_{0.5}$) increases in line with the particle surface roughness, or asperity size. This latter point is easily explained by realising that particles of equivalent host size but different asperity size will exhibit different degrees of reach. In other words, particles with larger surface asperities will be more likely to come into contact since (for a given
 $\phi$) they sweep a larger overall perimeter than particles with smaller asperities. It follows from this that the size of the asperities on a particle will have a direct effect on
 $\phi _m$. To investigate this, we sought to establish the critical coordination number
 $Z_C$ for each suspension i.e. the mechanical coordination number at the jamming solids fraction
 $\phi _m$ (Meyer et al. Reference Meyer, Song, Jin, Wang and Makse2010; Connelly et al. Reference Connelly, Gortler, Solomonides and Yampolskaya2020).
The theoretical critical coordination number for a 2-D system with particle surface roughness between zero and infinity is a well-known result. For frictionless ( $\mu =0$) discs
 $Z_C=4$, whilst discs with large sliding friction coefficient
 $\mu \gg 0$ have
 $Z_C = 3$. The constraints necessary to reduce
 $Z_C$ may be generated by either: (i) tangential forces resulting from an imposed friction coefficient,
 $\mu$, or; (ii) the presence of particle asperities which lead to particle–particle interlocking. It is thus expected that the aggregates would exhibit
 $Z_C\approx \leqslant 3$ since, when interlocking, their asperities should fully constrain the sliding motion of two contacting particles (analogous to large
 $\mu$) and may constrain further degrees of freedom such as rolling too. We report in figure 5(c) the values of
 $Z$ corresponding to the values of
 $\phi _m$ reported above, showing that indeed
 $Z$ for smooth particles matches our prediction. Interestingly we found
 $Z_{0.5}<3$ for all of the aggregate particles, with
 $Z_{0.5}$ increasing as
 $k_r$ increases. Surprisingly, this suggests that aggregates with large asperities behave most like frictional (large
 $\mu$) smooth particles, whereas those with small asperities have
 $Z_C<3$ and thus likely have additional constraints to motion other than sliding. If this trend continues down to smaller asperity sizes it would suggest that sliding friction alone is not a good approximation for the interaction between spheroidal particles with small asperities.
We also considered the average number of mechanical contacts associated with each suspension at various shear stresses, figure 6. Considering first the smooth particle suspensions, we see that both  $\mu =0$ and
 $\mu >0$ experience no particle contacts at low stress, with
 $Z$ then sharply increasing, reaching a plateau similar to the trends seen in
 $\eta _r$ (figure 3). The same trend occurs for the aggregates: we find
 $Z_{0.5}\approx 0$ when below the critical stress (i.e. while the suspension is in the shear thinning regime) before rising sharply to values of between 1.5 and 3 as we enter shear thickening. The increase in particle coordination occurs over the same range of
 $\eta _r\dot {\gamma }^*$ as the shear thickening reported in figure 3. In light of these results, we conclude that the observed shear thickening behaviour for aggregates is a consequence of a sudden increase in the number of interlocking particle contacts (to around
 $50\,\%$ of the asperity size) above a critical shear stress.
Mechanical coordination number as a function of dimensionless shear stress  $(\eta _r\dot {\gamma }^*)$ at various solid fractions
 $\phi$. (a) Smooth particles with
 $\mu =0$; (b) smooth particles with
 $\mu =100$; (c) aggregates with
 $k_r=0.05$; (d) aggregates with
 $k_r=0.10$; (e) aggregates with
 $k_r=0.20$. For (a,b)
 $\rho =0.1(a_i+a_j)$; for (c–e)
 $\rho =3k_ra_h$ and we use
 $Z_{0.5}$. Insets show sketches of smooth and aggregate particles represented in each panel.

On the whole our rheology data suggest that aggregate particle rheology can be described analogously to that of smooth particles, using an appropriate  $\phi _m$ along with models for the viscosity such as Krieger & Dougherty (Reference Krieger and Dougherty1959) and Wyart & Cates (Reference Wyart and Cates2014). Relating the maximum packing to just a sliding friction coefficient is not straightforward, however, as our measured values of
 $Z$ suggest that roughness introduces other constraints such as rolling and twisting.
4. Concluding remarks
The importance of particle interlocking on shear thickening in suspensions of rough particles has been demonstrated through the use of a simple model comprising hydrodynamic contributions, normal contact forces and medium-range repulsion. Our model is both minimal in its physics and tractable in its computational expense, yet shows agreement with relevant experimental findings.
We successfully predict the relative increase in viscosity for suspensions of increasing surface roughness (Tanner & Dai Reference Tanner and Dai2016; Hsu et al. Reference Hsu, Ramakrishna, Zanini, Spencer and Isa2018) by explicitly modelling the contacts that arise between surface asperities on aggregate particles, a feat which is not possible in models that apply fictitious friction coefficients to smooth particles. Our model is complementary to the latter, allowing explicit interaction of asperities and offering a more resolved description of frictional contacts. We also demonstrated that particle interlocking is important in describing the evolution of  $\eta _r$ with stress and jamming with increasing
 $\phi$, and were able to recover isostatic points in close agreement with theory.
We also invoked the idea of an effective solid fraction to explain the roughness-independent rheology in the shear thinning regime. In particular, we concluded that in the shear thinning regime particles are held in a near-homogenous, non-contacting state and their surface morphology becomes irrelevant to their interactions. As the imposed stress is increased, however, we essentially shrink the ‘protective bubble’ around the particles, exposing their asperities to interlocking. Here, surface details become important to the bulk rheology and allow shear thickening. We do not observe shear thinning in aggregates when the repulsive force is short ranged since the suspension is in a permanently thickened, interlocking state. Moreover, if  $\phi$ is increased, sterics mean the particles will constantly be forced to contact one another regardless of the repulsive forces; leading to greater levels of interlocking and higher viscosities.
From this collection of observations we identify 3 key practical outcomes: (i) all things being equal, shear thickening will occur at lower shear rates for higher  $\phi$ and/or higher
 $k_r$; (ii) as the length over which the repulsive force existing between particles is increased, the shear rate required for thickening will increase; (iii) for aggregate suspensions with comparable
 $\phi /\phi _m$ and the same range of repulsive force decay (with respect to the size of their asperities), the surface roughness will determine the point at which shear thickening takes hold. In particular, as surface roughness is increased the shear rate at which shear thickening occurs will decrease and the transition to thickening will take place at lower
 $\phi$. (This trend was also observed during shear stress controlled simulations (More & Ardekani Reference More and Ardekani2020a).)
As is true for most dense suspension models (Ness & Sun Reference Ness and Sun2016), we are unable to fully reproduce experimental normal stress behaviour. Our model overpredicts  $N_1$ during shear thinning, yielding highly positive values in contrast to experiments which suggest
 $N_1\approx 0$. Hence, further investigation is required to understand the mechanism leading to this discrepancy. Our model quickly becomes intractable for
 $k_r<0.05$ or for systems much larger than
 ${O}(10^2)$ aggregate particles; thus, there is a clear need to develop new methods for dealing with particles of complex geometry.
We focused here on a simplistic geometry and a single value of  $nk_r$ (the surface density of asperities). A complete understanding of the link between tribology of rough particles and rheology requires systematic exploration of a vast parameter space, evaluating the role of geometry on sliding and rolling friction and particle interlocking and possibly requiring a revisiting of our contact definition once
 $n$ becomes large. Similarly, since many processes involving dense suspensions (such as injection moulding, the spraying of agrochemicals and fibre spinning) involve mixed shear and extensional flows (Galindo-Rosales, Alves & Oliveira Reference Galindo-Rosales, Alves and Oliveira2013; Andrade et al. Reference Andrade, Jacob, Galindo-Rosales, Campo-Deaño, Huang, Hassager and Petekidis2020), future studies of aggregate particles should address more generalised deformation types as has been started for smooth particles (Ness et al. Reference Ness, Ooi, Sun, Marigo, McGuire, Xu and Stitt2017a; Cheal & Ness Reference Cheal and Ness2018). Our model and its predictions demonstrate the new tribological insight that can be gained by moving beyond the current paradigm of imposed friction coefficients and seeking to build rheological understanding using models with more detailed contact physics. This sets the scene for further fundamental advances in achieving a robust fluid mechanics of dense suspensions, the outcomes of which may be used to allow more informed design and processing of suspensions in engineering applications.
Supplementary material
Supplementary material is available at https://doi.org/10.1017/jfm.2022.720.
Funding
This work has made use of resources provided by the Edinburgh Compute and Data Facility (ECDF). C.N. acknowledges support from the Royal Academy of Engineering under the Research Fellowship scheme. Example LAMMPS scripts necessary to reproduce the data in this paper can be found at https://doi.org/10.7488/ds/3505.
Declaration of interests
The authors report no conflict of interest.



 Open access

