Introduction
Picrorhiza kurroa, also known as kutki, is a small perennial herb from Scrophulariaceae family found in the Himalayan region at an altitude of 2700–4500 m. It mainly possesses hepatoprotective activity along with other medicinal properties, which makes this plant highly valuable. Its medicinal importance is due to the presence of iridoid glycosides, picroside-I (P-I) and picroside-II (P-II). Although P. kurroa is self-regenerating, indiscriminate collection of its underground parts has led to a considerable depletion of natural populations (Patial et al., Reference Patial, Devi, Sharma, Bhattacharya and Ahuja2012). Also the seeds of this plant have low viability (Chandra et al., Reference Chandra, Palni and Nandi2006). As a result, the plant is now listed as an endangered species.
The proper concentration and ratio of P-I and P-II are important in determining the quality and efficacy of P. kurroa-based herbal formulations. The increasing demand for P. kurroa plant material necessitates the screening of natural populations for identification of superior chemotypes (genotypes) with desirable amount of picrosides. Considerable variation in growth and picrosides content has been observed in different populations of P. kurroa (Katoch et al., Reference Katoch, Fazli, Suri, Ahuja and Qazi2011; Kumar et al., Reference Kumar, Bhandari, Singh and Ahuja2012; Sharma et al., Reference Sharma, Pathania, Singh and Gupta2012); however, all these studies quantified P-I and P-II in rhizomes of populations collected from different geographical locations where the contents are influenced not only by the genetic makeup but also more importantly due to age and developmental stage of rhizomes, in addition to altitude, temperature and other environmental factors. These factors play an important role, as the uniformity in the selection of plant material is essential for the preparation of herbal drug formulation.
Inspite of the medicinal importance and variation in picrosides content, no attempt has been made to characterize genetic variation and population structure in natural populations of P. kurroa vis-à-vis P-I and P-II contents. Moreover, the analysis of genetic diversity and relatedness between or within different genotypes is a prerequisite toward efficient utilization and protection of plant genetic resources (Weising et al., Reference Weising, Atkinson and Gardner1995a, Reference Weising, Nybom, Wolff and Meyerb). Also, the study of genetic diversity would be helpful in the development of DNA diagnostics for the authentication of superior genotypes. Recently, genetic diversity study has been carried out in P. kurroa using simple sequence repeat (SSR) and cytochrome P-450 markers (Katoch et al., Reference Katoch, Hussain and Ahuja2013). But in their study, 25 accessions of P. kurroa were investigated using 22 SSR primers from rice not from P. kurroa. The objective of our study was to identify a suitable tissue for quantification of variation in major chemical constituents (P-I and P-II) across a collection of populations collected from different locations but planted at a common location so as to reflect genetic variation in contents. To study genetic diversity, we focused on SSR markers that have been widely used in plant germplasm evaluation (Yang et al., Reference Yang, Saghai, Xu, Zhang and Biyashev1994; McCouch et al., Reference McCouch, Teytelman, Xu, Lobos, Clare, Walton, Fu, Maghirang, Li, Xing, Zhang, Kono, Yano, Fjellstrom, DeClerck, Schneider, Cartinhour, Ware and Stein2002). The availability of whole genome transcriptome of P. kurroa enabled us to mine for whole SSRs complement and then to utilize in characterization of genetic diversity vis-à-vis picrosides content.
Material and methods
Plant material
A total of 26 accessions of P. kurroa were obtained from Himalayan Forest Research Institute (HFRI) field research station, Jagatsukh, Himachal Pradesh and coded as PKS-1 to PKS-26. These accessions were collected from different locations in Himachal Pradesh and planted in same environmental conditions in small fields at Jagatsukh (altitude 1900 m). The same accessions were also planted in a green house in a controlled environment at the Jaypee University. The rhizome tissues of these accessions were also obtained from HFRI, which were collected from their natural locations. The plant material was collected from 2011 to 2013 twice a year (May and September).
Sample preparation and high-performance liquid chromatography analysis
Twenty-six accessions of P. kurroa were quantified for picrosides content using reverse phase-high-performance liquid chromatography (HPLC). Each sample was taken in duplicates and quantification was repeated for four times (twice a year) to get an accurate estimation of picrosides content. The results shown are the average values of picrosides content analysis that performed during the period May 2011 to May 2013. HPLC analysis was performed for fresh shoots as well as dried rhizomes. Dried tissue was ground in a grinder to a fine powder and used for quantification. Fresh tissues were ground to a fine powder in liquid nitrogen. Then, 100 mg of powdered material (fresh or dried) was percolated with 10 ml of 80% methanol overnight at room temperature. The methanolic extract was filtered through 0.22 μm membrane filter and 1:10 dilution of filtered extract was made using 80% methanol. Quantification of picrosides was performed by following the protocol reported by Sood and Chauhan (Reference Sood and Chauhan2010) on Waters HPLC System equipped with Waters 515 HPLC pumps, Waters 717 autosampler, Waters 2996 photodiode array detector and Empower software. Waters Spherisorb reverse phase C18 column (4.6 mm × 250 mm, 5 μm) was used and 20 μl of sample was injected into the column for analysis. The mobile phase used for the analysis was Solvent A (0.05% of trifluoroacetic acid in water) and Solvent B (1:1 methanol–acetonitrile mixture). Solvents A and B were used in the ratio of 70:30 (v/v). The column was eluted in an isocratic mode with a flow rate of 1 ml/min at detection wavelength of 270 nm. The cycle time of analysis was 30 min at 30°C. The compounds were identified on the basis of their retention time and comparison of UV spectra with the authentic standards procured from ChromaDex, Inc., California, USA.
Identification of SSRs and primer designing
Simple sequence repeats (SSRs) were identified in the whole genome transcriptomes of P. kurroa, which showed differential accumulation of picrosides (Table S1, available online) using an in-house designed Perl script. The Perl script used regular expressions to locate SSR patterns in the FASTA-formatted sequence files and reported sequence contig ID, SSR motif, number of repeats, and sequence coordinates for each SSR. The FASTA-formatted sequence file was allowed to search for all possible combinations of mononucleotide, dinucleotide, trinucleotide, tetranucleotide, pentanucleotide and hexanucleotide repeats. The minimum repeat unit was defined as 12 for mono and dinucleotides, 5 for trinucleotides and 3 for all other higher-order motifs, including tetra, penta and hexanucleotides. Primers were designed from the sequences flanking SSR motifs by using an online primer design tool Primer3 (version 0.4.0, Tartu, Estonia) (www.bioinfo.ut.ee/primer3-0.4.0/primer3/). The target amplicon sizes were set at 100–500 bp with optimal annealing temperature of 52°C and optimal primer length of 20 bp.
DNA isolation and PCR amplification
Total genomic DNA was isolated from fresh leaves by following the CTAB method developed by Murray and Thompson (Reference Murray and Thompson1980). The quality of DNA was checked on 0.8% agarose gel and quantified in a NanoDrop spectrophotometer. Concentration of each DNA sample was adjusted to 100 ng/μl. PCR reactions were performed in 12.5 μl volume and each PCR reaction consisted of 100 ng genomic DNA, 0.5 μm of each primer, 200 μm dNTPs and 0.5 units Taq polymerase. PCR amplification programs included 94°C for 5 min, 35 cycles of 94°C for 45 s, annealing temperature (47–55°C) for 45 s, 72°C for 2 min, and a final extension of 7 min at 72°C. Then, 12 μl of each PCR product was mixed with 2 μl of 6X loading dye (0.25% of bromophenol blue, 0.25% of xylene cyanol and 30% of glycerol in MilliQ water, Millipore, Netherlands) and subjected to agarose gel electrophoresis using 4% metaphor agarose gel prepared in 1X Tris-acetate-EDTA (TAE) buffer. The gel was run at a constant voltage of 100 volts for 1.5 to 2 h, stained with ethidium bromide, and analysed by using the gel documentation system AlphaImager EP (Alpha Innotech Corp., USA).
Polymorphism and statistical analysis
Polymorphism among different accessions was assessed by comparing SSR fragments separated according to their respective sizes on agarose gel by comparing with 100 bp DNA ladder (Thermo Scientific, USA). A data matrix was generated based on the banding patterns obtained from SSR amplification in 26 accessions. Population structure of the accessions was assessed by using the software program STRUCTURE (version 2.3.3, Stanford, California) (Pritchard et al., Reference Pritchard, Stevens and Donnelly2000) with following parameters, length of burn-in period and number of MCMC repeats were set to 100,000, and value of k= 1–10 with five iterations. In our model, admixture was allowed and the allele frequencies were assumed to be independent. This model is recommended as a starting point for most analyses and assumes that individuals may have mixed ancestry which means individual i has inherited some fraction of his/her genome from ancestors in population k. The output records the posterior mean estimates of these proportions. Pair-wise distance matrix was calculated using Dice coefficient with 1000 bootstraps. The similarity values were used to generate a dendrogram via the unweighted pair group method with arithmetic mean (UPGMA) using the software DARwin (version 5.0.158, France) to show a phenetic representation of genetic relationships as revealed by the similarity coefficient. Popgene (version 1.31, Canada) was used to measure Nei's gene diversity (H) and Shannon's Information index (I). Cervus 3.0.3, Edinburgh, UK (Marshall et al., Reference Marshall, Slate, Kruuk and Pemberton1998) was used to calculate polymorphism information content (PIC), observed heterozygosity (H obs) and expected heterozygosity (H exp). GenAlEx 6.5 (Peakall and Smouse, Reference Peakall and Smouse2006) was used for the analysis of molecular variance (AMOVA), which is a method for studying molecular variation within a species.
Interspecies transferability of SSRs
To check interspecies transferability of SSR markers, 23 P. kurroa primer pairs were tested for amplification on six other medicinal plant species, Picrorhiza scrofulariflora, Andrographis paniculata, Aconitum heterophyllum, Swertia chirayita, Valeriana jatamansi and Hypericum perforatum.
Results
Quantification of picrosides and identification of superior accessions
P-I content varied from 0.37 to 2.7% in fresh shoots of 26 accessions. In mature rhizomes (dry) P-I content varied from 0.7 to 5.3% whereas P-II content showed variation from 3.0 to 6.7%. Total picrosides content (P-I+P-II) ranged from 3.7 to 10.9%. On the basis of P-I content in fresh shoots, the accessions were categorized as high (1.50–2.70%), intermediate (0.70–1.50%) and low (0.38–0.70%). The same 26 accessions grown in the green house were also quantified for P-I content. The P-I content ranged from 0.37 to 2.1% (Table S2, available online). The categorization was not done on the basis of total picrosides content in dry rhizomes as P-I and P-II contents showed inconsistency for the same accessions across different years of collection. PKS-1 was the only accession that consistently showed high picrosides content in rhizomes in successive repetitions.
Occurrence and distribution of SSRs in Picrorhiza kurroa
Mining of six P. kurroa transcriptomes (PKS-25, PKR-25, PKS-15, PKSS, PKSR and PKSTS) for SSRs revealed that the percentage of trinucleotide SSRs was highest (49.9%) followed by mono (24.3%), di (12.5%), tetra (5.8), hexa (4.7%) and penta (2.8%). A total of 21,748 SSRs were identified, 5136 in PKR-25, 4248 in PKS-15, 5754 in PKS-25, 1769 in PKSR, 2082 in PKSS and 2759 in PKSTS (Table S3, available online). From the total SSRs identified in P. kurroa transcriptomes, 361 primer pairs were designed for testing their polymorphisms.
SSR amplification and polymorphism analysis
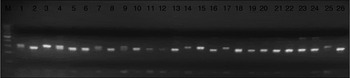
The designed SSR primers were tested for amplification as well as extent of polymorphism on 26 accessions of P. kurroa. Out of 361 SSRs, 35 (9.69%) primer pairs showed polymorphisms. A representative polymorphic gel pic for SSR primer PKSS M15 is shown in Fig. 1. Out of 35 polymorphic SSRs (Table S4, available online), the SSRs with mononucleotide repeat motifs showed the highest (25.7%) level of polymorphisms followed by di (22.9%), hexa (22.9%), tetra (14.3%), penta (8.6%) and tri (5.7%). Di- and hexa-nucleotide SSRs showed same level of polymorphisms whereas trinucletide SSRs showed least polymorphism.
SSR marker PKSS M15 showing polymorphism in 26 accessions (Lanes 1–26) of Picrorhiza kurroa. M is 100 bp DNA ladder.

Genetic diversity analysis in Picrorhiza kurroa accessions
Genetic diversity analysis was performed using Popgene. Among all accessions Nei's genetic diversity (H) ranged from 0.26 to 0.5 with a mean value of 0.39 (St. Dev. 0.226). Shannon's information index (I) ranged from 0.16 to 0.69 with mean value of 0.58 (St. Dev. 0.109). Summary of genic variation statistics for all loci is given in Table 1 and Table S5 (available online). Among high content accessions (5 no.) Nei's genetic diversity (H) ranged from 0.0 to 0.48 (mean 0.34, St. Dev. 0.172) whereas in intermediate content accessions (15 no.) it ranged from 0.0 to 0.50 (mean 0.40, St. Dev. 0.108) and in low content accessions (6 no.) it ranged from 0.0 to 0.5 (mean 0.39, St. Dev. 0.111). Shannon's information index (I) ranged from 0.0 to 0.50 (mean 0.32, St. Dev. 0.183) in high content accessions and it ranged from 0.0 to 0.68 (mean 0.57, St. Dev. 0.141) in low content accessions (Table S6, available online). Observed heterozygosity (H obs), expected heterozygosity (H exp) and polymorphism information content (PIC) was calculated using Cervus software, Edinburgh, UK. H obs ranged from 0.115 to 1.000 with an average of 0.597 and H exp ranged from 0.113 to 0.634 with an average of 0.452. The PIC values for polymorphic SSRs varied from 0.11 to 0.55 with an average of 0.39. The highest PIC value of PKSTS P9 was shown by SSR marker whereas PKSTS P1 showed the least PIC value. The PIC values for polymorphic markers alongwith number of alleles are given in Table S7 (available online).
Genetic variation statistics for all polymorphic SSR markers (the average values for 26 accessions)

H, Nei's genetic diversity; I, Shannon's information index; H obs, observed heterozygosity; H exp, expected heterozygosity; PIC, polymorphism information content.
Unbiased clustering of accessions was done by using STRUCTURE. This model is based on Monte Carlo Markov Chain. The STRUCTURE provides a model-based approach to infer population structure by using SSR marker dataset to identify k clusters to which it then assigns each individual. The results obtained from structure were analysed using an online tool Structure Harvester, USA (www.taylor0.biology.ucla.edu/structureHarvester/). The optimum k value was found to be 2. This value signifies the number of clusters in which the individuals can be dived in. The accessions were grouped into two clusters, one cluster having majority of the high content accessions and another cluster having the low content accessions with one exception PKS-26 that is a high content accession. Intermediate content accessions were randomly distributed in both clusters Fig. S1(a–c) (available online).
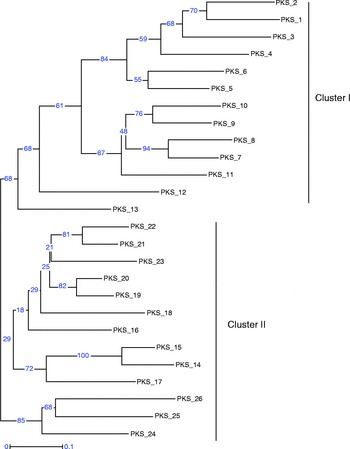
Phylogenetic relationships among different accessions of P. kurroa were inferred by Darwin using DICE similarity coefficient to verify the clustering pattern obtained from structure. This is a biased clustering method, which is based on genetic distance similarity. DICE coefficient ranged from 0 to 0.1. Cluster analysis generated a dendrogram for P. kurroa accessions, which represented the overall genetic relationship among accessions (Fig. 2). The accessions formed two major clusters. The clustering pattern obtained in Darwin was similar to unbiased clustering through structure. AMOVA analysis showed a molecular variation of 84% among accessions and 16% among high, intermediate and low content populations. All the components of molecular variations were significant with P< 0.001 (Table 2).
Bootstrapped cluster analysis (UPGMA) dendrogram for 26 accessions of Picrorhiza kurroa, based on the Jaccard's similarity coefficient matrix. Numbers at the nodes indicate the probability of the branch when the bootstrap analysis was calculated with 1000 iterations.

Summary of analysis of molecular variance (AMOVA) based on accessions of Picrorhiza kurroa (levels of significance are based on 1000 iteration steps)

df, degree of freedom; SS, sum of squares; MS, mean squares; P-value, probability of null distribution.
Cross species transferability of SSRs
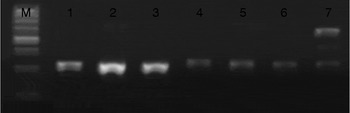
Cross species amplification of SSRs was verified by testing the microsatellite primers designed from P. kurroa transcriptomes on six other medicinal plant species, P. scrofulariflora, A. paniculata, A. heterophyllum, S. chirayita, V. jatamansi and H. perforatum. Out of 23 primers checked on these plant species, 100% showed amplification on A. paniculata followed by P. scrofulariflora (86.9%), S. chirayita, V. jatamansi, H. perforatum (73.9%) and A. heterophyllum (69.6%). A representative gel pic for SSR primer PKS-15 M4 showing amplification in different species is shown in Fig. 3.
SSR marker PKS-15 M4 showing amplification in different medicinal plant species. 1, Picrorhiza kurroa; 2, Picrorhiza scrofulariflora; 3, Andrographis paniculata; 4, Aconitum heterophyllum; 5, Swertia chirayita; 6, Valeriana jatamansi; 7, Hypericum perforatum. M is 100 bp DNA ladder.

Discussion
Our study showed that shoot tissue consistently contained same amount of P-I content in field grown plants as well as green house grown plants for two years in different seasons whereas rhizome tissue showed variable picrosides content. There was not much variation in P-I content in shoot tissues of the same accession in successive repetitions at different time periods in comparison to rhizomes, which showed inconsistent contents that may be due to difference in age and developmental stage of rhizomes at the time of collection. Rhizomes being a storage organ keep on accumulating picrosides with age whereas there are no significant differences in P-I content in shoots of different ages (Pandit et al., Reference Pandit, Shitiz, Sood and Chauhan2012). This highlights the importance of selection of plant tissue for quantification of secondary metabolites for the identification and selection of superior accessions. The variation in secondary metabolite biosynthesis and accumulation may be due to the environment or genotype or a combination of both. To nullify the effect of environmental changes and ascertain that the variation in picrosides content is not just due to environmental factors but due to differences at the genetic level, the quantification of P. kurroa accessions growing in a controlled environment in the green house was also done. Through our study, it was investigated that a large variation in picrosides content exists in P. kurroa populations growing in north-western Himalayan region.
Transcriptomic resources can serve as an important source for identification of valuable genetic markers like microsatellites, SNPs, etc. using computational approaches thus avoiding costly and time-consuming genome sequencing for identification of genetic markers. We utilized the whole genome transcriptome information for identification of SSRs, which are useful in studying genetic diversity as well as DNA diagnostics purpose. Recently, SSR and cytochrome P-450 markers have been used to study genetic diversity in Picrorhiza kurroa (Katoch et al., Reference Katoch, Hussain and Ahuja2013) and also for authentication of P. kurroa by discriminating it from its adulterant Lagotis cashmiriana (Hussain and Bedi, Reference Hussain and Bedi2012). Variable and uneven distribution of different type and abundance of repeat motifs has been observed in different plants (Gong et al., Reference Gong, Xu, Mao, Hu, Zhang, Ding and Ya-dan2010). Trinucleotide repeats were the most abundant repeats in P. kurroa. Gahlan et al. (Reference Gahlan, Singh, Shankar, Sharma, Kumari, Chawla, Ahuja and Kumar2012) also reported higher abundance of trinucleotide SSRs in P. kurroa trasncriptome. The higher abundance of trinucleotide repeats has also been observed in various plants including wheat, cereal, grape, etc. (Cardle et al., Reference Cardle, Ramsay, Milbourne, Macaulay, Marshall and Waugh2000; Gupta et al., Reference Gupta, Rustgi, Sharma, Singh, Kumar and Balyan2003). An absence of frameshift mutations due to the variety of trinucleotide repeats may be responsible for the high frequency of trinucleotide repeats (Metzgar et al., Reference Metzgar, Bytof and Wills2000). Higher abundance of trinucleotide repeats in exonic region has also been reported in castor bean (Sharma and Chauhan, Reference Sharma and Chauhan2011). Trinucleotide SSRs within exons may encode expressed amino acid runs. The majority of trinucleotide SSRs in exonic regions can be attributed to the suppression of non-trinucleotide SSRs in coding regions due to the risk of frameshift mutations, which might occur with non-trinucleotide microsatellites (Metzgar et al., Reference Metzgar, Bytof and Wills2000; Katti et al., Reference Katti, Ranjekar and Gupta2001; Li et al., Reference Li, Korol, Fahima and Nevo2004; Zhang et al., Reference Zhang, Yuan, Yu, Li and Cao2004).
By analysing the annotation of transcriptomic regions from which SSR primers were designed, it was found that some of the polymorphic SSR markers were lying in the important genic regions such as LRR receptor like serine/threonine protein kinase, WRKY transcription factor and translation initiation factor eif4a. Leucine-rich repeat receptor kinases (LRR-RKs) regulate a wide variety of developmental and defence-related processes in plants (Torii, Reference Torii2004). The WRKY transcription factors are reported to act as repressors as well as activators in important plant processes (Rushton et al., Reference Rushton, Somssich, Ringler and Shen2010) but most notably in coping with diverse biotic and abiotic stresses (Pandey and Somssich, Reference Pandey and Somssich2009). Translation initiation factors serve as the main regulatory element of the bottleneck of protein expression and are reported to be involved in plant abiotic stress tolerance (Wang et al., Reference Wang, Xu, Wang and Wang2012). All these genic regions might be responsible for regulation of picrosides biosynthesis in P. kurroa. However, these studies need to be fully validated through functional analysis of genic regions in the context of picrosides content.
Interspecies transferability of microsatellite markers overcomes the need for the costly and time-consuming procedure for the development of SSR markers for all the species. In our study, the amplification of SSRs developed for P. kurroa on other medicinal plant species showed that these SSRs can be used in the assessment of genetic diversity in these species. High level of transferability of SSR markers from Cassava to Jatropha curcas (Wen et al., Reference Wen, Wang, Xia, Zou, Lu and Wang2010) and from castor bean genome to J. curcas and related species (Sharma and Chauhan, Reference Sharma and Chauhan2011) has also been reported. High transferability of barley EST-SSRs to Hordeum chilense has been reported (Castillo et al., Reference Castillo, Varshney, Graner, Hernández, Molina-Cano, Christou, Graner, Hammer, Jouve, Keller, Lasa, Powell, Royo, Shewry and Stanca2008). Transferability of microsatellites from Catharanthus roseus to other medicinal plants has also been reported (Mishra et al., Reference Mishra, Gangadhar, Yu, Kim and Park2011).
The study indicates that P. kurroa populations in the north-western Himalayan region are not genetically highly diverse as low levels of both polymorphism and genetic diversity was observed in P. kurroa accessions. This plant is self-regenerating, which propagates mostly through stolons by asexual reproduction, because seed viability is very less (Raina et al., Reference Raina, Mehra, Chand and Sharma2010; Patial et al., Reference Patial, Devi, Sharma, Bhattacharya and Ahuja2012). It prefers cross-pollination but self-pollination also occurs to some extent (Raina et al., Reference Raina, Mehra, Chand and Sharma2010). This indicates that P. kurroa might have a mixed mating system, i.e. cross-pollination by pollen and seed dispersal as well as selfing through rhizomes. Low genetic diversity indicates inbreeding that occurs when individuals with similar genotype are more likely to mate with each other rather than individuals with different genotypes which can lead to a reduction in genetic variation. It has been reported in various studies that there is low genetic diversity in endangered plant species. As P. kurroa is also an endangered herb, low genetic diversity in our case is supported by various examples. Low genetic diversity has been reported in critically endangered Omphalogramma souliei (Primulaceae) (Huang et al., Reference Huang, Zhang and Li2009), Dysosma versipellis (Berberidaceae) (Qiu et al., Reference Qiu, Zhou, Fu and Chan2005), Glyptostrobus pensilis (Cupressaceae) (Fagen and Nianhe, Reference Fagen and Nianhe2005). It has also been stated by Hamrick and Godt (Reference Hamrick, Godt, Brown, Clegg, Kahler and Weir1989) and Frankham (Reference Frankham1995) that endangered plant species show lower genetic diversity than other species. Although a recent study carried out by Katoch et al. (Reference Katoch, Hussain and Ahuja2013) claimed high genetic variation in P. kurroa accessions collected from four states using limited number of SSR primers designed from rice genomic region. In our study, we have utilized a significantly high number of SSR primers designed from transcriptomes for more appropriate assessment of genetic diversity. Low genetic diversity in our study may be due to the reason that SSRs in coding region are more conserved (Gadaleta et al., Reference Gadaleta, Giancasproa, Zacheoa, Nigroa, Giovea, Colasuonnoa and Blancoa2011) than in genomic region, which limits SSR variation and tend to show less polymorphism in comparison to genomic SSRs. Hence, less genetic diversity is observed when SSRs from coding region are utilized. Our results are in agreement with the previous reports on various plant species, which show that genomic SSRs revealed higher polymorphism and genetic diversity in comparison to EST or coding region derived SSRs (Cho et al., Reference Cho, Ishii, Temnykh, Chen, Lipovich, McCouch, Park, Ayres and Cartinhour2000; Chabane et al., Reference Chabane, Ablett, Cordeiro, Valkoun and Henry2005; Hu et al., Reference Hu, Wang and Li2010; Tabbasam et al., Reference Tabbasam, Zafar and Mehboob-ur-Rahman2013). This suggests that using different marker systems like SSRs from coding as well as non-coding regions could be more useful in genetic diversity studies in plant species having narrow genetic base (Hu et al., Reference Hu, Wang and Li2010).
The cluster analysis of P. kurroa accessions was done using two methods, i.e STRUCTURE and Darwin and the results obtained through both the methods were comparable. The clustering pattern of distribution of accessions was not very clear because all high and low content accessions did not form separate clusters. The clustering of accessions was not much significant with respect to picrosides content. Only accessions PKS-1 and PKS-2 having high P-I content were grouped together in dendrogram, rest of the accessions showed random distribution. Similarly, in Hypericum perforatum partial correlation between secondary metabolite content and SSR data was reported and differences in genetic profile among accessions of the same species were not significant (Verma et al., Reference Verma, Smelcerovic, Zuehlke, Hussain, Ahmad, Ziebach, Qazi and Spiteller2008). One possible reason for this might be that clustering was done based on gene-specific SSR markers randomly selected from the transcriptome, without biasness for the genes responsible for picrosides biosynthesis. There was no prior knowledge that whether these genetic regions from which SSRs have been identified are involved in picrosides biosynthesis or not. The results of AMOVA analysis were also significant as higher genetic diversity was observed among accessions in comparison to genetic diversity among populations when accessions were grouped into high and low content populations. A significant P-value ( < 0.001) was obtained in both cases. When a population is divided into isolated subpopulations, there is less heterozygosity than there would be if the population was undivided. AMOVA results are consistent with studies in other plant species like Celery (Fu et al., Reference Fu, Wang, Liu and Shen2014), Apple (Zhang et al., Reference Zhang, Li, Zhao, Korban and Han2012), Alga (Mostafa et al., Reference Mostafa, Omar, Tan and Napis2011), Olive (Belaj et al., Reference Belaj, Muñoz-Diez, Baldoni, Porceddu, Barranco and Satovic2007), which show that significantly high genetic diversity among accessions rather than among populations.
The outcome of this study necessitates the planning of conservation strategies for this important medicinal herb. The genetically stable superior accessions having high picrosides content can be used for mass cultivation at lower altitudes to provide high-quality raw material. Microsatellite markers would be helpful in the development of DNA diagnostics for the authentication of quality plant material as well as planning a genetic improvement strategy. This study is a prerequisite toward efficient utilization and protection of plant genetic resources.
Supplementary material
To view supplementary material for this article, please visit http://dx.doi.org/10.1017/S1479262115000404
Acknowledgements
The authors are thankful to the Department of Biotechnology, Government of India for providing financial support to RSC in the form of a programme support on high value medicinal plants.