Introduction
Thalénite-(Y), ideally Y3Si3O10F, is a monoclinic REE silicate that was first described by Benedicks (Reference Benedicks1898, Reference Benedicks1900), from the Österby granite pegmatite, Dalarna, Sweden, and named in honour of the Swedish physicist Tobias R. Thalén (1827–1905). It has been identified subsequently in only ca. 10 other localities worldwide, primarily in niobium-yttrium-fluorine (NYF) granitic pegmatites, and some other igneous suites (Adams et al., Reference Adams, Hildebrand and Havens1962; Vorma et al., Reference Vorma, Ojanperä, Hoffren, Siivola and Löfgren1966; Nagashima and Kato, Reference Nagashima and Kato1966; Adams and Sharp, Reference Adams and Sharp1972; Kornev et al., Reference Kornev, Batalieva, Maksimov, Ilyukhin and Belov1972; Fitzpatrick and Pabst, Reference Fitzpatrick and Pabst1986; Griffin et al., Reference Griffin, Nilssen and Jensen1979; Kristiansen, Reference Kristiansen1993; Voloshin and Pakhomovskii, Reference Voloshin and Pakhomovskii1997; Minakawa et al., Reference Minakawa, Noto and Morioka1999; Kozireva et al., Reference Kozireva, Svecova and Popova2004; Gonzáles del Tánago et al., Reference Gonzáles del Tánago, La Iglesia and Delgado2006; Raade and Kristiansen, Reference Raade and Kristiansen2009; Stepanov et al., Reference Stepanov, Bekenova, Levin, Sokolova, Hawthorne and Dobrovol'skaya2012). Thalénite-(Y) was recently re-examined from different localities (Škoda et al., Reference Škoda, Plášil, Jonsson, Čopjaková, Langhof and Vašinová Galiová2015), including the type material, demonstrating that F dominates over OH. ‘Fluorthalénite-(Y)’ was thus redefined as thalénite-(Y) by the Commission on New Minerals, Nomenclature and Classification of the International Mineralogical Association (IMA 14-D, Williams, Reference Williams, Hatert, Pasero and Mills2014) as the F-dominant parent compound.
Thalénite-(Y) is part of the thortveitite group (thortveitite (Sc,Y)2Si2O7, rowlandite-(Y) Y4Fe(Si2O7)2F2 and yttrialite (Y,Th)2Si2O7)). It occurs as tabular to prismatic crystals of greasy lustre and biaxial (–) birefringence, with conchoidal fracture, hardness between 6 and 6.5 and specific gravity of ~4.2. It is monoclinic with space group P21/n with a ≈ 7.30, b ≈ 11.12, c ≈ 10.37 Å, β ≈ 97° and Z = 4. It is commonly metamict when enriched in actinides (Fitzpatrick and Pabst, Reference Fitzpatrick and Pabst1986).
Despite the range of studies from several localities (see Škoda et al., Reference Škoda, Plášil, Jonsson, Čopjaková, Langhof and Vašinová Galiová2015 and references therein), the question of the necessary geochemical environment for its formation is still poorly constrained for both primary magmatic thalénite-(Y), as well as its formation by replacement and alteration, possibly from britholite-(Y) (Minakawa et al., Reference Minakawa, Noto and Morioka1999). Thalénite-(Y) is generally rare, but where it occurs it is often abundant, and often associated with other REE minerals such as fergusonite (REE)NbO4, gadolinite (REE)2FeBe2Si2O10 and allanite-group minerals (Armbruster et al., Reference Armbruster, Bonazzi, Akasaka, Bermanec, Chopin, Gieré, Heuss-Assbichler, Liebscher, Menchetti, Pan and Pasero2006; Mills et al., Reference Mills, Hatert, Nickel and Ferraris2009; Bačík et al., 2017), as well as with zircon and magnetite. However, it remains an uncommon mineral, even in pegmatites of NYF affinity and high abundance of HREE and F, which suggests that other environmental factors besides P-T conditions and elevated REE and F control thalénite-(Y) crystallization.
The present study investigates the crystal chemistry of thalénite-(Y) from a new occurrence in the peralkaline granite of the Golden Horn batholith, North Cascade Mountains, Washington State, USA, with a focus on chemical composition and crystal structure. Results are compared with detailed analyses of thalénite-(Y) from the White Cloud pegmatite, South Platte District, Colorado, USA. To address the F and OH substitution we performed Raman spectroscopy for the identification of the crystal OH groups.
Occurrence and geological setting
Golden Horn thalénite-(Y)
The Golden Horn batholith is a shallow peralkaline granitic intrusion of Eocene age (47–50 Ma) (Misch, Reference Misch1966; Stull, Reference Stull1969; Boggs, Reference Boggs1984; Eddy et al., Reference Eddy, Bowring, Miller and Tepper2016). There are four phases of granite intrusions in the batholith: a peralkaline arfvedsonite granite, a less alkaline transitional ‘border granite’, and two different types of biotite granites (Boggs, Reference Boggs1984). The granites are unusually rich in REE minerals and rare Zr-bearing silicate minerals.
A wide range of rare REE minerals have been noted in small miarolitic cavities in the Golden Horn batholith, primarily REE-carbonates ‘bastnäsite' and ‘synchysite', allanite-(Ce), beta-fergusonite, calciohilairite, chevkinite, euxenite, gadolinite, gagarinite, kainosite, okanoganite and pyrochlore-group minerals (Becker, Reference Becker1991; Boggs, Reference Boggs1980, Reference Boggs1984, Reference Boggs1988). The thalénite-(Y) studied was found in a single small talus boulder in the centre west face of Kangaroo Ridge, south east of Washington Pass. Kangaroo Ridge, the likely source for this talus boulder, is composed predominantly of arfvedsonite granite with minor biotite granite.
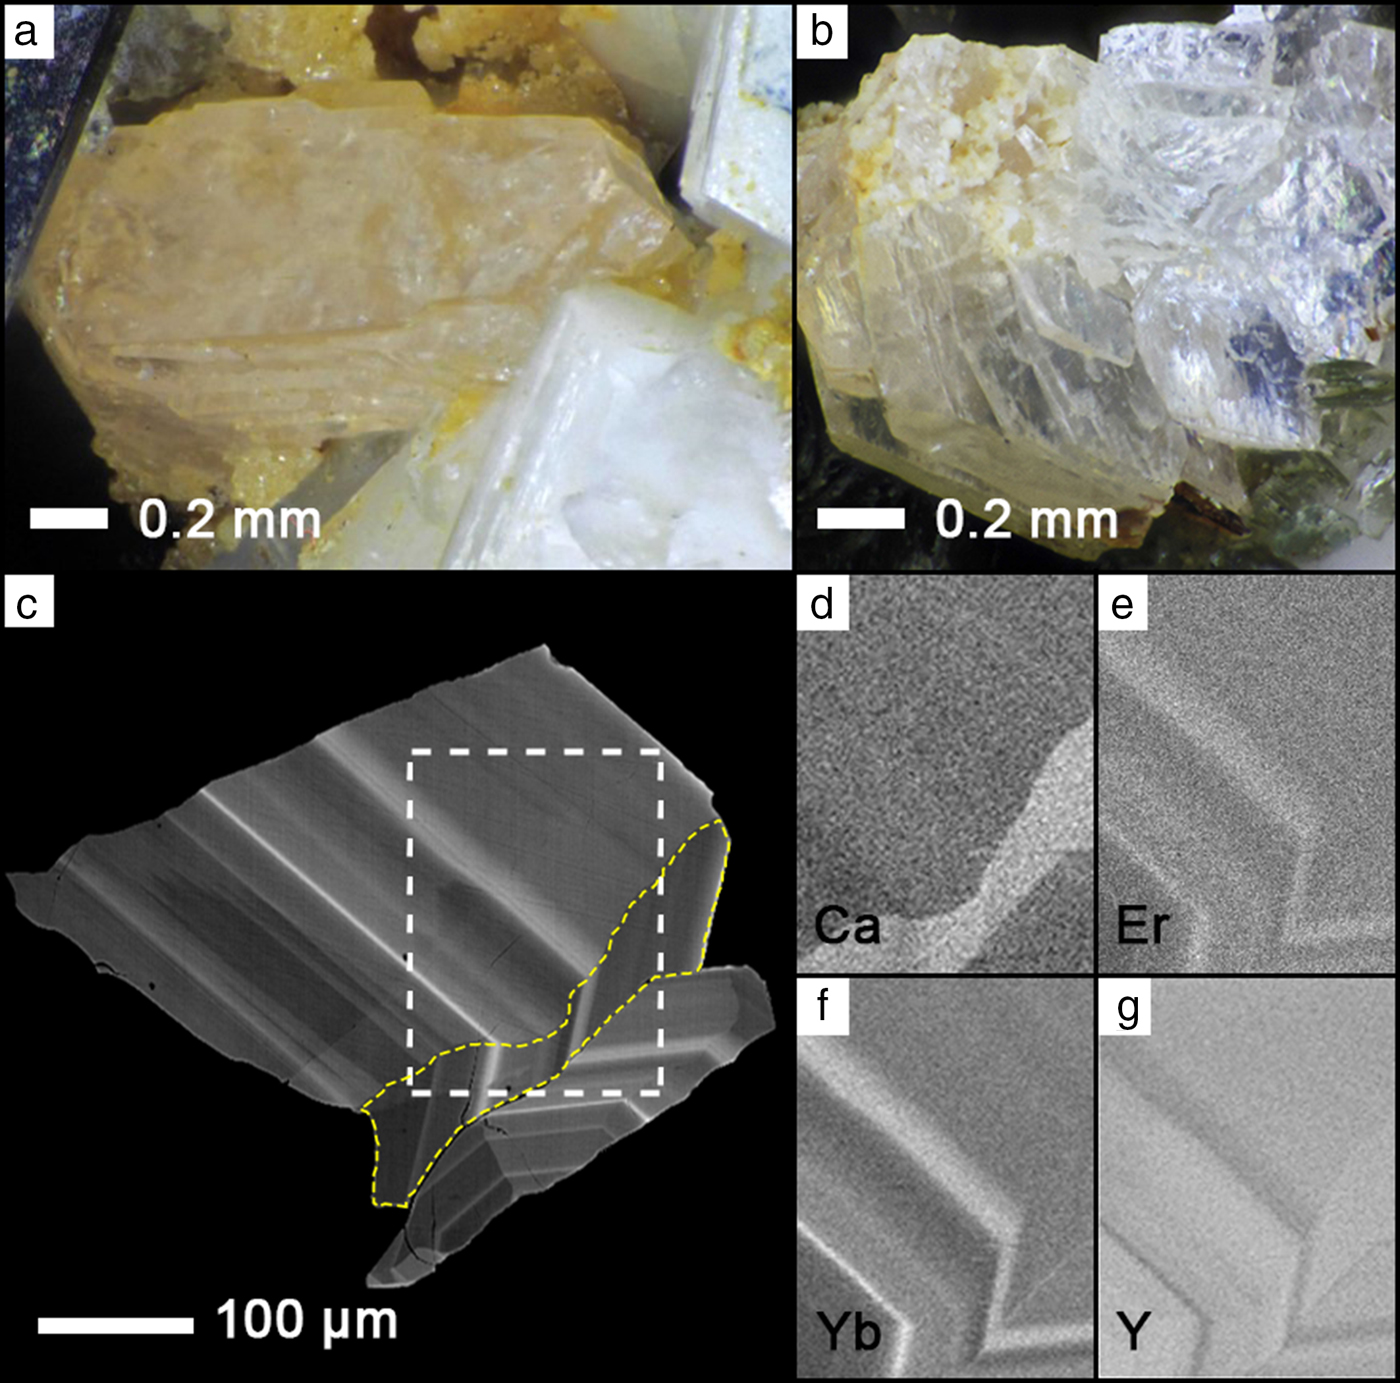
The thalénite-(Y)-bearing talus boulder is mostly medium-grained peralkaline arfvedsonite granite composed of white microcline, arfvedsonite, and minor annite and colourless quartz, with annite-bearing miarolitic cavities. When intersecting a cavity, arfvedsonite forms euhedral crystals. The miarolitic cavities are up to 2 cm in diameter, and contain uncommon thalénite-(Y) crystals up to ~2 mm in size which occur as clusters, or sometimes as smaller single crystals (Fig. 1a,c). Crystals are colourless to light pink, transparent to translucent, and have a bright lustre. They are associated with well-formed crystals of microcline, arfvedsonite, quartz, annite and rarely wulfenite, zircon, a pyrochlore-group mineral and REE carbonates. Late-stage annite is abundant in some of the cavities as colour zoned crystals ranging from colourless to brown and black.
(a,b) Thalénite-(Y) from miaorolitic cavities from the Golden Horn batholith, Washington, USA (photos courtesy of Rudy Tschernich). (c) Back-scatter electron (BSE) image of thalénite-(Y) with distinct oscillatory zoning. White dashed box corresponds to the element distribution maps of (d) CaKα, (e) ErLα, (f) YbLα and (g) YLα. The yellow dashed region in (c) highlights a region of unusually high Ca content visible in (d).

White Cloud thalénite-(Y)
Following the first description of thalénite-(Y) in Colorado at the Snowflake pegmatite in the South Platte NYF pegmatite district (Adams et al., Reference Adams, Hildebrand and Havens1962), thalénite-(Y) was described from the White Cloud pegmatite, situated ~10 km east of the village of Buffalo Creek (Adams and Sharp, Reference Adams and Sharp1972). The White Cloud pegmatite is an asymmetric elliptical body ~100 m × 40 m across, zoned, and geochemically complex. It is hosted in the northern part of the ~1.08 Ga A-type Pikes Peak batholith, within subsolidus two-feldspar quartz monzonite, in turn surrounded by one-feldspar hypersolvus granite (Haynes, Reference Haynes1965; Simmons and Heinrich, Reference Simmons and Heinrich1975; Simmons and Heinrich, Reference Simmons and Heinrich1980; Smith et al., Reference Smith, Noblett, Wobus, Unruh, Douglass, Beane, Davis, Goldman, Kay, Gustavson, Saltoun and Stewart1999; Frost and Frost, Reference Frost and Frost1997; Adams and Sharp, Reference Adams and Sharp1972).
The White Cloud pegmatite is mineralogically distinct from most known South Platte pegmatites, with a diversity of REE species, including REE silicates. It is a well-zoned body consisting of major quartz and perthitic alkali feldspar (locally albitized), with minor biotite, and fluorite of variable Y + REE content (Wayne, Reference Wayne1986). The REE minerals include allanite-(Ce), gadolinite-(Y), fergusonite-(Y) and REE-rich zircon (var. cyrtolite), most of which occur with fluorite in discrete zones in the pegmatite (Haynes, Reference Haynes1965; Wayne, Reference Wayne1986). Haynes (Reference Haynes1965) and Wayne (Reference Wayne1986) suggested two hydrothermal alteration episodes in the White Cloud pegmatite. First, gadolinite is replaced by Y-rich fluorite, REE-carbonates and fluocerite-(Ce), and perthitic alkali feldspar is replaced by albite. Second, biotite is altered into Fe-oxide and clay minerals. Thalénite-(Y) occurs both as intergrowths with yttrofluorite, as well as associated with quartz and feldspar (Adams and Sharp, Reference Adams and Sharp1972). The texture varies from dense, dull-grey decimetre-sized aggregates of nodular texture associated with Y-rich fluorite, gadolinite, ‘bastnäsite', ‘synchysite', ‘allanite', thorite and zircon, to areas in which irregular textured Y-rich fluorite is associated with the aforementioned REE minerals with minor blebs and veinlets of thalénite-(Y) (Adams and Sharp, Reference Adams and Sharp1972; Wayne, Reference Wayne1986). Thalénite-(Y)-bearing samples were collected from three in situ locations in the northwest wall of the pegmatite quarry. It occurs in pods in the quartz-perthite-fluorite zone, immediately adjacent to the quartz-microcline core zone.
Petrographic analysis revealed two types of thalénite-(Y): large anhedral grains up to a millimetre in size, or finely-distributed swarms with a grain size of tens of micrometres, intergrown with the Y-rich fluorite. Both types are pink to colourless with first-order birefringence.
Material and analytical methods
Electron microprobe (EMP) analysis and WDS X-ray element mapping of thalénite-(Y) were performed primarily on a JEOL JXA-8600 instrument of four individual grains from the Golden Horn batholith and in two thin sections WC01 and WC02 from the White Cloud pegmatite (for details of analytical conditions see Supplementary material).
Four individual grain mounts of crystal fragments from the Golden Horn thalénite-(Y) were analysed, with 36 analyses in grain 1 (Fig. 1c), 22 from grain 2, 12 from grain 3 and 5 from grain 4. Sixty-six analyses were performed in the two White Cloud thin sections WC01 and WC02, with representative areas and locations indicated in Figs 2 and 3.
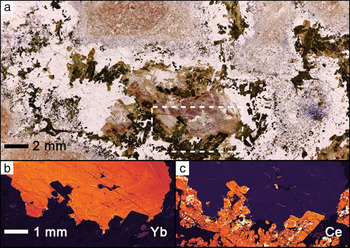
(a) White Cloud thalénite-(Y) rock thin section (plane-polarized light), with gadolinite (green), allanite-(Ce) (black fluorite (colourless) and thalénite-(Y) (pink). The area of the dashed box is shown in the YbLα distribution map (b) highlighting the anhedral mostly homogenous thalénite-(Y) crystal with high YbLα values shown in orange. The CeLα distribution map (c) emphasizes adjacent gadolinite in brownish-green and allanite-(Ce) in darker black in (a).

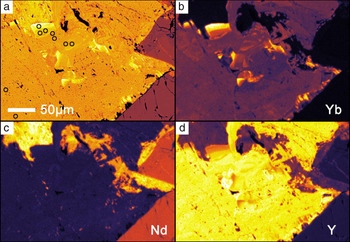
BSE and false-colour elemental maps showing anhedral and heterogeneous thalénite-(Y) from White Cloud. (a) BSE image, (b) YbLα, (c) NdLα and (d) YLα. Allanite is seen in the bottom right with gadolinite in the top left. Dark open circles in (a) are selected points for analysis as shown in Table 2. Notice the Yb-enrichment in (b).

Following the microprobe analysis five grains were extracted from selected sample areas for subsequent correlative X-ray diffraction (XRD) analysis: Golden Horn crystal fragment GH-01 from grain 1; crystallites WC-G5, WC-X5 and WC-X7 drilled from thin sections WC02 in or near regions analysed by EMP; and a sample from Hundholmen, Tysfjord, Norway (RS104), previously analysed by EMP in Škoda et al. (Reference Škoda, Plášil, Jonsson, Čopjaková, Langhof and Vašinová Galiová2015). Due to minor inconsistencies with high Si and low REE content on the JEOL JXA-8600, control analyses were performed on a new JEOL JXA-8230 instrument on selected samples that became available only after the XRD sample extraction (see Supplementary material).
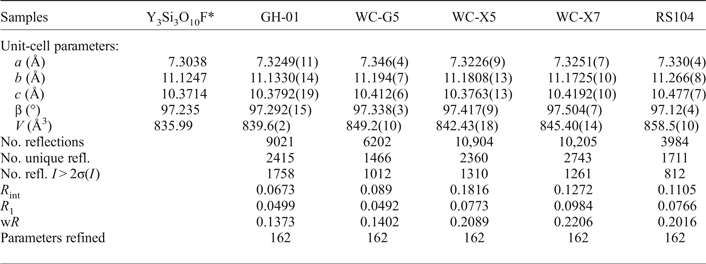
Single-crystal XRD was performed on a Bruker P4 four circle diffractometer equipped with a point detector, an APEX II CCD detector, and a rotating Mo-anode generator operating at 50 kV and 250 mA with a graphite monochromator. Unit-cell parameters were refined from centring angles for 30 strong reflections with 10° < 2θ < 30° each in both positive and negative 2θ regions using the point-detector. For intensity data, the maximum 2θ angle was 70°. Single-crystal XRD data were measured using the CCD detector, and data collection parameters are listed in Table 1.
Crystal structure refinement data for thalénite-(Y).

*Schleid and Müller-Bunz (Reference Schleid and Müller-Bunz1998)
Micro-Raman spectroscopy on polished sections was performed on an upright microscope (Olympus BH51), with 632 nm HeNe laser excitation at 1 mW, 50x objective of NA = 0.8, imaging spectrograph (Princeton Instruments spectrometer Acton SP500, with PIXIS 100 liquid nitrogen cooled CCD camera, calibrated on multiple spectral lines using an He-lamp).
Results
Chemical composition
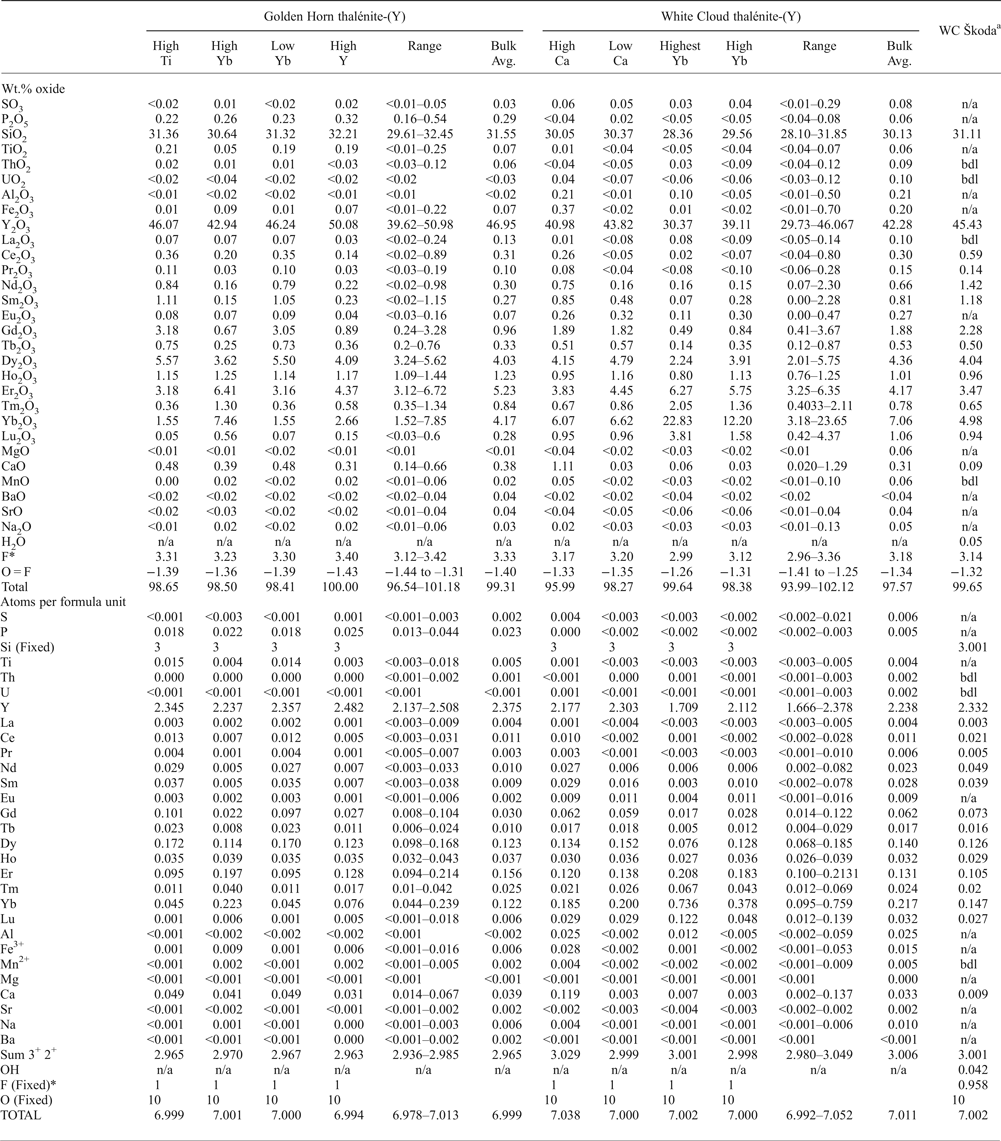
Quantitative EMP analyses of thalénite-(Y) are summarized in Table 2, and complemented by X-ray element mapping shown in Figs 1 to 3. Back-scattered electron images show pronounced oscillatory zoning for the Golden Horn thalénite-(Y) (Fig. 1c), which correlates with an increase in Yb and Er, and a decrease in Y (Fig. 1d–g; Table 2). In addition, a distinct Ca-rich domain is observed (Fig. 1d). In contrast, element mapping in thalénite-(Y) from the White Cloud shows large areas of relatively homogeneous euhedral thalénite-(Y) crystals with minor variation in content of Y and heavy REE (HREE: Tb to Lu) (Fig. 2b, Table 2), alternate with regions of a botryoidal phase. Locally, along the rim of some large grains, a distinct enrichment in the heaviest REE is observed (Er to Lu; Fig 3a,b).
Representative averages of EMP analyses for Golden Horn and White Cloud as well as data from White Cloud (WC) by Škoda et al. (Reference Škoda, Plášil, Jonsson, Čopjaková, Langhof and Vašinová Galiová2015). Atomic proportions are calculated assuming a total of 10 oxygens, a fixed Si content of 3 and a fixed F of 1 (apfu).

*Škoda data does not reflect fixed F = 1
The columns in Table 2, ‘High Ti’, ‘High Yb’, ‘Low Yb’ and ‘High Y’ correspond to different zones highlighting distinct zonal composition in the Golden Horn thalénites as observed in the different crystal grains 1 to 4. For example: ‘High Yb’ corresponds to similar regions observed in grains 1, 2 and 4; ‘High Ti’ was a region observed in grain 3; ‘Low Yb’ was found in grains 3 and 4; and ‘High Y’ in grains 1 and 4. The columns for the White Cloud thalénites highlight zonal compositions observed in regions across the two thin sections WC01 and WC02. ‘High Ca’ was found in WC02 while ‘Low Ca’ was found in regions WC01-B2, WC01-B3M2, WC01-B3 and WC02. Both ‘Highest Yb’ and ‘High Yb’ are from region WC01-B3M2.
The mineral formulae in Table 2 are recalculated assuming a total of 10 oxygen, 3 silicon and 1 OH group, with wt.% of F reduced to full F-site occupancy (1 apfu, see Supplementary material for further details). The different columns highlight particular chemical compositions corresponding to averages of analyses of individual, or several, crystal regions of similar composition.
All thalénite-(Y) analysed are dominated by Y (1.67–2.51 apfu) and HREE (0.38–1.28 apfu Tb–Lu), with ~60.5–70.2 wt.% total REE 2O3. Significant CaO is present in all samples, ranging from 0.14 to 0.66 wt.% CaO in Golden Horn and 0.02 to 1.28 wt.% CaO for White Cloud. In the Golden Horn thalénite, a local band of elevated Ca (~0.6 wt.% CaO) is identified (Fig. 1d). TiO2 (<0.01 to 0.25 wt.%) and P2O5 (0.16 to 0.54 wt.%) in Golden Horn are inhomogeneously present. Aluminium is below the detection limit (<0.02 wt.% Al2O3) for Golden Horn thalénite, and present in a small amount, up to 0.50 wt.% in few analyses from White Cloud thalénite-(Y). Only traces of Mn (up to ~0.10 wt.%), Na (up to ~0.13 wt.%) and S (up to ~0.29 wt.%) are identified in both localities, and no significant U, Th, or Mg are detected.
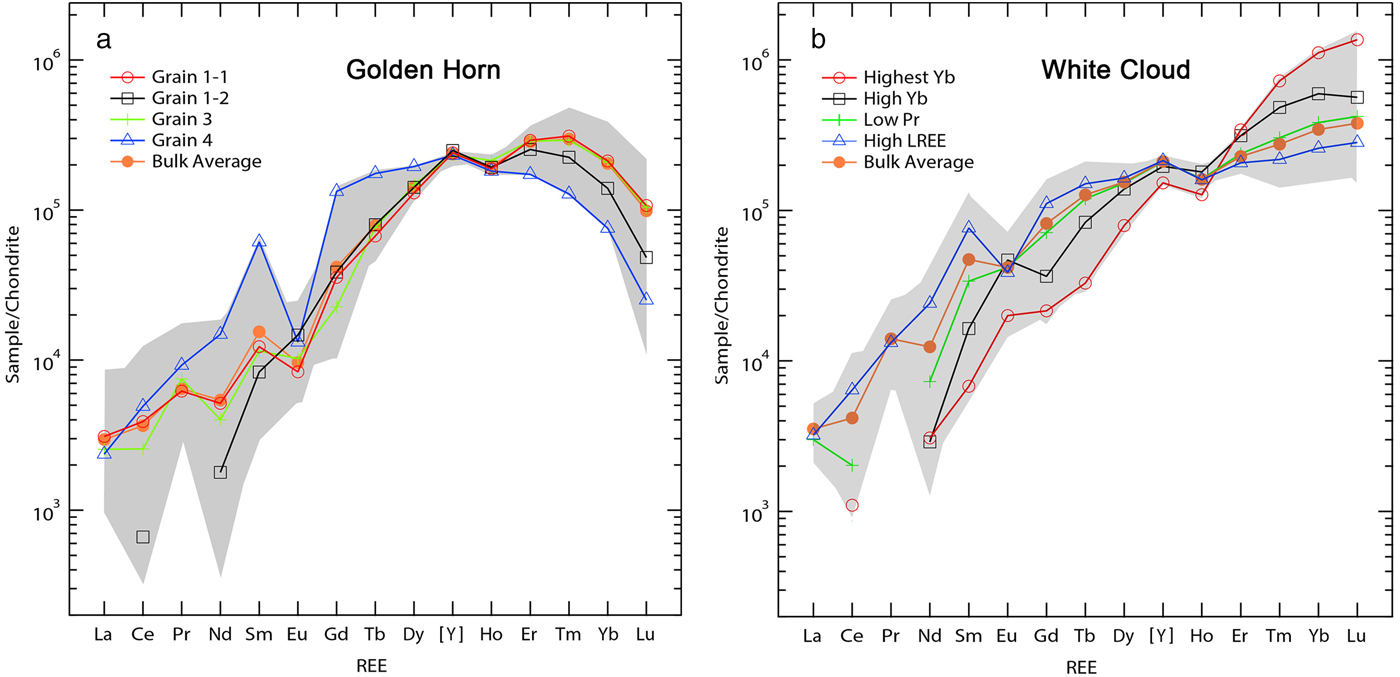
The chemical zonation of Golden Horn thalénite-(Y) reflect the changes in REE distribution following the substitution vector HREE 1Y–1 (Fig. 1c, e–g). HREE-rich and Y-poor domains in the White Cloud thalénite-(Y) are also depleted in light-REE (LREE; La to Gd) and follows a similar substitution vector HREE 1LREE –1. The chondrite-normalized REE pattern as shown in Fig. 4 exhibits similar trends in comparison to previous observations (Škoda et al., Reference Škoda, Plášil, Jonsson, Čopjaková, Langhof and Vašinová Galiová2015; Voloshin and Pakkomovskii, Reference Voloshin and Pakhomovskii1997). The preference of the thalénite-(Y) structure for the smaller HREE cations gives rise to the continuous enrichment of the HREE as seen in the White Cloud thalénite-(Y). In contrast, a depletion for the heaviest REE is found for the Golden Horn thalénite-(Y). The near absence of an Eu-anomaly in the White Cloud thalénite-(Y) is notable, an observation which differs from the pronounced negative Eu-anomaly in the analyses by Wayne (Reference Wayne1986).
(a) Chondrite-normalized REE distribution for Golden Horn thalénite-(Y) analyses with a characteristic depletion of the heaviest HREE (Tm to Lu). Two distinct patterns were found in grain 1, one with high levels of HREE (grain 1-1) and one with low LREE (grain 1-2). The average for grain 2 is very close to that of the bulk average and has been omitted. The bulk average values correspond to those found in Table 2. (b) Chondrite normalization for White Cloud thalénite-(Y), with ‘Highest Yb’ and ‘High Yb’ as shown in Table 2, and ‘Low Pr’ and ‘High LREE’ from selected analyses on different sample regions. The anomalously high and highest Yb content is in very localized regions of secondary thalénite-(Y) only (see Fig. 3b,d). Note the HREE to middle REE and LREE anti-correlation.

Associated with this trend is a well-developed M-type tetrad effect as can be seen for both localities, specifically the first tetrad for grain 4, and the third tetrad consistently for all analyses. A well-developed fourth tetrad is seen only for the Yb-rich regions in the White Cloud thalénite, yet throughout for the Golden Horn thalénite-(Y).
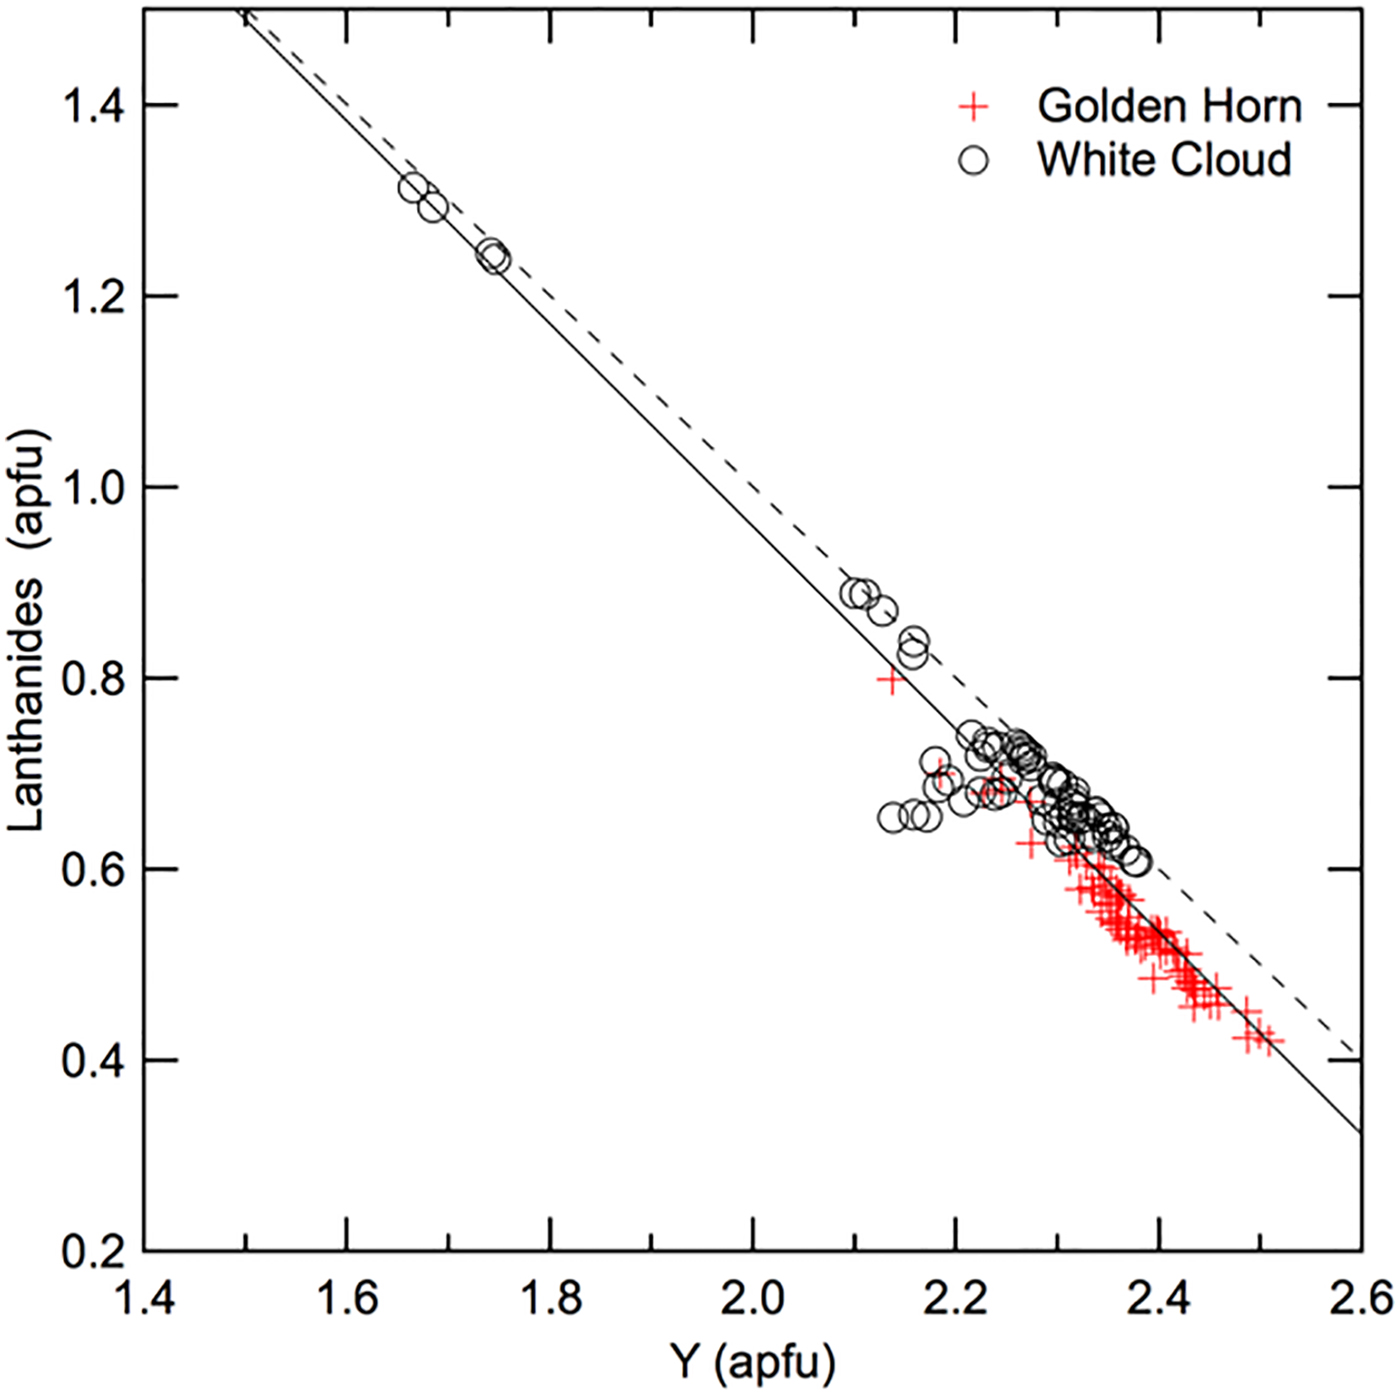
To highlight the substitution of lanthanides (Ln: La to Lu) for Y, Fig. 5 shows the sum of Ln plotted vs. Y for all analyses for Golden Horn and White Cloud thalénite-(Y). The slight deviation from the ideal slope of 1 could be due to a combination of EMP analytical uncertainties, vacancies, missing elements, and other possibly coupled substitutions, yet no such obvious cause could be identified.
Sum of Ln vs. Y (both apfu) for all Golden Horn and White Cloud thalénite-(Y) analyses. The dashed line marks the expected slope of –1 representing a 1:1 ideal substitution, in comparison to the solid fit line with slope m = –1.1 and R2 = 0.93.

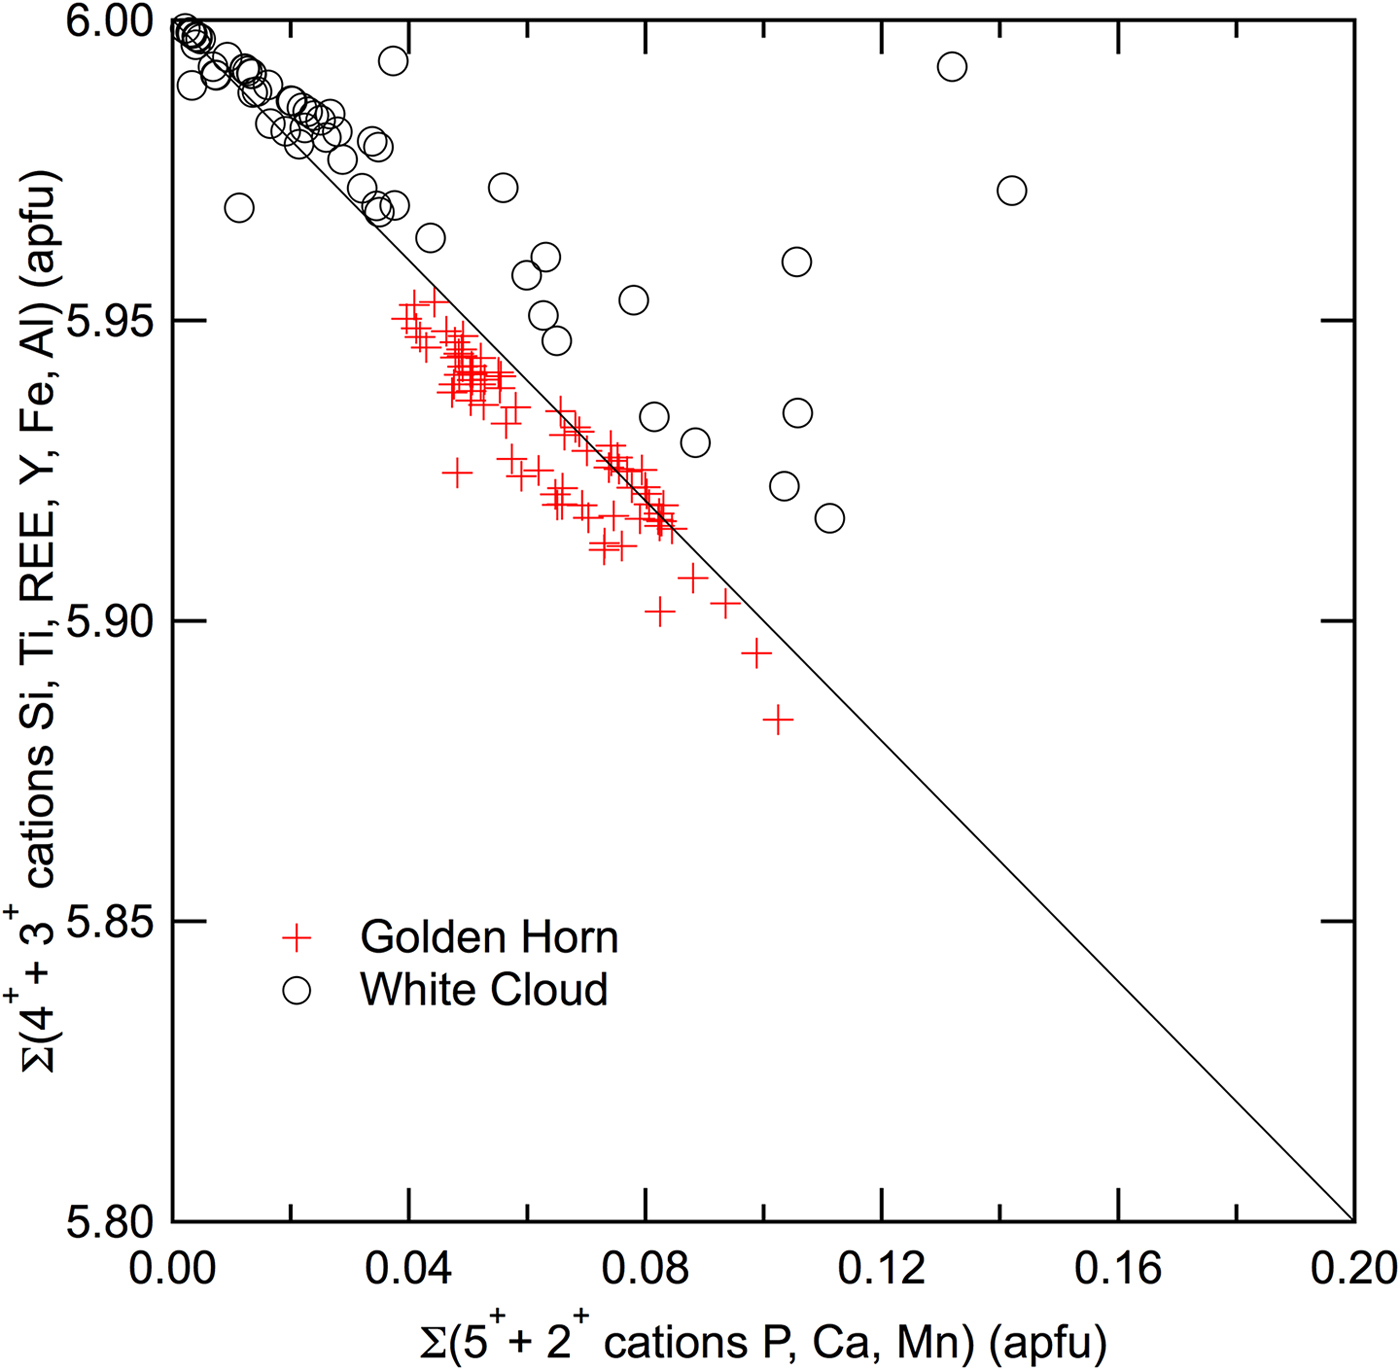
Similarly to other REE-silicates and phosphates, a substitution of Si with P is possible and would explain the entry of Ca in the thalénite-(Y) structure through the exchange vector REE –1Si–1P1Ca1. While no clear correlation between Ca and P has been found, a slight anti-correlation in Fig. 6 between the sum of 3+ and 4+ cations (Si, Ti, REE, Al and Fe) vs. sum of 2+ and 5+ cations (P, Ca and Mn), suggests an M 2+–1T 5+–1M 3+1T 4+1 exchange vector. Additional analyses in thalénite-(Y) of higher P-content would be required to confirm this trend.
Sum of 3+ and 4+ cations (Si, Ti, REE, Al and Fe) versus 2+ and 5+ cations (P, Ca and Mn) for all Golden Horn and White Cloud thalénite-(Y) analyses. The solid line of slope –1 shows the theoretical anti-correlation for coupled substitution exchange vector as discussed in text.

Crystallography and structure refinement
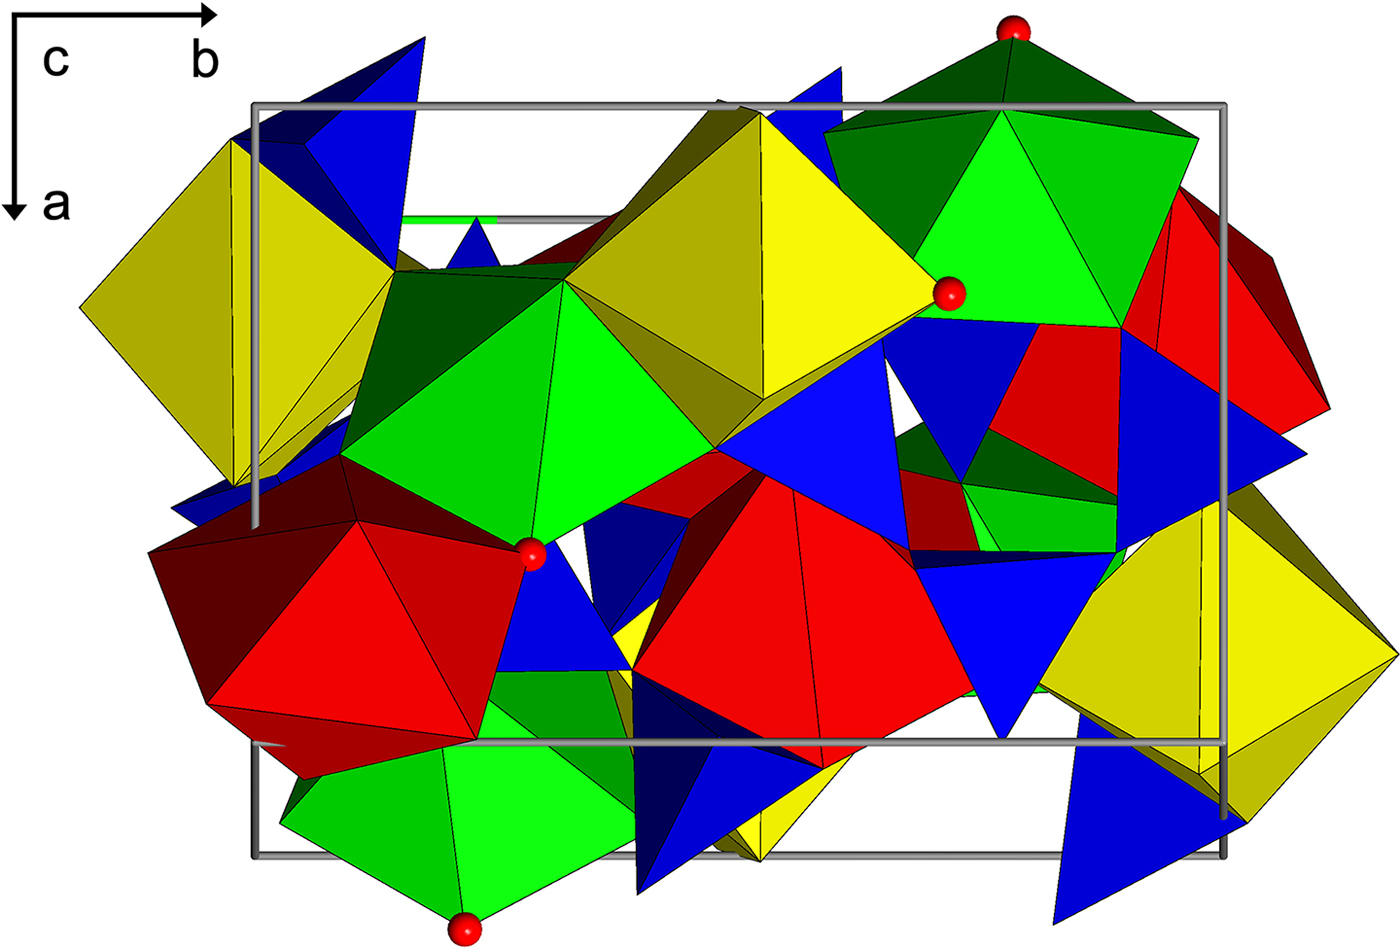
Thalénite-(Y) is a sorosilicate composed of Si3O10 groups, with cations in [7] coordination, or with Y1 in [7 + 1] coordination if the longer Y1–O4 is considered. The structure is monoclinic, P21/n, with all atoms in general positions and four of each per unit cell. The crystal structure (Fig. 7) has three trivalent REE 3+ cation sites Y1, Y2 and Y3, which are each coordinated to six oxygen and one F– ion. The resulting [FY3]8+ structural element is nearly trigonal-planar. Three SiO4 groups are connected on edge to form a trisilicate anion [Si3O10]8– (Kornev et al., Reference Kornev, Batalieva, Maksimov, Ilyukhin and Belov1972; Yakubovich et al., Reference Yakubovich, Voloshin, Pakhomovskii and Simonov1988; Schleid and Müller-Bunz, Reference Schleid and Müller-Bunz1998). The REE 3+ are then coordinated in a chelate-like fashion by the trisilicate arch via 6 + 1 (Y1) and 6 (Y2 and Y3) oxygen. Of the ten oxygen atom positions, eight are bonded to one Si, and two, O4 and O7, are bridging oxygen atoms. The other oxygen atoms each bond to two Y sites and one Si. There are no Si–F bonds, consistent with ionic bonding. Fluorine is bonded only to the REE atoms with one bond to each of the three Y positions. Schleid and Müller-Bunz (Reference Schleid and Müller-Bunz1998) refined the crystal structure of a pure Y3Si3O10F, the synthetic equivalent to thalénite-(Y), which provides the site geometries of a pure synthetic end-member with which to compare the site geometries of our natural samples. In addition, Müller-Bunz and Schleid (Reference Müller-Bunz and Schleid2000) also report the structure refinements for synthetic Dy3Si3O10F, Ho3Si3O10F and Er3Si3O10F.
The crystal structure of thalénite-(Y) (a vertical; b horizontal) showing the Si3O10 trimers (blue) and the seven-coordinated Y sites, Y1 (green), Y2 (yellow) and Y3 (red). Each of the Y sites are similar in coordination and polyhedral volume and is bonded to six oxygen atoms and one fluorine (red sphere). The Y2 site appears to incorporate significantly more lanthanoid (La–Lu) cations than the other two, consistent with its deeper electrostatic potential calculated for pure Y3Si3O10F.

Unit-cell parameters were refined from the full intensity data set and corrected to a standard anhydrous quartz crystal (Angel et al., Reference Angel, Ross, Wood and Woods1992). Unit-cell parameters and XRD data set parameters are given in Table 1. The Golden Horn sample had a noticeably smaller unit-cell volume than that of the White Cloud samples, closer to the ideal value of 836 Å3 (Schleid and Müller-Bunz, Reference Schleid and Müller-Bunz1998).
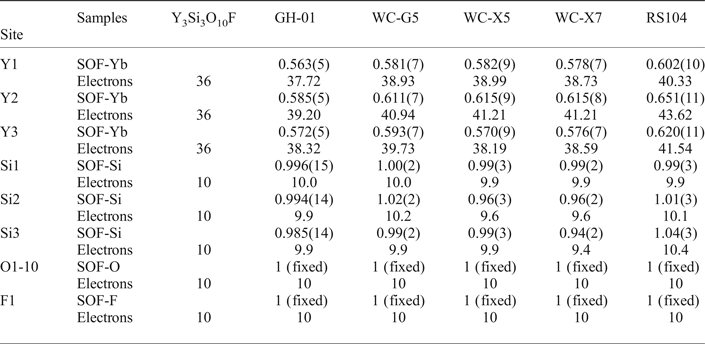
The crystal structures of the five crystals were refined from single-crystal XRD data sets. For the refinements of atom positions, anisotropic displacement parameters and site occupancies the program SHELXL-2016 (Sheldrick, Reference Sheldrick2008) was used, with ionic scattering factors for Si4+ and F– (Cromer and Mann, Reference Cromer and Mann1968). The ionic scattering factor for O2– was that of Azavant and Lichanot (Reference Azavant and Lichanot1993). The Y-site occupancies were refined using an ionic Yb3+ scattering factor (Cromer and Mann, Reference Cromer and Mann1968) and the number of electrons determined by multiplying the refined occupancy by 67. For comparison we have a fixed 66.67% Y-site occupancy in the three Y-sites and let the remainder of the Y-site occupancy refine using Yb3+. We obtain slightly improved R-factors in each case, but the differences are only marginally significant to insignificant. We refined for Si4+ because of the possibility of Be substitution, considering the significant presence of gadolinite in the White Cloud pegmatite, and in crystals in which we observe Si–Be disorder. The Si occupancy converges stably to full site occupancy. The resulting occupancy parameters are given in Table 3. Final refinement position and occupancy parameters are given in Supplementary Table S4.
Occupancies for thalénite-(Y) using ionic scattering factors.

SOF – site occupancy factor
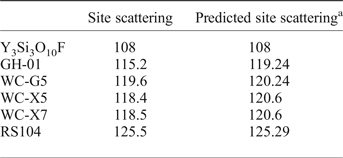
The relationship of the resulting site-scattering sum for Y1, Y2 and Y3 for all five samples, compared to the predicted site scattering from the EMP analyses determined from same locations is shown in Table 4 with weighted spatial compositional average considering zoning and heterogeneities extrapolated. A good agreement is seen within the uncertainly of ca. ±1 electron per REE site from XRD, and 1–2% electrons pfu uncertainty from EMP.
Y-site (Y1, Y2 and Y3) scattering from XRD and predicted site scattering (in electrons pfu) based on EMP analyses.

a Predicted site scattering for GH-01, WC-G5 and RS104 are from the bulk averages given in Table 2. Predictions for WC-X5 and WC-X7 were generated from select EMP analytical points which were taken in the same area where the crystals for XRD were extracted.
Raman spectroscopy
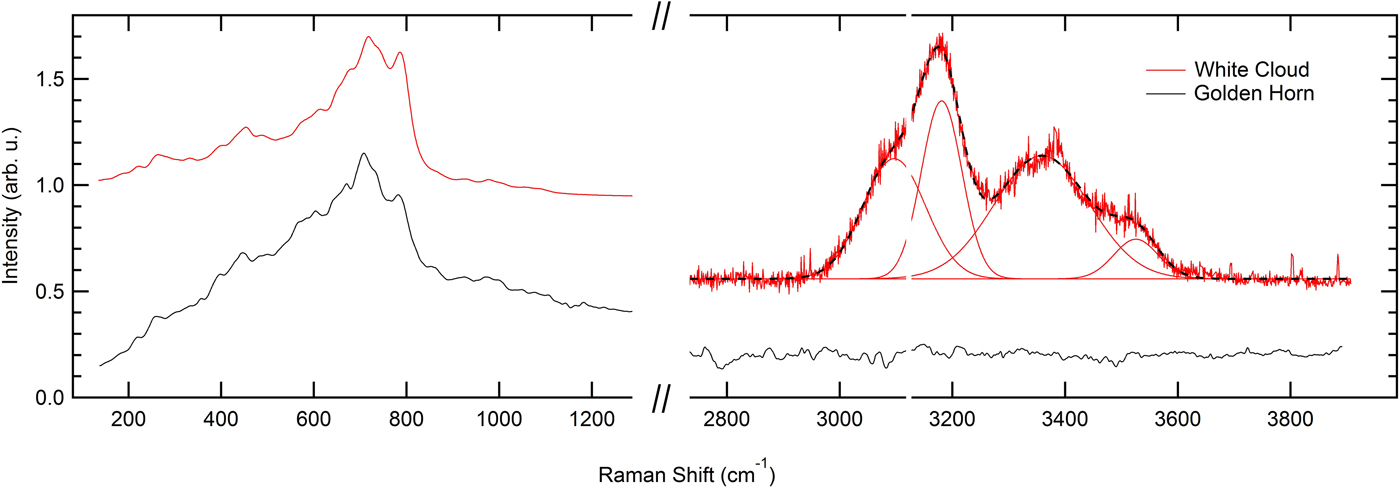
The representative Raman spectra of thalénite-(Y) for both localities for 632 nm excitation is shown in Fig. 8. Raman spectra were also acquired at 532 nm excitation; when plotting both the 532 nm and 632 nm spectral intensity vs. Raman shift, the primary peaks (200–1200 cm−1) overlapped. This overlap is indicative of fluorescence as opposed to Raman emission with notable similarity for the material from both localities. In contrast, the emission in the 3000–3600 cm–1 region can be assigned to OH-stretch Raman emission. Distinct water modes are observed in all White Cloud samples investigated. No OH or H2O vibrational mode is seen in the Golden Horn thalénite-(Y). No fluid inclusions could be identified, and the Raman spectra are reproducible across extended sample regions without any significant spectral variations. The water spectra are fit by four Gaussians with 3097, 3181, 3359 and 3526 cm–1 centre frequencies. The dominant peak centred around 3181 cm–1 is indicative of hexagonal water ice, while weaker but still strong peaks at 3359 and 3526 cm–1 indicate liquid H2O. This suggests a superposition of a liquid and an ice-like feature, possibly in spatially nano-confined regions (Đuričković et al., Reference Đuričković, Claverie, Bourson, Marchettic, Chassot and Fontana2011; Sun and Zheng, Reference Sun and Zheng2009).
Raman spectra for the Golden Horn and White Cloud thalénite-(Y) for 632 nm excitation, with an absence of OH and water in the Golden Horn thalénite-(Y), but the distinct presence of ice- and liquid-like water in White Cloud thalénite-(Y).

Discussion
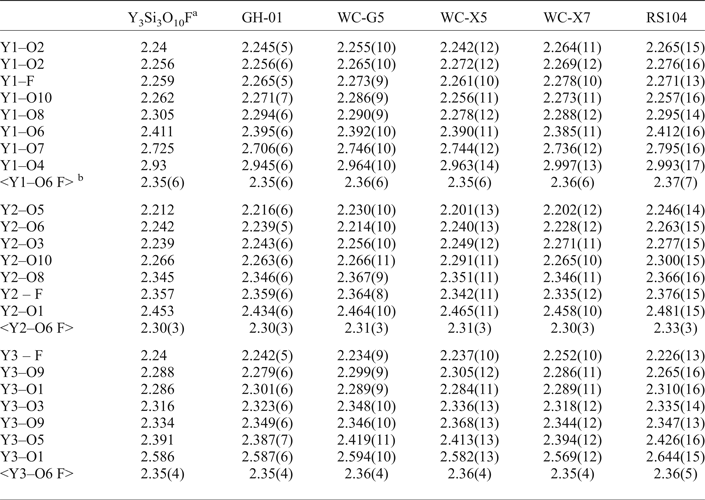
Of the three REE sites, only Y1 has bonds to the bridging oxygens, O4 and O7. Y1 has one long bond to the bridging oxygen O7 at > 2.7 Å as well as a very long bond to O4 at > 2.9 Å, whereas all other Y–O and Y–F bonds are between 2.2 and 2.6 Å, see Table 5 for select Y-site bond distances. From the distribution of electron densities in our natural thalénites-(Y) we conclude that the REE are ordered among the three Y-sites with the Ln cations showing a consistent enrichment at Y2 over Y1 and Y3. This is consistent with the shorter Y2–O and Y2–F bonds and associated smaller site volume giving preference for the occupation with smaller HREE compared to the occupation of the larger Y1 and Y3 sites with lighter and larger REE. We calculated the electrostatic potentials for the various cation and anions sites in the structure using the structure data reported by Schleid and Müller-Bunz (Reference Schleid and Müller-Bunz1998) (Supplementary Table S3). We used the Bertaut method code ELEN described by Smyth (Reference Smyth1988). Electrostatic potentials thus calculated are 30.8 V, 31.5 V and 29.7 V, for the Y1, Y2 and Y3 sites, respectively. The associated observed enrichment of HREE in the Y2 site is consistent with enrichment of heavier oxygen isotopes at sites of deeper electrostatic potentials (Smyth, Reference Smyth1988; Smyth and Clayton, Reference Smyth and Clayton1988).
Selected bond distances (Å) and averages for the three Y sites.

a Schleid and Müller-Bunz (Reference Schleid and Müller-Bunz1998)
b The ~3.00 Å values of Y1–O4 were omitted from the averages for better comparison to Y2 and Y3.
With regards to chemical composition, Ca and Al were historically reported at 2 wt.% oxide in White Cloud thalénite-(Y) analyses by Adams and Sharp (Reference Adams and Sharp1972) and Adams et al. (Reference Adams, Hildebrand and Havens1962). However, these high values are possibly due to impurities and inclusions of Ca and Al-bearing minerals, e.g. allanite-(Ce) and fluorite. More recent work of Wayne (Reference Wayne1986) and Škoda et al. (Reference Škoda, Plášil, Jonsson, Čopjaková, Langhof and Vašinová Galiová2015) only detect traces of Ca and no Al in thalénite-(Y). This, together with our analyses suggests that Ca can be accommodated intrinsically into thalénite-(Y) to some extent by minor substitution for Y (as for ‘yttrofluorite’), yet the minor presence of Al is more likely to be due to inclusions of other minerals.
Thalénite-(Y) is a primary magmatic mineral in many pegmatitic occurrences (e.g. Österby, Åskagen, Reunavare and Guy Hazel Claim, etc.) but it is prone to late-stage hydrothermal alteration and is often replaced by a second generation of thalénite-(Y), iimoriite-(Y), allanite-(Ce) and other REE minerals (Škoda et al., Reference Škoda, Plášil, Jonsson, Čopjaková, Langhof and Vašinová Galiová2015). The origin of thalénite-(Y) associated with Y-rich fluorite might be uncertain. While previous work (Haynes, Reference Haynes1965; Adams and Sharp, Reference Adams and Sharp1972; Simmons and Heinrich Reference Simmons and Heinrich1980) described the occurrence of thalénite-(Y) and other REE minerals at the White Cloud as being in ‘replacement zones’, recent advances in understanding of pegmatite petrogenesis and new field work suggest that these zones rather represent a combination of late-magmatic and hydrothermal processes in which the magmatic crystallization sequence concentrates F, OH and REE into a low-viscosity F-rich fluid from which fluorite and REE minerals precipitate (Veksler et al., Reference Veksler, Dorfman, Kamenetsky, Dulski and Dingwell2005; Peretyazhko and Savina, Reference Peretyazhko and Savina2010). In the final stages of crystallization from this F-rich fluid, fluorite and primary REE minerals such as gadolinite-(Y), allanite-(Ce), fergusonite-(Y), zircon and possibly thalénite-(Y) form. Later, possibly hydrothermal REE mineralization is characterized by replacement of primary fluorite by Y-rich fluorite, synchysite-(Y), thalénite-(Y) and fluocerite-(Ce), as well as replacement of gadolinite-(Y) by bastnäsite-(Ce), and Fe-oxide and clay replacement of biotite (Haynes Reference Haynes1965; Wayne Reference Wayne1986).
Adams and Sharp (Reference Adams and Sharp1972) proposed that thalénite-(Y) in the White Cloud pegmatite could have formed due to an increase in SiO2 and CO2 during the hydrothermal stage, leading to the replacement of pre-existing HREE and Y-enriched fluorite by thalénite-(Y) and synchysite-(Y). They suggest that this hydrothermal fluid lacked PO4 and did not crystallize multiple oxide REE phases (e.g. samarskite or euxenite), which might otherwise accommodate HREE and Y. Wayne (Reference Wayne1986) suggested HREE, complexed with F, was partitioned into the final REE minerals to crystallize, and in some cases replace earlier REE minerals, such as gadolinite-(Y) and Y-bearing fluorite, so called ‘yttrofluorite’. Wayne (Reference Wayne1986) also suggested, on the basis of textural evidence, that thalénite-(Y) precipitated simultaneously with highly HREE and Y-enriched fluorite from the same residual fluid. At the White Cloud pegmatite, primary REE silicates gadolinites (both Ce and Y-dominant) and thalénite-(Y) are HREE and Y-enriched, and relatively depleted in Ce and La, which instead resides in lesser amounts of REE carbonates and fluorocarbonates such as synchysite-(Y) and bastnäsite-(Ce) (Wayne, Reference Wayne1986). However, the most abundant REE silicate, allanite-(Ce), is LREE-enriched, so the proposal by Wayne (Reference Wayne1986) that thalénite-(Y) crystallization was triggered by depletion of the HREE-enriched late-stage fluid in Be, ending gadolinite crystallization, seems more plausible. However, the differences in Eu-anomalies between Wayne (Reference Wayne1986) and our analyses, the heterogeneities of thalénite-(Y) composition at different scales, and the range of different REE mineral assemblages distributed widely across the pegmatite suggest multiple generations of thalénite-(Y), probably ranging from late-magmatic to hydrothermal to late fluid-driven alteration with attendant localized REE remobilization. The subtle tetrad effect, most pronounced in the Yb-rich thalénite-(Y) zones, supports different generations of late-stage fractionation from a hydrothermal F-rich fluid.
In contrast, the distinct oscillatory zoning of HREE in thalénite-(Y) from Golden Horn, a consistent tetrad effect, and its association with other late-stage minerals (annite, wulfenite, zircon, ‘pyrochlore’ and REE carbonates), supports the interpretation of a single late-stage hydrothermal process in the relatively closed-system environment of a miarolitic cavity with limited REE, Ca, P and F availability. The depletion of heaviest HREE as seen in the Golden Horn thalénite-(Y) is similar to observations for second generation of thalénite-(Y) from Österby (Škoda et al., Reference Škoda, Plášil, Jonsson, Čopjaková, Langhof and Vašinová Galiová2015), which were formed from primary magmatic thalénite-(Y) during hydrothermal alteration by a dissolution and in situ reprecipitation process as suggested by Putnis and Putnis (Reference Putnis and Putnis2007). Taking into account the hydrothermal origin, the absence of OH in the Golden Horn thalénite-(Y) is interesting and suggests crystallization from an F-bearing fluid. Experimental attempts of hydrothermal synthesis of Y-silicates from a F-absent environment only resulted in keiviite- or yttrialite-like Y2Si2O7 (Fitzpatrick and Pabst, Reference Fitzpatrick and Pabst1986; Becerro et al., Reference Becerro, Naranjo, Perdigón and Trillo2003). Our work, however, does not allow for the definite resolution of the question of the range of conditions of thalénite-(Y) formation. A more detailed petrological investigation of the full mineral assemblage and crystallization sequence together with analysis of the other REE minerals across the White Cloud pegmatite or Golden Horn miaoloitic cavities would be required to draw further conclusions regarding the petrogenesis of thalénite-(Y) at both localities.
Acknowledgements
We thank the reviewers Ritsuro Miyawaki and Peter Leverett for insightful suggestions about the manuscript. We are indebted to Mark Jacobson for sharing invaluable information about the pegmatites of the South Platte district. William (Skip) Simmons, Sarah Hanson, Dave London and Chuck Stern are acknowledged for helpful discussions about pegmatite mineralogy and petrogenesis. We acknowledge funding from NSF EAR-1427626 and the University of Colorado Boulder for acquisition of the JEOL JXA-8230 microprobe.
Supplementary material
To view Supplementary material for this article, please visit https://doi.org/10.1180/minmag.2017.081.044