

Introduction
Schistocerca gregaria (Forskål, 1775) (Orthoptera: Acrididae) is characterized by a pronounced ability to transform reversibly between two extreme phases (solitaria and gregaria) that differ in physiology, biochemistry, behaviour and morphology (Uvarov, Reference Uvarov1966; Applebaum et al., Reference Applebaum, Avisar and Heifitz1997; Pener and Yerushalmi, Reference Pener and Yerushalmi1998). Phase changes are predicated based on locust density; this may be promoted by a variety of environmental and biotic factors including improved rains and vegetation, habitat topologies, favourable microclimates, convergent winds, and patchy distribution of food plants and oviposition sites (Bouaïchi et al., Reference Bouaïchi, Simpson and Roessingh1996). Crowding and uncrowding can lead to rapid changes (over hours or days) in some of the phase-related traits, such as aggregation behaviour (Roessingh and Simpson, Reference Roessingh and Simpson1994) and the production of mediating releaser pheromones (Deng et al., Reference Deng, Torto, Hassanali and Ali1996; Hassanali et al., Reference Hassanali, Bashir, Njagi and Ely2005 a). Others, such as morphometrics, may take several generations (Pener, 1983). Gregarious characters may spread horizontally through the recruitment of solitary individuals into gregarizing groups (Njagi et al., Reference Njagi, Torto, Obeng-Ofori and Hassanali1996; Hassanali et al., Reference Hassanali, Njagi and Bashir2005 b) and accrue across generations through the eggs (Pener, Reference Pener1991; Islam et al., Reference Islam, Roessingh, Simpson and McCaffery1994a , Reference Islam, Roessingh, Simpson and McCaffery b ; Bouaïchi et al., Reference Bouaïchi, Roessingh and Simpson1995). Two types of signals have been implicated in priming the embryonic development of eggs towards the gregarious phase: a water-soluble chemical within egg foams (probably an alkylated l-dopa) secreted by the reproductive accessory glands at the time of oviposition (Hägele et al., Reference Hägele, Oag, Bouaïchi, McCaffery and Simpson2000; Simpson and Miller, 2007; Miller et al., 2008) and a blend of volatile C-8 unsaturated ketones, also produced by accessory glands, present in relatively large amounts in the eggs and the surrounding soil (Malual et al., Reference Malual, Hassanali, Torto, Assad and Njagi2001). The role and relative contribution of the two signals in predisposing a phase shift in developing eggs remain yet to be determined.
In the study reported by Malual et al. (Reference Malual, Hassanali, Torto, Assad and Njagi2001), the aggregative behaviour of hatchlings emerging from egg pods that had been incubated in sand previously used for consecutive ovipositions by gregarious females was compared with that of hatchlings emerging from sand that had been similarly exposed but subsequently washed with organic solvents or flushed with nitrogen gas. The first group of hatchlings showed a high level of aggregation similar to those derived from a crowd-reared locust colony. However, washing the sand with solvents or flushing with nitrogen led to a substantial loss of its gregarizing effect (Malual et al., Reference Malual, Hassanali, Torto, Assad and Njagi2001). The results of the study indicate that exposure of locust eggs to the signal that diffuses into the soil during oviposition by gregarious females causes the up-grading or down-grading of specific genes which then trigger other changes associated with the transition of developing embryos to the gregarious phase. The objectives of the present study were to expose developing embryos derived from solitary-reared females to different levels of the signal and compare their time-course protein patterns by two-dimensional (2D) gel electrophoresis with those obtained from embryos derived from gregarious females.
Materials and methods
Experimental insects
The test insects used in the study were S. gregaria locusts in solitaria or gregaria forms from the insectary of the International Centre of Insect Physiology and Ecology (icipe), Nairobi, Kenya. The stock from which the locusts were derived was originally supplied by the Desert Locust Control Organization for Eastern Africa (DLCO-EA), Addis Ababa, Ethiopia, and had been periodically supplemented with collections from Port Sudan, Sudan.
Locust rearing and maintenance
The locusts were reared by the methods developed by Ochieng-Odero et al. (Reference Ochieng-Odero, Ndugo, El Bashir, Capstick, Njagi and Chaudhury1994). Briefly, the locusts were fed on fresh wheat seedlings (Triticum spp.) and wheat bran with the solitaria and gregaria being kept in separate rooms at 28–37°C, with a photoperiod of 12 h light–12 h dark and relative humidity of 40–50%. Morphometry, pigmentation and/or the existence of an extra moult were used to distinguish generational changes in the phases of the locusts.
Exposure of oviposition substrate to primer gregarizing pheromone
The oviposition substrate was prepared by sieving builders' sand through a wire mesh (2 mm2 mesh size) to obtain uniform fine granules devoid of debris. The sand was sequentially washed with hot water, methanol, acetone and dichloromethane to remove possible inorganic and organic contaminants. This was followed by heat sterilization at 205°C for 24 h, and cooling to 27°C. The sand was then moistened to approximately 15% distilled water by placing 15 ml of water in 100 g of sand (Norris, Reference Norris1968). The sand was finally placed in standard aluminium oviposition cups (height 10 cm, internal diameter 4 cm) stationed at the front of the false floors of standard aluminium locust-rearing cages (Ochieng-Odero et al., Reference Ochieng-Odero, Ndugo, El Bashir, Capstick, Njagi and Chaudhury1994) containing 100 gravid gregarious females per cage (Saini et al., Reference Saini, Rai, Hassanali, Wawiye and Odongo1995). Two cages were employed in this study. The cups had previously been sterilized by overnight soaking in 2% sodium hypochlorite detergent, washed with soap and water, and baked at 150°C for 2 h, before they were cooled to 27°C. A total of 15 oviposition cups were put in each cage. Each oviposition tube was retrieved from the respective cage 24 h later; the sand content was sieved through the wire mesh and the resultant egg pods restrained by the mesh were counted. It was assumed that each egg pod released a significant and equal quantity of the gregarizing pheromone (Malual et al., Reference Malual, Hassanali, Torto, Assad and Njagi2001). Total pheromone dose in each tube was therefore considered to be directly proportional to the number of egg pods present. For the purposes of this study, each egg pod was considered to represent a pheromone dose as described previously (Malual et al., Reference Malual, Hassanali, Torto, Assad and Njagi2001), and the dose present in the sieved sand was therefore empirically estimated.
Exposure of solitaria eggs to sand containing primer gregarizing pheromone
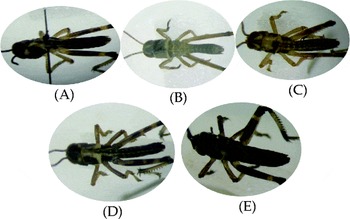
Sand containing the pheromone obtained as described above was placed in cages as also described above with solitarious gravid females. Four doses of the pheromone (from 0, 3, 5 and 10 days) were evaluated in five separate replicates. For each replicate, a control was prepared and handled in exactly the same way as the experimental material except that the sand was devoid of pheromone exposure. The tubes containing egg pods (1–3 per tube) were transferred into cages for instars' emergence 24 h later (Fig. 1). A total of 20 eggs were randomly sampled from each tube. In this process, care was taken to ensure that all the pods present were sampled. The sampling for each treatment and replicate was conducted at intervals of 1, 3, 5, 7, 10 and 12 days including the first instar. The samples were placed in 1.5 ml Eppendorf tubes and stored at − 80°C for subsequent protein analyses. Therefore, there were four treatments × seven sampling intervals × five replicates giving rise to a total of 140 experimental units.
Emergence of first instars from embryos: gregarious, solitary, unexposed and exposed to various pheromone doses. (A) Gregarious-phase first instar; (B) solitary phase unexposed to pheromone first instar; (C) solitary-phase instar exposed to three doses of pheromones; (D) solitary-phase instar exposed to five doses of pheromones; (E) solitary phase exposed to 10 doses of pheromones.

Protein extraction from embryos and first instar samples
Proteins were extracted from the eggs and first instar samples by the methods developed by Kiely and Riddiford (Reference Kiely and Riddiford1985a, Reference Kiely and Riddiford b ). Briefly, three eggs or instars were homogenized at 4°C in 100 μl extraction buffer (6.25 mm Tris–HCl, pH 6.8, 1% Nonidet P-40 and 1 mm phenylmethylsulphonyl fluoride [Sigma Chemical Co., St Louis, MO, USA)]. The extracted protein was quantified by Bicinchoninic acid assay (BCA; Pierce, Rockford, IL, USA) using Bovine serum albumin (Fraction V; Calbiochem, San Diego, CA, USA) as a standard.
Two-dimensional gel electrophoresis
The extracted protein from each individual replicate was separated into the respective peptide by the classical methods developed by O'Farrell (Reference O'Farrell1975) and modified by Jones (1980). Briefly, individual samples were separated by isoelectric focusing (IEF) gels in the first dimension using a 4:1 ratio of pH 5–7 (Amersham Pharmacia Biotech AB, Uppsala, Sweden) and pH 3.5–10 (Amersham Biosciences AB, Uppsala, Sweden) ampholines. The extruded gels were placed in 1 ml of equilibrium soaking solution (O'Farrell et al., Reference O'Farrell, Goodman and O'Farrell1977). The gels were allowed to equilibrate by gently shaking for 30 min at room temperature. For the second dimension, the sodium dodecyl sulphate–polyacrylamide gel electrophoresis (SDS–PAGE) was performed according to methods developed by Laemmli (Reference Laemmli1970). In this respect, the samples were run on 8.5% polyacrylamide overlaid with 3% stacking gel. Individual peptide spots resolved were visualized through silver staining (O'Farrell et al., Reference O'Farrell, Goodman and O'Farrell1977).
Data analysis
The protein expression profiles (number of spots and relative positions of proteins of the embryos and fledglings from different treatments) were captured by Compugen Z3 2D – PAGE Analysis System version 3.0 (Compugen Limited, Tel Aviv, Israel). The analysis generated information on the relative matching patterns of expressed proteins (spots) between and among various treatments at different stages, including the first instars. The patterns were further compared within and between treatments using the χ 2 test, at a= 0.05 rejection criteria using the statistical program R (2.13.1). All the analyses were performed using the R (2.13.1) statistical software (R Development Core Team, 2011), while relying heavily on the epicalc package (Chongsuvivatwong, Reference Chongsuvivatwong2012).
Results
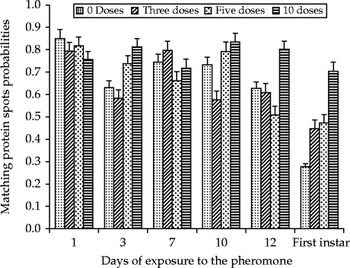
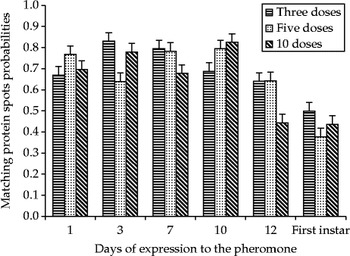
Temporal and stage-specific correlations between protein expression (spots) and the relative gregaria phenotype of solitarious S. gregaria locust embryos or instars exposed to various doses of gregarizing pheromones are summarized in Fig. 2A. Representative pictorial figures of the resultant first instars are also presented (Fig. 2B). Surprisingly, the largest gregarious phenotype (irrespective of dose) among the embryos was exhibited on day 1 of exposure. With the exception of the profile irregularity on day 3, the relative probabilities of gregarious matching protein spots were generally similar (P>0.05) and dose independent in the early stages (days 1–7) of exposure, but assumed a dose-dependent disposition thereafter, in a general direct proportional manner. Within the dose-dependent period (days 10–12), the solitary eggs exposed to 10 pheromone doses exhibited phenotypes very similar to those from gregarious eggs, corroborated by the emergent black and green first instar from the dose, a gregaria-specific characteristic. The profile from the emergent first instars exhibited a dose-dependent phenotypic response in tandem with the correlated embryo. This was manifested by the black and green colourations that increased in depth with an increasing dosage. As in the gregarious case, the profile of protein spots in various dosage treatments relative to the control varied widely in the earlier post-exposure period (days 3–7), before significantly departing in a dose-dependent manner, especially the 10-dose treatment (Fig. 3). A similar trend was observed among the emergent first instars.
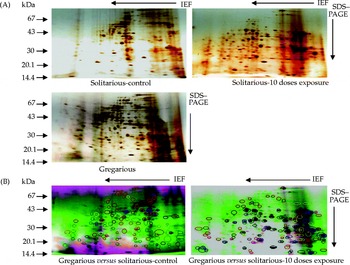
2D protein gel profiles of 12-day-old S. gregaria locust solitary-phase embryos exposed to various doses of gregarizing pheromones, gregarious-phase embryos, and various overlays between gregarious and solitarious phases. (A) Representative 2D-gel images of proteins from embryos of solitarious Schistocerca gregaria locusts not exposed to the gregarizing pheromone (solitarious-control), exposed to 10 doses of the pheromone (solitarious-10 dose exposure), and from a gregarious-phase embryo. The gels were obtained through 2D gel electrophoreses. (B) Match protein profile overlay of images obtained from gregarious-phase embryos and solitarious control or solitarious 10-dose exposure. Each overlay consists of images from gregarious phase (green) and solitarious control or solitarious exposure to 10 doses (purple). Red circles on green spots represent protein spots unique to gregarious profiles, while similar spots on purple spots represent the same on the solitarious phases. Spots common to gregarious and solitarious phase profiles are indicated in grey circles. Yellow and blue circles represent down- and up-regulated proteins in respect of the solitarious phase relative to the gregarious phase. The overlays were implemented through Compugen Z3 2D – PAGE Analysis System version 3.0 (Compugen Limited, Tel Aviv, Israel).

Matching protein spot probabilities between gregarious and solitary Schistocerca gregaria embryos and instars exposed to various doses of the gregarizing pheromone.

The protein expression profiles of the 12-day-old solitarious embryos exposed to 10 doses of the pheromone (the embryonic stage with the most striking phenotype compared with the solitarious or gregarious controls) are represented in Fig. 4. Putative induction, repression or proteolytic processing of some proteins in the solitarious embryos, due to exposure to the gregarizing pheromone, is evident as the suggested presence or absence of some spots, or shifts in their positions in the 10-dose treatment, compared with the controls. Most proteins in the solitarious controls were basic whose molecular weight is between 43.0 and 94.0 kDa, whereas that of the remaining acidic proteins is between 14.4 and 20.1 kDa.
Matching protein spot probabilities between Schistocerca gregaria solitary embryos and instars unexposed and exposed to various doses of the gregarizing pheromone.

Discussion
The present study investigated protein expression in growing embryos of solitary-phase S. gregaria due to the gregarizing pheromone associated with gravid females, and in relation to the solitaria-to-gregaria phase transition in the locust. Effects of the primer gregarizing pheromone on the phase shift of embryos from solitary females were discernable in the mature stages of embryogenesis and in the first instars. This was particularly true at high pheromone titres. Such responses are accompanied by an interestingly wide fluctuation in protein expressions relative to gregarious or solitarious phenotypes in the initial duration of exposure of the embryos, before assuming a dose-dependent relationship towards the gregarious phase. The fluctuations may be attributed to specific protein titres related to the level of embryogenesis and/or to the degree of phase shift. The subsequent dose-dependent responses are in agreement with those of Malual et al. (Reference Malual, Hassanali, Torto, Assad and Njagi2001) who established a significant shift towards the gregarious phase in a dose-dependent manner under similar circumstances. This suggests a putative functional (phenotypic) and direct relationship between the differentially expressed proteins and the shift in phenotype, a likely reflection of the changing phase status of the developing insects. Although a similar phenomenon has previously been putatively associated with some haemolymph proteins (Wedekind-Hirschberger et al., Reference Wedekind-Hirschberger, Sickold and Dorn1999), the specific identifications of the predominantly basic proteins of low molecular weight, and the nature of the putative proteomic processing observed in the current study remain yet to be determined through a complex and detailed study to elucidate the roles of the proteins in gregaria- or solitaria-specific signal transduction at these stages. This will help to unravel the mechanism of the signalling cascades associated with specific gene expression triggered by the primer gregarizing pheromone.
In practical terms, there is an absence of discernable differences between the solitaria and gregaria embryos in the early stages of embryogenesis, suggesting that eggs derived from both phases are essentially similar, and that phase-related differentiation occurs on exposure to the high pheromone titres over duration. The implication of this in the field is that sustainable gregarization can occur only at high locust densities, resulting in dense communal oviposition. This would have two consequences. First, the developing eggs would be primed to produce gregarious hatchlings. Second, dense aggregation of egg pods from gregarizing or gregarious females would attract solitary females also to oviposit communally (Bashir et al., Reference Bashir, Hassanali, Rai and Saini2000), thus ensuring a rapid spread of the gregarious character in the population. Since the study demonstrated the most similar protein expression patterns between the gregarious and the solitarious phases induced with 10 doses of the pheromone on day 10 or 12, and in hatchlings, the differentially expressed proteins (spots) can potentially be exploited in the development of molecular tools for the regulation of the phase transitions or of transgenic strains of the locust permanently deficient in the pest gregarious phenotype.
Conclusion
Dose-dependent effects of the primer gregarizing pheromone on the phase shift of embryos from solitary females find prominent expression in the mature stages of embryogenesis and in the first instars. Thus, effective trans-generational transfer of gregarious-phase characters as revealed by proteomic analysis occurs in the desert locust.
Acknowledgements
We thank Mathew Miti (icipe) for insect rearing and assistance in pheromone trapping.