I. INTRODUCTION
Energy-dispersive X-ray fluorescence (EDXRF) spectrometry is a common tool for highly accurate, precise, reproducible, non-destructive (avoidance of acid digestion), easy machine operation, low-operating cost, higher sample throughput, and short time for the analysis of multiple elements. Because of these inherent advantages, EDXRF has been widely adapted for the analysis of major and trace elements (Nielson et al., Reference Nielson, Mahoney, Williams and Rogers1991; Goldstein et al., Reference Goldstein, Slemmons and Canavan1996; Jenkin, Reference Jenkin and Meyers2000; Marguí et al., Reference Marguí, Queralt, Carvaiho and Hidalgo2005; Wien et al., Reference Wien, Wissmann, Kölling and Schulz2005; Padilla et al., Reference Padilla, Van Espen and Godo Torres2006). The method is fast, it can be used routinely for high-resolution analysis and simple sample preparation for the analysis of elements from Na to U in the concentration range % to some 100 s of ppm and to the sub-ppm-level with the incorporation of advanced techniques such as the polarization or total reflectance of the primary beam (Schmeling and Van Grieken, Reference Schmeling, Van Grieken, Van Grieken and Markowicz2002; Gauglitz and Vo-Dinh, Reference Gaugliz and Vo-Dinh2003; Zschornack, Reference Zschornack2007). The primary radiation scattered at the sample is recorded simultaneously with the fluorescence signal. The method is used to identify and determine the concentration of elements present in solid, powdered, and liquid samples (Larry and Hanke, Reference Larry and Hanke2001; De Francesco et al., Reference De Francesco, Crisci and Bocci2008). EDXRF spectrometry is an elemental analysis technique with broad application in science, environmental, industry, etc. (Jenkins, Reference Jenkins1976, Reference Jenkins1999; Ellis, Reference Ellis, Van Grieken and Markowicz2002; Brouwer, Reference Brouwer2010; Shackley, Reference Shackley2011).
Polarizing beam EDXRF (PEDXRF) equipped with secondary targets (Heckel et al., Reference Heckel, Haschke, Brumme and Schindler1992) confers additional benefits with regard to lowering the background and the improvement of excitation conditions which improve the signal-to-noise (S/N). Thus sensitivities and detection limits are improved up to an order of magnitude (Heckel and Schramm, Reference Heckel and Schramm1997; Van Meel et al., Reference Van Meel, Smekens, Behets, Kazandjian and Van Grieken2007). The secondary target is interposed between the X-ray tube and the sample configuring a Cartesian geometry (tri-axial, 3D) between source, sample, and detector. With this geometry, a significant reduction of the background radiation, particularly from Bremmstrahlung (or braking radiation) in the fluorescent spectrum is achieved because the exciting radiation is polarized when the scatter occurs through the right angle and cannot then be scattered a second time into the detector. In this way, high sensitivity and limit of detections of minor and trace elements can be achieved that are better than those of conventional spectrometers (Marguí et al., Reference Marguí, Queralt and Hidalgo2009).
The process of emissions characteristic X-rays is called X-ray fluorescence (XRF) (Briggs-Kamara, Reference Briggs-Kamara2012). EDXRF technique is a two-step process that begins with a source of incident X-rays (X-ray tube) or gamma rays (radioactive source) that are concentrated and guided into the sample. Some of these photons will pass through the sample, but some will be reflected off its surface. The atoms in the sample material, which could be solid, powder, or liquid, are excited by the incident photons that enter the sample and collide (interact) with the electrons present in the atoms. Physical reactions occur that cause the removal of an inner shell electron or the creation of a vacancy in the atom. This vacancy presents an unstable condition for the atom. The second step is the vacancy being filled by an outer shell electron thus returning the atom to its stable condition. The transition from the outer shell electron orbital to an inner shell electron orbital is accompanied by the emission of a secondary or characteristic X-rays. These characteristic X-rays hit a detector and are registered. Each element has a unique set of energy levels, allowing the non-destructive measurement of the elemental composition of the sample. The energy of the fluorescent photon is characteristic of the element and it is equal to the energy difference between the two electron energy levels. Thus the energy of the fluorescent photon provides qualitative information concerning the element's identity. The number or intensity of fluorescent photons is characteristic of the amount or concentration of the element present. The radiation intensity of each element's signal, which is proportional to the concentration of the element in the sample, is recalculated internally from a stored set of calibration curves and can be shown directly in concentration units (Jenkins, Reference Jenkins1976, Reference Jenkins1999; Padilla et al., Reference Padilla, Van Espen and Godo Torres2006; Leroy and Rancoita, Reference Leroy and Rancoita2009; Brouwer, Reference Brouwer2010;Tsoulfanidis and Landsberger, Reference Tsoulfanidis and Landsberger2011; Briggs-Kamara, Reference Briggs-Kamara2012). The total counts are expressed as intensity in counts per second (Johnson et al., Reference Johnson, Hooper and Conrey1999). Sometimes, as the atom returns to its stable condition, instead of emitting a characteristic X-ray it transfers the excitation energy directly to one of the outer electrons, causing it to be ejected from the atom. The ejected electron is called an Auger electron. This process is a competing process to XRF. Auger electrons are more probable in the low Z elements than in the high Z elements (Briggs-Kamara, Reference Briggs-Kamara2012). In most EDXRF spectrometry the K and L shells are involved in the detection. A typical X-ray spectrum from an irradiated sample will display multiple peaks of different intensities, which are the K, L fluorescence lines.
Possible disadvantages are related to spectral interferences for certain elements and poorer sensitivity for lighter elements, with elements of atomic number (Z) lower than Na such as Be, not being detected. However, recent technical developments in EDXRF have potentially overcome many of these problems. High-resolution Si(Li) detectors have improved energy resolution dramatically, thereby reducing spectral interferences. The development of personal computers with high speed and memory has also allowed fundamental parameter (FP) algorithms to be quickly performed using multiple standards, resulting in rapid and more accurate standardization and analysis for multi-component, complex matrices over standard empirical methods (Goldstein et al., Reference Goldstein, Slemmons and Canavan1996).
Validation method is the process by which it is established that performance characteristics of the method meet the requirements for the intended analytical applications or is suitable for its intended use. The validity of a specific method should be demonstrated in laboratory experiments using samples or standards that are similar to unknown samples analyzed routinely. The preparation and execution should follow a validation protocol (Ajay and Rohit, Reference Ajay and Rohit2012). Methods need to be validated or revalidated before their introduction into routine use; all analytical methods that are intended to be used for analyzing any samples will need to be validated (Huber, Reference Huber2010). Results from method validation can be used to judge the quality, reliability, and consistency of analytical results; it is an integral part of any good analytical practice. When extended to an analytical procedure, depending upon the application, it means that a method works reproducibly, when carried out by same or different persons, in same or different laboratories, different equipment, etc. As scientists, we would want to apply good science to demonstrate that the analytical method used had demonstrated accuracy, sensitivity, limits of detection, precision, specificity, and reproducibility (Chan, Reference Chan and Gad2008).
The objective of any analytical measurement is to obtain consistent, reliable, and accurate data. Validated analytical methods play a major role in achieving this goal. Validation of analytical methods is also required for quality standards that impact laboratories (Huber, Reference Huber2010).
Accuracy and precision are usually used in discussing the uncertainties in measured values. Ideally a measurement device is both accurate and precise, with measurements all close to and tightly clustered around real or true value. The accuracy and precision of a measurement process is usually established by repeatedly measuring some traceable reference standard. Accuracy is a measure of how close a result is to the true value. Precision is a measure of how repeatable the result is. Obviously, the goal is to have a measurement that is both accurate and precise, but being one does not mean that the other is as well. It is possible, however, for a precise value to be inaccurate. For example, if a very sensitive balance is poorly calibrated, the masses measured will be inaccurate even if they are precise. If the value is very precise, but not at all accurate; this is called a systematic error (sometimes also called bias) and can normally be corrected. Eliminating the systematic error improves accuracy but does not change precision. Accuracy and precision together constitute the figures of merit (FOMs) of the analytical technique.
The main disadvantage of PEDXRF spectrometry is the amount of the sample mass needed to be analyzed. In the present work the PEDXRF spectrometer, the SPECTROXEPOS III (Spectro Analytical Instruments GmbH & Co. KG, Kleve, Germany), has been used. As per the manufacturer's recommendation, the sample mass should be 4 g. This amount is not reachable in a lot of biological and environmental samples; in some cases the mass is less than 0.01 g. In the market there are available varying geometries for sample cups and dies for making pellets. If smaller sample cup or pellet diameter is able to produce a high accuracy, analysis with less mass can be achieved. This was the guiding motivation for this work.
Incident X-ray absorption depends on sample area, depth, density, and elemental composition of the sample. For sample cups and pellets of fixed area, the depth of complete absorption of the incident X-rays will be dictated by the sample issues, i.e. mass, density (powder or pellet), and elemental composition of the sample.
The flux of fluoresced X-rays reaching the detector will be governed by the extent of self-absorption by the sample and scattering away from the optical path, which will depend on sample depth, density, and elemental composition. If the smaller sample cup or pellet diameters produce nearly the same FOMs, then smaller sample cup or pellet diameters can be used. In this work, the factors of accuracy and precision in PEDXRF analysis or the FOMs of the analysis for different sample cup and pellet diameters have been examined using the specific instrument SPECTERO XEPOSIII.
A. THEORETICAL BASIS
Sample matrix effects impact the sensitivity of the method. We designate S j as the sensitivity of the XRF spectrometer for the jth element in the sample matrix. Higher sensitivity improves the accuracy of the XRF analysis. Count rate (R j) collected in the peak R j = S jC j where C j is the jth elemental concentration. The number of fluoresced photons (N ij) coming from the ith atomic level (K, LI, LII, LIII, etc.) of the element j is proportional to R j. For the given element, N ij in turn depends on the intensity of the exciting X-ray beam of wavelength Λ at the fluorescence site, the magnitude of the photoelectric cross-section τ Λ,i, the fluorescence yield ω λ,i and branching fraction B λ,i for the fluoresced X-ray of wavelength λ (energy E f), as well as the attenuation factor F(λ) for the fluoresced X-ray as it traverses through the matrix (cf. Miller, Reference Miller, Reilly, Ensslin, Smith and Kreiner1991). For elements of medium – high Z, at the typical X-ray excitation energy, i.e. the energy of the primary beam, ~50 keV, the photoelectric absorption cross-sections are relatively high. The fluorescence yield is highest for K-shell emissions and increases with Z j. Thus for these elements the N ij are expected to be relatively high unless very low concentrations are encountered. However matrix effects will also influence the intensity of the fluoresced X-rays collected at the detector.
The consideration of sample matrix effects must take F(λ) into account. We may use the Beer–Lambert law of the passage of X-rays through matter to obtain
 $$F\lpar \lambda \rpar = 1-T = 1-[\exp \lpar \!\!- \mu _\lambda d\rpar]$$
where μ λ is the linear attenuation coefficient for the wavelength λ and d is the sample thickness (for samples directly facing the detector). T is the transmittance defined as the ratio of the intensity of the fluoresced X-rays I(λ) at a distance d from the fluorescence site, to the intensity I 0(λ) produced at the fluorescence site. Defining the sample density as ρ = m/Ad where m is the sample mass and A is the area of the sample face from which the fluoresced X-rays exit towards the detector, we obtain
 $$\eqalign{F\lpar \lambda \rpar & = 1-[\exp - \lpar \mu _\lambda d\rpar] = 1-[\exp \lpar \!\!- \lpar \mu _\lambda /\rho \rpar \rho d\rpar] \cr& = 1-[\exp \lpar \!\!- \lpar \mu _\lambda /\rho \rpar \lpar m{\rm /}Ad\rpar d\rpar ] \cr & = 1-[ \exp \lpar \!\!- \lpar \mu _\lambda /\rho \rpar \lpar m{\rm /}A\rpar \rpar ] }$$
μ λ/ρ is called the mass attenuation coefficient and m/A is called the sample areal density (g cm−2).
Hence as far as the element's Z is concerned, the photoelectric absorption and fluorescent yield increases with Z j. Elements of higher Z are therefore expected to produce greater accuracy for samples with the same areal density.
For an analyte of given Z j, the matrix effects enter through the areal density and the mass attenuation coefficient terms for the matrix elements. For the same mass of sample, a higher A will result in lower F(λ) for the primary beam and lower self-absorption for the E f. The effect on the count-rate will depend on which effect is larger.
For the same A a higher mass will increase the primary beam's attenuation factor contributing to a higher count rate that will increase the accuracy. But by the same argument it will increase the self-absorption of E f. Pelletizing the samples is one technique of trying to increase the count rate by increasing the density (more mass per unit volume). The technique for optimizing the A is to use sample cups and pellets of different diameters.
From the aforesaid it is clear that it is not possible to a priori determine which set of factors for the given sample will result in the best count-rates and therefore the best FOMs. Designed experimentation is required.
The objectives of the present work are the determination of the limits of accuracy and precision (FOMs) of the FP-based standard-less analysis (SLA) routine TURBOQUANT® (TQ) in the PEDXRF instrument (the SPECTERO XEPOS III) for small mass samples of soils and ceramics and thereby the quality assurance of the analytical method. Detailed objectives are: (1) to determine and compare the FOMs for varied sample cup diameters and powder sample masses, with the same thickness; (2) to determine and compare the FOMs for varied sample pellet diameters and masses, with the same thickness; (3) to determine and compare the accuracy factor (AF) and precision for varied sample cup diameters and thicknesses, with the same low weight = 0.5 g of the powder sample; (4) to use the results from the aforesaid to recommend the best sample configurations for soils and ceramics using the SPECTROXEPOS III in our laboratory.
II. MATERIALS AND METHODS
A. INSTRUMENTATION
The PEDXRF spectrometer used in the present work is the SPECTRO XEPOS III (Spectro Analytical Systems GmbH, Kleve, Germany) that uses a palladium (Pd)-target end-window tube at a maximum power 50 W and voltage 50 kV to excite the samples. The target changer, with up to eight polarization and secondary targets Mo, Co, Zn, Zr, Pd, CsI, highly oriented pyrolytic graphite (HOPG), and aluminum oxide (Al2O3), offers many different excitation conditions ensuring optimum determination of all elements from Na to U. The X-ray focal spot size is 1 mm2. A 10 mm2 effective detection area, high-performance Si-drift detector (SDD) with low temperatures of −25 to −30 °C using Peltier cooling is used. Flushing or purging by helium (He) to avoid loss of energy caused by scattering in air further improves the sensitivity for light elements such as Na, Mg, etc. In addition, the instrument permits direct SLA through the FPs routine TQ, whereby detector, sample matrix characteristics and background photon counts are automatically corrected (Schramm and Heckel, Reference Schramm and Heckel1998).
TQ is brand name for a SPECTRO method that is used for screening analysis. The method is able to analyze the elements from Na to U in completely unknown samples – all matrix effects which occur are taken into account. The only distinction made is between solids (powder and pellets), liquids, and alloys; there is a separate program for each. TQ-powder and pellet have been used in the present work. The excitation of all the elements Na–U is split into three single measurements using different targets (Heckel and Schramm, Reference Heckel and Schramm1997; User's manual SPECTRO XEPOS III); the light elements 11Na–23V are excited using a HOPG Bragg target that helps to produce intense monochromatic polarized X-rays; the elements 24Cr–40Zr and 59Pr–92U are excited using a Mo secondary target (intense monochromatic non polarized X-rays); and high energy elements 39Y–58Ce are excited using Barkla Al2O3 target (intense polychromatic polarized X-rays). For all elements from 11Na to 58Ce, the K-lines are used, and for all elements from 59Pr to 92U, the L-lines are used (User's manual SPECTRO XEPOS III).
Standard-less FPs is a theoretical analysis (SLA) method based on theoretical calibration. This type of program is limited to one specific matrix. Improvements in analytical software based on the FP approach have meant that FOMs have also improved. This methodology therefore enables the analyst to obtain elemental composition even when standard samples are not available (User's manual SPECTERO XEPOS III).
For measuring samples of unknown chemical composition in which concentrations of light and heavy elements may vary from ppm to high percent levels, FP analysis is used to simultaneously compensate for a wide variety of geometric effects (e.g. small mass samples), plus X-ray absorption, and secondary and tertiary fluorescence effects. Thus, it is possible to analyze a full range of elemental concentrations in a wide variety of samples without any additional calibrations or user input of any kind. Thus, it becomes particularly useful for unknown matrices for which standard calibration techniques requiring matrix matching becomes very difficult.
B. SAMPLE PREPARATION
Standard reference materials (SRMs) are controls or standards used to check the quality and traceability of products. A reference standard for a unit of measurement is an artifact that embodies the quantity of interest in a way that ties its value to the reference base for calibration. The importance of SRMs in the quality assurance of measurements is widely accepted. SRMs are frequently used in analytical chemistry for calibration, verification, and evaluation of both analytical methods and instruments (Hicho and Eaton, Reference Hicho and Eaton1982). The accuracy of quantitative XRF analysis is dependent on a set of calibration standards. Currently, many laboratories are using SRMs for both calibration and qualification standards.
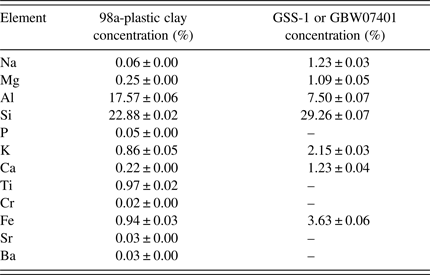
Two ceramic and soil SRMs, 98a-Plastic Clay (NIST, Maryland, USA) and GSS-1 or GBW07401 (NRCG, Beijing, China) powders were used in this work. They differed in their intrinsic matrix properties of grain size, bulk and surface monolayer densities as well as the elemental concentrations. Details of elements concentration and composition for GSS-1 and 98a-Plastic Clay are summarized in Table I. Physical effects of matrices result from variations in physical characteristics of the sample, including particle size, uniformity, homogeneity, and the surface condition that affect the accuracy and precision; mean particle size for GSS-1 = 5.955 ± 3.293 µm and 98a-Plastic Clay = 12.980 ± 3.387 µm measured by laser particle analyzer (LS100Q Laser Particle Analyzer Beckman Coulter Corp., California, USA); while the powder density measured for GSS-1 = 1069.60 ± 14.63 kg m−3 and for 98a-Plastic Clay = 1208.11 ± 40.41 kg m−3. Particle sizes and heterogeneity may influence on the analysis results if not accounted for when establishing the sample preparation routines. Sample preparation and particle size variance are major potential sources of error. The particle size should be ≤100 µm as recommended from the SPECTRO Analytical Company (User's manual SPECTRO XEPOS III). Our measurements above indicate that the SRMs used, conform to this requirement.
Certified concentration of the different elements in the two SRMs.

Different geometries of the sample cups with diameters 24 mm (Spectro Analytical Systems, Kleve, Germany), 15, and 10 mm (Chemplex Industries, Inc.), and die diameters 25, 15, and 10 mm were used in the present work. Thickness measurements were done by digital vernier caliper for five different locations, and the average thickness with its standard error was calculated. Pellet average density and its error (by propagation) were calculated from the thickness and diameter.
Humidity will reduce the X-ray absorption (scatter will increase) in the sample surface and increase the signal/noise (Eivindson and Mikkelsen, Reference Eivindson and Mikkelsen1999). Hence GSS-1 and 98a-Plastic Clay were dried in the oven for at least 24 h at 60 °C before the analyses.
Accuracy, precision, and reproducibility of the PEDXRF instrument were assessed by replicate measurements of the concentrations. The replicates correspond to duplicate SRM samples each measured five times in the same run and over two different runs on separate days. The instrumental operating conditions were the same. Errors on the concentrations were estimated as standard deviations over replicates and for derived quantities, the errors were statistically propagated. Concentration accuracy was estimated by comparing our results with the given values of the SRM certificates, as explained below. Precision is the ability of a measurement to be consistently reproduced. Schramm et al. (Reference Schramm, Heckel and Molt1999) have stated that the development of PEDXRF makes it possible to achieve high accuracy and precision in the analysis. The FOMs were estimated as follows:
 $$\eqalign{&{\rm Accuracy}\, {\rm factor}\, \left(\% \right)\cr & \quad = [ {\rm Conc} .\, \left({{\rm PEDXRF}} \right){\rm /Conc} .\, \left({{\rm certificate}\, {\rm of}\, {\rm analysis}} \right)] \cr & \quad \quad \times 100}$$
 $$\eqalign{&{\rm Precision}\, {\rm factor}\, \left(\% \right)\cr & = \left({1-{\rm CV}} \right)\times 100 \cr& =[ 1-\left\{{{\rm SD}\left({{\rm PEDXRF}} \right){\rm /Conc} .\, \left({{\rm PEDXRF}} \right)} \right\}] \times 100}$$
where “Conc.” stands for concentration, “CV” for the coefficient of variation and SD for the standard deviation of the PEDXRF concentration measurement.
After capping the sample cups (pellets were not capped), the samples were arranged inside a 12-position rotating tray, which was then inserted into the measuring chamber of the SPECTRO XEPOS III. Polypropylene film (4 µm thick) was used as the sample X-ray window. Samples were irradiated by the instrumental set-up as described earlier and analyzed by TQ-powder and pellet. Every sample needed 23 min for complete analysis.
Pelletizing is necessary for the quantitative chemical analysis of low atomic number elements. If the elements of interest constitute light elements like Na, Mg, etc., the samples must be prepared as pellets. This avoids surface affects, which have a high influence on the determination of light elements (Eivindson and Mikkelsen, Reference Eivindson and Mikkelsen1999). In fact, higher density of the pellets for light elements, whose primary X-rays (photoelectric) absorption cross-sections are low, are likely to give better FOMs.
A pressed pellet should basically have the following quality for PEDXRF: (1) it must be homogeneous; (2) the pellet must be absolutely solid as loose particles pollute the X-ray tube; (3) the pellet should be stable (and storable); it should have a (4) fine surface; (5) fine grain, small particle size ≤100 µm; and (6) it should be compact and flat. The advantages of adding a binding agent to the pellet are that it makes: (1) surface indelible; (2) non-hygroscopic (for storage); and (3) stabilizes the pellet.
Pellet and powders (sample cup) of weight 4 g with diameter 25 and 24 mm, respectively, were taken as standard; sample thicknesses were measured for powders (sample cup 24 mm) and pellet 25 mm; density was calculated for 25 mm diameter pellet; thickness and density for pellet diameter 25 mm, and thickness for powder (sample cup diameter 24 mm) were taken as reference for the other pellets and powders in other sample cup diameters. Pellet with wax as binder was done by following the User's manual SPECTRO XEPOS III: 4 g sample plus 0.9 g wax (CEREOX Licowax C Micropowder Wax, BM-0002-1, FLUXANA® GmbH & Co. KG, Kleve, Germany).
All the pellets were made using the same pressure = 207.2 × 10⁶ N m−2, using a hydraulic press (TRUPER, model is PREH-20, Mexico). Thus, the pellets of the same material would have approximately the same density; average density for GSS-1 with different pellet diameters (25, 15, and 10 mm) = 2.07 × 10⁻³ ± 1.40 × 10⁻⁵ g mm−3 and with wax (25 mm) = 1.83 × 10⁻³ ± 6.52 × 10⁻⁶ g mm−3; while in 98a-Plastic Clay for different pellet diameters (25, 15, and 10 mm) = 1.99 × 10⁻³ ± 8.10 × 10⁻⁶ g mm−3. Wax decreased the density, and increased the thickness to the pellet because of the intrinsically lower density of the wax.
For making the pellets, powder samples with particle sizes less than 100 µm were pressed with the loads of 10.4, 3.74, and 1.66 ton for 60 s, respectively, using die diameters 25, 15, and 10 mm. The only problem that arises from the preparation of pressed pellets is the time it consumes.
C. EXPERIMENTAL PROCEDURE
Powders in sample cup diameter 24 mm and pellet diameter 25 mm each with 4 g mass were taken as reference for thickness and density for other sample cups (powders) and pellets. All sample cups and pellets were fixed exactly in the middle of the sample cup holder, using different parts of (polyethylene) rings from other sample cups.
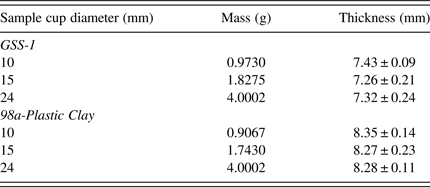
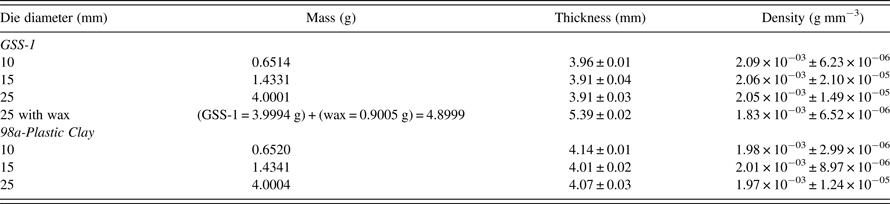
Different geometries of sample cup (diameters = 24, 15, and 10 mm) and pellet (diameters = 25, 15, and 10 mm) with the same sample thickness but varying masses and aspect ratios were analyzed. The thickness and diameters were measured in five different locations using a digital vernier caliper; the average for the thickness and diameter with their errors were calculated. Pellet densities were calculated from the mass, thickness, and diameter where density = mass/volume (πr 2h), where h is the thickness, and r is the radius. Thickness, mass, and density for powders (sample cup) and pellet diameters are summarized in Tables II and III.
Sample cup powder details, for the same thickness with varying masses and diameters.
Pellet details, for the same thickness with varying masses and diameters.
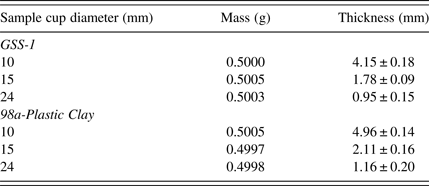
Low masses (0.5 g) of powders for sample cup diameters (24, 15, and 10 mm) with varying thicknesses, were analyzed. Thickness was different according to the sample cup diameters, details shown in Table IV. Powders in sample cups of smaller diameter had bigger thickness. Powder in sample cup diameter 10 mm had thickness GSS-1 = 55.9% and plastic clay-98a = 59.4%, and sample cup diameter 15 mm GSS-1 = 24.5% and plastic clay-98a = 25.5%, while sample cup diameter 24 mm GSS-1 = 13% and plastic clay-98a = 14%, of the thickness commensurate with the recommended 4 g of mass given by the manufacturer (Spectro analytical GmbH). Theoretically the primary X-ray requires infinite thickness for complete absorption. The thickness of the 24 mm sample cup powder was the farthest from this ideality.
Sample cup powder details, for the same mass = 0.5 g with varying thickness and diameters.
III. RESULTS
A. Powder samples
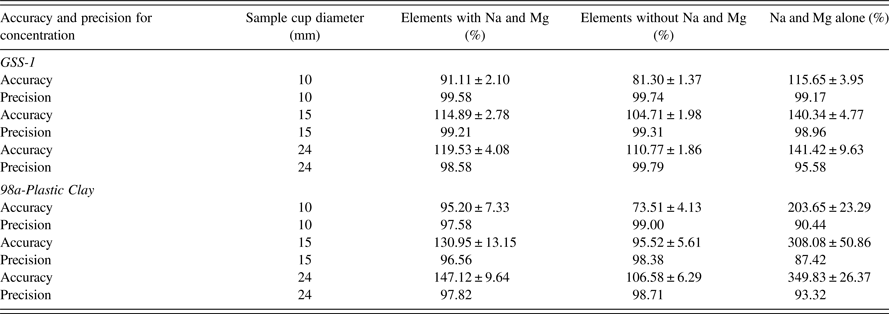
Different geometries of sample cup diameters (powder samples) 24, 15, and 10 mm with the same thickness and varying masses were analyzed. Average sample thickness for the different diameters were for GSS-1 = 7.34 ± 0.18 mm and 98a-Plastic Clay = 8.30 ± 0.16 mm. Results are shown in Table V, Figures 1 (GSS-1) and 2 (98a-Plastic Clay). TQ-powder program was used to measure the concentration of elements; the FOMs were calculated from the concentration results. The TQ-powder program is not recommended for the analysis of Na and Mg (User's manual SPECTRO XEPOS III). FOM tables were obtained using three cases for the FOMs, (1) with Na and Mg, (2) without Na and Mg, and (3) Na and Mg alone. The error produced from Na and Mg is understandable from case (3). The most important case is the average for AF and precision using case (2). Without considering Na and Mg, all the comparisons will depend on case (2). Low atomic number (Z) elements produce lower intensity of fluoresced X-rays because of lower absorption cross-sections and lower fluorescence yields due to Auger electron competition. Samples with lower densities such as the powder will therefore suffer more than the pellet – hence the recommendation not to use powder to analyze low atomic number elements.
Comparison between accuracy factor and precision for concentration versus Z for elements in GSS-1; all sample cups have the same thickness with varying diameters and masses.
Comparison between accuracy factor and precision versus Z for each element in 98a-Plastic Clay; all sample cups have the same thickness with varying diameters and masses.
Comparison of FOMs between powders in different sample cup diameters and masses, with the same sample thickness.
Precision for GSS-1 and 98a-Plastic Clay show only small deviations from 100% (deviations from 100% accuracy or precision are termed as “bias” in this work). For all the sample cup diameters 24, 15, and 10 mm, precision was >98%. Without considering Na and Mg, the best AF was for sample cup diameter 15 mm: AF for GSS-1 = 104.71 ± 1.98% and 98a-Plastic Clay = 95.52 ± 5.61%. On the other hand, the worst AF was for sample cup diameter 10 mm: AF for GSS-1 = 81.30 ± 1.37% and 98a-Plastic Clay = 73.51 ± 4.13%. Sample cup diameter 24 mm, which is recommended by the SPECTRO XEPOS III had the AF for GSS-1 = 110.77 ± 1.86% and 98a-Plastic Clay = 106.58 ± 6.29%.
B. Pellet samples
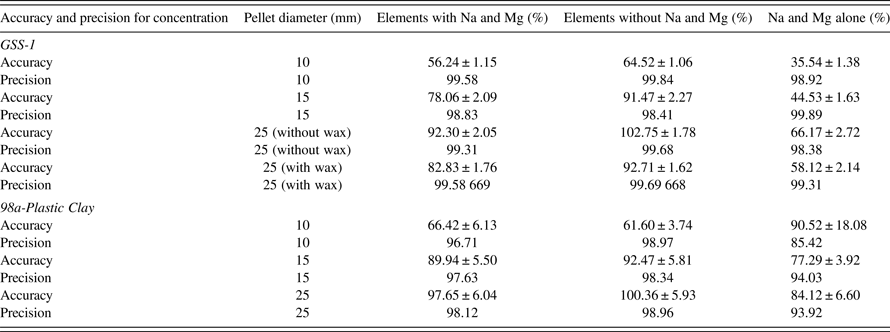
Different geometries of samples in pellet form with pellet diameters 25, 15, and 10 mm with the same thickness and varying masses were analyzed. Average thickness for different diameters were: GSS-1 (without wax) = 3.93 ± 0.03 mm and 98a-Plastic Clay = 4.08 ± 0.02 mm. Average density for different diameters were: GSS-1 (without wax) = 2.07 × 10⁻³ ± 1.40 × 10⁻⁵ g mm−3 and 98a-Plastic Clay = 1.99 × 10⁻³ ± 8.10 × 10⁻⁶ g mm−3. One sample was analyzed as pellet with wax: GSS-1 (25 mm), average thickness = 5.39 ± 0.02 mm, and density = 1.83 × 10⁻³ ± 6.52 × 10⁻⁶ g mm−3. Results shown in Table VI, Figures 3 (GSS-1) and 4 (98a-Plastic Clay).
Comparison of the accuracy factor and precision versus Z for each element in GSS-1; all pellets have the same thickness with varying diameters and masses.
Comparison of the accuracy factor and precision versus Z for each element in in 98a-Plastic Clay; all pellets have the same thickness with varying diameters and masses.
Comparison of the FOMs for pellets of different diameters and masses but the same thickness.
Precision for GSS-1 and 98a-Plastic Clay showed only small biases for all pellet diameters 25, 15, and 10 mm: the precision was >98%. The best AF was for the pellet diameter 25 mm: AF for GSS-1 (without wax) = 102.75 ± 1.78%, GSS-1 (with wax) = 92.71 ± 1.62% and 98a-Plastic Clay = 100.36 ± 5.93%. On the other hand, the worst AF was for the pellet diameter 10 mm: AF for GSS-1 = 64.52 ± 1.06% and 98a-Plastic Clay = 61.60 ± 3.74%. Pellet diameter 15 mm has AF for GSS-1 = 91.47 ± 2.27% and for 98a-Plastic Clay = 92.47 ± 5.81%. Pellets showed an improvement on the AF for Na and Mg, compared to the powder samples.
C. Powder samples of low mass (0.5 g)
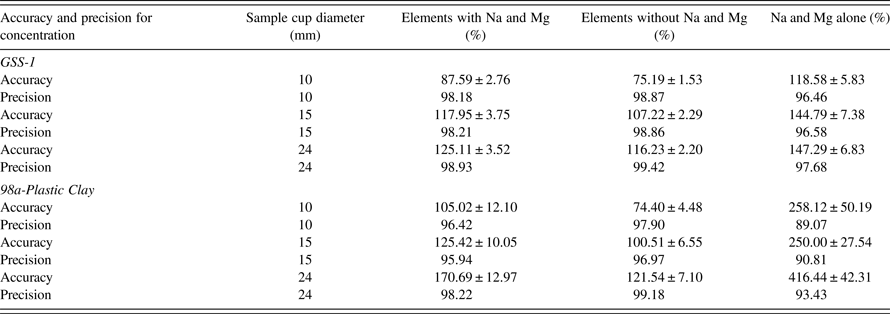
Powders in different sizes of sample cups with the diameters 24, 15, and 10 mm with the same mass 0.5 g of the powder and varying thicknesses were analyzed. Results are shown in Table VII, Figures 5 (GSS-1) and 6 (98a-Plastic Clay).
Comparison of the FOMs with the Z of each element in GSS-1; all sample cups have for the same mass (0.5 g) with varying diameters and thicknesses.
Comparison of the FOM with the Z of each element in in 98a-Plastic Clay; all sample cups have for the same mass (0.5 g) with varying diameters and thicknesses.
Comparison of the FOMs for varying sample cup diameters and thicknesses, with the same mass (0.5 g).
The precision for GSS-1 and 98a-Plastic Clay have only small biases for all the sample cup diameters 24, 15, and 10 mm; the precision was ≥97%. The best AF was for sample cup diameter 15 mm: AF for GSS-1 = 107.22 ± 2.29% and for 98a-Plastic Clay = 100.51 ± 6.55%. On the other hand, the worst AF was for sample cup diameter 10 mm: AF for GSS-1 = 75.19 ± 1.53% and 98a-Plastic Clay = 74.40 ± 4.48%. Sample cup 24 mm, which is recommended by the SPECTRO XEPOS III has the AF for GSS-1 as 116.23 ± 2.20% and for 98a-Plastic Clay as 121.54 ± 7.10%.
IV. DISCUSSION
Powders in different sample cup diameters showed small biases (i.e. deviation from 100% accuracy) for AF presented in 15 and 24 mm cups. Sample cup diameter 10 mm had the biggest bias. Sample cup diameter 15 mm had the best AF and precision even with low mass compared to other sample cup diameters 24 and 10 mm. Pellets however showed better accuracies for low Z elements. All low atomic number elements like Na and Mg should be analyzed as pellets not powder. As concerns the accuracies with respect to the Z of each element, there appeared to be a somewhat random dispersion of the accuracies although the biases were not high for the higher Z elements indicating that for these elements on the whole, the FOMs were good. 13Al showed a good AF in the present work even in powder form; hence 13Al analysis using powder is acceptable. In case of 98a-Plastic Clay, it has a wider elemental range than GSS-1 and hence a more complex matrix. In it, 56Ba, 24Cr, and 15P have low concentrations (Table I). The low Z of P implies that pellets should preferably be used for its analysis to achieve better AFs. The 22Ti K-line could possibly have interference from the 56Ba L-line (Namowicz et al., Reference Namowicz, Trentelman and McGlinchey2009) because of it being within the detector resolution (~160 eV). High elemental Z can give a good AF even if the concentration is low because of the inherently better N ij (Section A).
XRF companies make sample cups of different diameters (24, 15, and 10 mm) of slightly different shapes. In the present work, the sample cup diameter of 24 mm (Spectro Analytical Instruments, Kleve, Germany) had a cylindrical shape. On the other hand, the sample cups with diameters 15 and 10 mm were made by Chemplex Industries, Inc., Florida, USA. The 15 and 10 mm diameter sample cups are double cells with conically shaped interior sample chambers terminating into cylindrical tubes that mimic conventional funnels when viewed sideways. The sample cup apertures are governed by the diameters of the cylindrical tubes. Note that the shape for sample cup diameter 15 mm is a little bit different from sample cup diameter 10 mm. The unique shapes of sample cup diameters 24, 15, and 10 mm have been made after years of experience and extensive research and development by the companies.
Geometric effects are caused by the sample's shape, surface texture, thickness, and density. Sample aperture (diameters of the sample cups or the pellets) and sample thickness affect the N ij through factors brought in by the sample volume and the photon collection area presented to the detector, as detailed in the discussion below. Density effects are brought in by the different presentations of the sample: powder or pellet. Standard-less FP for SPECTRO XEPOS III therefore has separate programs for sample cup powders and pellet diameters.
The point of impingement of the primary X-ray on the sample's surface is referred to as the focal spot. In most cases, the focal spot is ovate due to the angle of incidence of the primary X-ray. Some instruments incorporate a sample rotation provision that tends to average non-circularity differences. The principal concern is to limit and confine the focal spot to within the sample surface area to avoid irradiating the sample cup holding device and unknowingly introducing spectral lines affecting the analysis especially if they are similar to those of investigative interest. It is important to consider an XRF sample cup with an aperture smaller in diameter to the aperture of the sample cup holding device. A problem arose when we tried to fix the sample cup and pellet diameters in the sample cup holder. Smaller diameter (small area) samples were harder to fix in the middle of sample cup holder, and maybe this might contribute (although marginally) to the lower accuracy of the 10 mm sizes.
The X-ray detector sees only some milligrams of material close to the surface of the specimen. As the major precondition for reliable results, this volume has to be representative of the material to be analyzed. The layer on the sample surface, which emits X-rays, can be less than 1 µm for light elements in a heavy matrix. For heavy elements in a light matrix, the penetration of the X-rays can go up to several centimeters. Standard-less FP methods are able to correct for sample geometry, mass, thickness, and areal density. Areal density (m/A) can be easily defined by the diameter and mass of the specimen, or by thickness and density. According to the Eq. (8), a high mass (4 g) increases the areal density for a constant area (A) consequently, F(λ), and the matrix self-absorption will increase as also the number of background (scattered) X-rays. The last two reduce the S/N of the analyte element's X-rays (loss factors). If the analyte is a heavy element in a light element matrix, then the increase of F(λ) will dominate (uptill a limit) and the count-rate and AFs will increase. If on the other hand the analyte is a light element and the matrix is heavy then the factors of matrix self-absorption and background could dominate and the accuracy would decrease. This is the case for Na and Mg particularly in the 98a-Plastic Clay for relatively large sample masses and large thicknesses (Table V). When the masses are reduced as in the 10 mm diameter sample cup (Table V) or in the case of the 0.5 g fixed mass of sample (Table VII) the F(λ) factor is reduced as well as the loss factors, that produce the best FOM for the 10 mm diameter (Table V) and for ≤15 mm for the fixed low mass of 0.5 g, in the case of Na and Mg. Thus a control of the mass can reduce or increase the accuracy.
Specimens which do not cover the whole open area of a sample cup are more difficult to analyze. The intensity of the primary radiation coming from the X-ray tube is not homogeneously distributed over the irradiated area. The exact size of the irradiated specimen area may not be known. Additionally irregularly shaped samples may not be flat, so the distance to tube and detector will not be known for some parts of the sample. Powders in the sample cup diameter 24 mm with low mass (0.5 g) likely suffered from the inhomogeneous distribution over the sample cup area.
Increasing the sample mass (thickness) probed by the X-ray will result in higher fluorescence intensity and lower detection limit up to a certain extent. For much thicker samples, however, the background will increase drastically, leading to worse detection limit. This implies that a minimum detection limit can be found as a function of sample thickness.
The volume of the sample from which X-rays are produced is known as the X-ray production volume or X-ray generation volume. The size and dimensions depend on the X-ray line being excited and the density of the material. The distribution of the X-ray trajectories is contained within the so-called interaction volume, whose shape and dimensions are strongly affected by both the atomic number (Z j) for the elements inside the sample and the incident energy of the X-ray. For a given sample elemental composition and incident X-ray energy, the X-ray generation volume will be guided by the volume of the sample which in turn, depends on the sample diameter and thickness. Larger diameter and thickness will produce larger volumes or in other words larger sample mass. The dependence of F(λ) on the sample mass to area ratio or its areal density in connection with Eq. (8) has already been discussed. Higher F(λ) contributes to higher N ij or the number of fluoresced photons collected at the detector. However, a larger volume will also mean a greater collection of background scattered photons and a higher self-absorption probability of the analyte fluoresced photons. A trade-off between these mutually opposing effects will determine the sample volume that gives the best FOM, or in other words, the best sample dimensions for a given sample and given incident X-ray energy. In this work, the incident X-ray spot size was 1 mm2 which completely fell within the sample area and generated the X-ray volume. The number of X-ray photons from the sample collected by the detector depends on its active area which was 10 mm2 in the present case. For the two types of SRMs described in this work, the GSS-1 and 98a-Plastic Clay, at the given incident X-ray energy provided by the PEDXRF instrument, the 15 mm diameter sample cup for powders produced the best FOMs, not the smaller 10 mm nor the larger 25 mm, due to this trade-off. Additionally, the shape of the 15 mm cup (on the aperture side that faces the detector) is that of frustum of two right circular cones, which may help to “collimate” the X-rays toward the detector, thus also contributing to the better accuracy. When samples are compacted by pelletization, the density (ρ) increases and so does the areal density (m/A). The two produced opposing effects on the magnitude of F(λ). Additionally, the sample becomes more homogeneous with the reduction of air spaces that exist in the powder form, hence matrix interferences from inhomogeneities are reduced. The increase of density means that the incident X-rays will be absorbed over a smaller thickness and the self-absorption factor will also increase. Hence, both the fluoresced X-rays and scattered X-rays will emerge from a smaller volume of the pellet that faces the detector. The way all these factors affect the number of X-ray photons (both fluoresced and background) that reach the detector will depend on the particular face area of the pellet of the sample material with its specific elemental composition and particle distribution characteristics (size, homogeneity, surface smoothness, etc.). In the case of the SRMs used in the present work, we note that the 25 mm diameter pellet produces the best accuracy for all the elements combined.
For light elements (like Na and Mg) pellets are likely to produce better results for the FOMs. These elements have lower photoelectric absorption cross-sections and their low energy fluoresced X-rays are more likely to be scattered and absorbed by the matrix. The defined shape, and the reduction of matrix interferences by the reduction of surface and bulk inhomogeneity (surface effects have a high influence on light element determination), are beneficial effects in pellets for light element determination as compared to powders. The high and more reproducible areal density means a smaller X-ray generation volume for the light elements with most of the X-rays being collected from the superficial layers of the pellet. Increase of the diameter of the pellet will increase the superficial layer volume but the self-absorption factor (especially high for the light element X-rays) and background factors will also increase. A trade-off between all these factors for the specific material characteristics of the given sample will determine which pellet diameter produces the best FOMs. In our SRMs we note that the 25 mm (without wax) produces the best FOM for Na and Mg in the case of GSS-1 and the 10 mm in the case of 98a-Plastic Clay.
Pellet diameter 25 mm without wax gave the best FOM for all elements combined compared to the 25 mm diameter pellet with wax. Adding wax lowers the density of the pellet (Table III) that reduces the areal density for the 25 mm size. The low Z elements in the wax also contribute to higher scattering background. Both these factors contribute to the reduction of accuracy of the 25 mm pellet with wax.
In the present work for both types of SRMs a general “enhancement” of the AF is noticed when the sample diameter increases for both powder (sample cup) and pellet (Tables V–VII). This could be a spurious effect. With increase of diameter both the analyte X-ray and background counts increase. An underestimation of the background below the peak by the TQ software would produce a spurious enhancement of peak counts leading to the aforesaid accuracy “enhancement”. For the light elements Na and Mg, the “enhancement” effect is much larger. This could be due to the enhancement of the analyte X-rays by secondary excitations, or the cascade effect (Kawahara, Reference Kawahara, Beckhoff, Kanngießer, Langhoff, Wedell and Wolff2006). Photoelectrons or characteristics X-rays that could be the lower energy L X-rays from the heavier elements in the matrix, could secondarily produce the fluorescent X-rays from the light elements. Photo and Auger-electrons with relatively high energies cause a long sequence of ionizations and excitations compared to the primary photoelectric excitation of the light atom, which is basically a single-event process, and these electrons may further enhance the fluorescence of light elements in a heavy element matrix (Kawahara, Reference Kawahara, Beckhoff, Kanngießer, Langhoff, Wedell and Wolff2006). Such effects need to be adequately accounted for by the analytical software in the case of the light elements.
Pellet diameter 25 mm had the best FOM compared with sample cups. The amount of mass needed for the sample cup diameter 15 mm is 1.4 g with ability to reach 0.5 g with high accuracy, while in pellet diameter 25 mm the mass is 4 g. If the amount of the sample is less than 1.5 g, most probably pellet diameter 25 mm cannot be applied. Pellet making consumes time and some samples need a binder. By analyzing powder samples the throughput of the samples will increase. Increase of the throughput of sample analysis increase the revenue and reputation of commercial analytical laboratories. We also see that sample cup diameter 10 mm is necessary for very small masses ≤0.3 g depending on the type of sample and analytes of interest.
In summary, from the discussion above on the measurements conducted in the present work we note that the optimization of the mass, thickness, density, and sample geometry for a specific sample type can improve the FOMs of analysis by the given PEDXRF instrument.
V. CONCLUSION
PEDXRFS has high AF and precision (FOMs). The way of preparing the samples could be critical for the accuracy. Pellet diameter 25 mm gave the best FOMs compared to other pellet and sample cup diameters. Indeed, pellets gives better FOMs for low Z elements, e.g. Na and Mg, compared with loose powder sample cup diameter 15 mm gave the best FOMs compared to other sample cup diameters. In any laboratory, sample cup diameter 10 mm is essential for small mass amount (<0.3 g), especially for environmental or biological samples which are difficult to obtain in quantity or are expensive. In general, sample cups (powder) are used in laboratories more than pellets; pellets are time consuming, beside some samples need a binder, and because of the binder, the sample cannot be used again in a different analytical technique or research. Sample cup diameter 15 mm (powder) gives better AF than pellet diameter 25 mm with wax. For high throughput samples of soils and ceramics as demonstrated in the present work, the sample cup (powder) diameter 15 mm is our first choice, because it does not need a big mass (1.4–0.5 g), high skills, and the preparation is easy and fast. From our results, we recommend using sample cup diameter 15 mm more than 24 mm for soil and ceramic samples.
ACKNOWLEDGEMENTS
The authors thank Dr Sandra Leticia Bribiesca Vázquez of the Institute of Metallurgical Research (IIM-UMSNH) for providing the NIST SRMs and Dr Salomón Eduardo Borjas García of the IFM-UMSNH for technical support. This research would not have been possible without the financial support of the Consejo Nacional de Ciencia y Tecnología (CONACYT) of Mexico to W. A. Abuhani for his doctoral studies (scholarship number 350251).