Introduction
Periodically checking the beam quality is an integral part of quality assurance management in a radiotherapy department.1, 2 The use of an appropriate quality control (QC) methods to adequately assess the photon beam quality can be a challenge for medical physicists, because to verify the dosimetry quality the procedure that has been followed must be as accurate as possible. On some occasions, after assessing the beam quality, minor calibrations can be made without introducing any functioning perturbation of the Linac head.Reference Uddin3 The required QC programmes have been published by different international or national authorities that recommend a fixed period of time in checking the dosimetry output quality based on absorbed dose measurements for the Linac head calibration. The International Atomic Energy Agency (IAEA) and the American Association of Physicist in Medicine (AAPM) recommend assessing the beam quality using the percentage depth dose (PDD) parameter.4, Reference Almond, Biggs and Coursey5
With reference to PDD, both the international bodies recommend not assessing the beam quality before the depth of 10 cm, whatever be the photon beam energy, in order to avoid measuring electron contamination even though this is an integral part of the incident photon beam. The beam quality index is an essential parameter used in beam quality assessment in radiotherapy treatment, but it should be considered in overall PDD variation.Reference Klein, Hanley and Bayouth6 Earlier, Otto had worked on the determination of a quality index for photon beams of arbitrary field sizes in treatments where the reference calibration conditions could not be met; however, the accuracy of this index was not rigorously checked.Reference Otto7
This study aims to find a new approach for the investigation and evaluation of dosimetry quality of the incident photon beam based on PDD sub-divisions or PDD fragmentation by examining all the dosimetric properties of PDD sub-regions. This new approach allows to check the beam dosimetric quality at any depth and of any field size by including all dosimetric particularities of all PDD sub-regions starting from the skin dose to exit dose. We consider that it is necessary to include the dosimetry measurements due to electron contamination and region of low photon energy in the beam quality procedure to ensure accuracy of the treatment. Electron contamination and low photon energy are always present in the incident photon beam and if not measured, it is considered as a procedural weakness.
This study is performed based on previous work, in which we studied the photon beam quality and the impact of particle contamination on beam quality, when the flattening filter is removed from the Linac head.8–10 For any new Linac technological development, the evaluation procedure of the beam quality should be reviewed in order to assure a high degree of accuracy in dosimetry evaluation.
Materials and Methods
The dosimetry quality assessment is crucial to ensure radiotherapy quality and accuracy. The IAEA TRS 398 recommends assessing the beam quality index using tissue phantom ratio (TPR) as a quotient of PDD at a depth of 20 cm to 10 cm for field size of 10 × 10 cm2. However, the AAPM Task Group 51 recommends assessing the beam quality as per PDD at a depth of 10 cm by using a lead slab at the exit window of Linac head of thickness x which varied with photon beam energy to remove electron contamination.4, Reference Almond, Biggs and Coursey5
These protocols allow the evaluation of the beam quality at a depth of 10 cm whatever be the photon beam energy and aim to avoid electron contamination and low photon energy. This avoidance can have negative impact on the accuracy if there is an abnormal functioning of a beam modifier in the Linac head. In fact, electron contamination and low photon beam energy are an integral part of the photon beam and are always present in the incident beam.
Measurements of PDD
In this study, dose measurements are measured for two photon beam energies, 6 and 18 MV, produced by Varian Clinac 2100 (Varian, Palo Alto, CA, USA). These beam energies are more commonly used in clinical practice. The measurements were performed in a water phantom of volume 40 × 40 × 40 cm3, as recommended by the Swiss Society of Radiobiology and Medical Physics (SSRMP).11
The PTW 30013 chamber (Physikalisch Technische Werkstätten (PTW) Freiburg, Germany) was used for the PDD measurements of both 6 and 18 MV photon beams. MEPHYSTO software (PTW, Freiburg, Germany) was used to drive the ion chamber for data acquisition at increments of 2·5 mm in depth. All PDD measurements were carried out under conditions of temperature of 20°C and the pressure of 101·3 Pa and humidity of 50%. The uncertainty of PDD measurements was found to be <2% and this included all the uncertainties of experimentation and the uncertainty of the measurements of the devices used.
According to IAEA TRS 389, the PDD measurements are measures and the PDD curve is formed by three regions: build-up dose region, electronic equilibrium region and exponential decay region. Figure 1 illustrates the PDD sub-regions of 6 MV photon beam for field size of 10 × 10 cm2.
PDD variation as a function of depth for 6 MV photon beam.

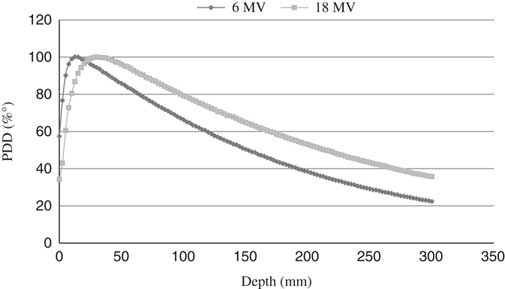
To demonstrate the PDD dependence on beam energy, Figure 2 gives the PDD variation in two photon beam energies of 6 and 18 MV for field size of 10 × 10 cm2.
PDD variation as a function of depth for two photon beam energies.

It is obvious from Figure 2 that PDD varies with photon beam energy for the same irradiation field size. The depth of maximum dose of 6 MV photon beam is at 1·5 cm and the depth of maximum dose of 18 MV photon beam is at 3 cm.
PDD fragmentation
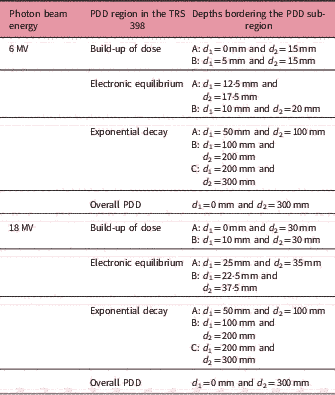
The PDD fragmentation is aimed to investigate the dosimetric particularities in each PDD fragment of the PDD curve from the skin dose (depth = 0 mm) to exit dose (depth = 300 mm). This approach included the dosimetric properties of all PDD sub-regions and it was not restricted to the dosimetric properties of one sub-region of the exponential decay region, as recommended by IAEA TRS 398 and AAPM TG 51. To accurately investigate the overall dosimetric properties of the PDD, the PDD curve was sub-divided into seven sub-regions. In agreement with TRS 398, the PDD sub-region was measured from 10 to 20 cm. Table 1 presents the depth intervals of seven PDD sub-regions for both photon beam energies, 6 and 18 MV.
Depth intervals of each PDD sub-region

We have introduced an investigation parameter Q based on the PDD method that was used in earlier studies.Reference Lye, Butler and Oliver12, Reference Silvia and Francisco13 The PDD method is expressed as an empirical formula relating the TPR and PDD as follows:
 ${\rm{TP}}{{\rm{R}}_{20,10}} = 1.2661;\quad {\rm{PD}}{{\rm{D}}_{20,10}} = - 0.0595$
where,
 ${\rm{PD}}{{\rm{D}}_{{\rm{20}},{\rm{10}}}} = {{{\rm{PD}}{{\rm{D}}_{{\rm{20}}}}} \over {{\rm{PD}}{{\rm{D}}_{{\rm{10}}}}}}$
In Equation (2) we have generalised for seven PDD sub-regions instead of one region as required in TRS 398, where the bordering depths are 20 cm and 10 cm. Equation (3) calculates the investigation parameter Q using the formula:
 ${Q_{{d_2},{d_1}}} = {{{\rm{PD}}{{\rm{D}}_{{d_{\rm{2}}}}}} \over {{\rm{PD}}{{\rm{D}}_{{d_{\rm{1}}}}}}}$
where d 1 and d 2 are the depths bordering the PDD sub-regions and d 1 < d 2.
After determining the parameter Q for each PDD sub-region, normalisation of Q is introduced to standardise the parameter variation with each photon beam energy and to conceal the dependence on the beam energy. The normalised Q is symbolised by  $\overline{Q}$ and it is defined as a quotient of Q of each PDD sub-region to Q of overall PDD. The
 $\overline{Q}$ is expressed in Equation (4) as follows:
 $\overline Q = {{{Q_{{d_2},{d_1}}}} \over {{Q_{0,300}}}}$
where  $Q_{{d_{2} ,d_{1} }} $ for a PDD sub-region ranges from d 1 to d 2;
 $Q_{{0,300}} $ is the overall PDD curve.
Results and Discussion
Build-up dose quality analysis
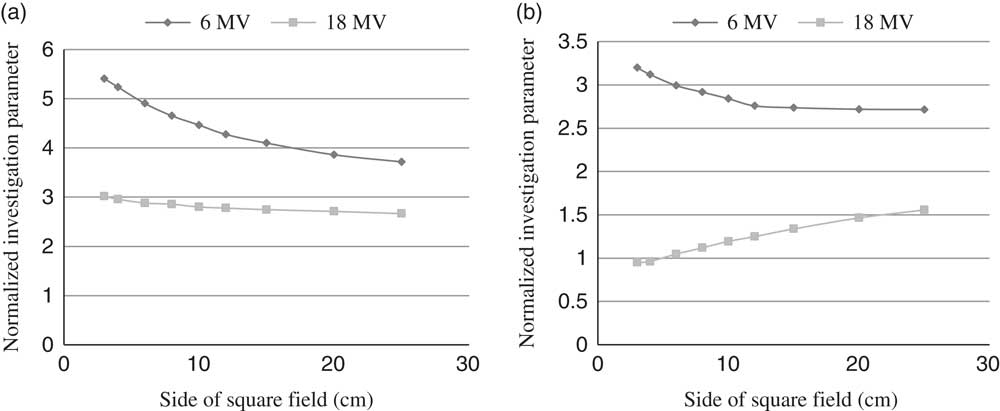
The build-up dose region ranges from 0 mm to depth of maximum dose. In this region, the PDD is fragmented into two sub-regions, as shown in Table 1; therefore, the dosimetry quality is investigated by calculation of  $\overline{Q}$ on two depth intervals A and B (Table 1).
Figure 3 shows  $\overline{Q}$ variation as a function of irradiation field size in two sub-regions of the build-up dose region.
 $\overline{Q}$ variation for build-up dose region as a function of field size.

From Figure 3, the normalised  $\overline{Q}$ is above 1 for both photon beam energies of 6 and 18 MV. It means that the photon beam delivers the majority of its energy in the build-up dose region. So, in case A, the
 $\overline{Q}$ value decreased rapidly with field size, whereas in case B, the
 $\overline{Q}$ value decreased slowly with field size.
Here we have demonstrated that the build-up dose varies with beam energy and field size. The photons of the lower energy (6 MV) deposit more energy in this region than the photons of a high energy (18 MV). This dependence on photon beam energy should be included in the evaluation procedure of the beam quality.
Electronic equilibrium quality analysis
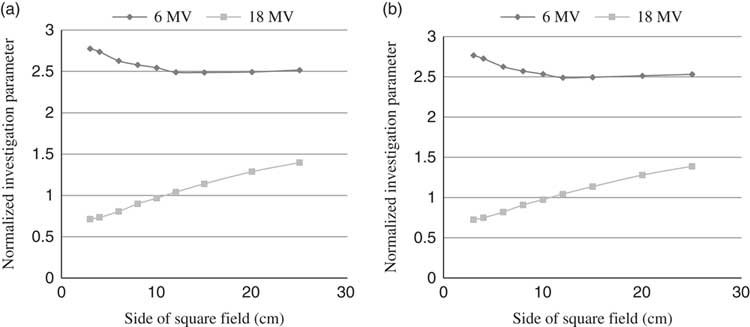
The electronic equilibrium region ranges on bordering regions of maximum dose. Figure 4 shows the variation in  $\overline{Q}$ in the electronic equilibrium region as a function of field size for photon beam energies of 6 and 18 MV.
 $\overline{Q}$ variation for electronic equilibrium region as a function of field size.

It can be observed from Figure 4 that in the electronic equilibrium region, the  $\overline{Q}$ decreased slightly in field size for 6 MV photon beam for small field but it is approximately constant for field size greater than 12 × 12 cm2, but the
 $\overline{Q}$ value increased with field size for 18 MV photon beam (Figure 4). These discrepancies can be used as a basis to assess the photon beam quality in the electronic equilibrium region. Again, the dosimetry quality has shown that it varied with photon beam energy and also with field size. It varied from one sub-region of PDD to another (Figures 3 and 4).
Exponential decay quality analysis
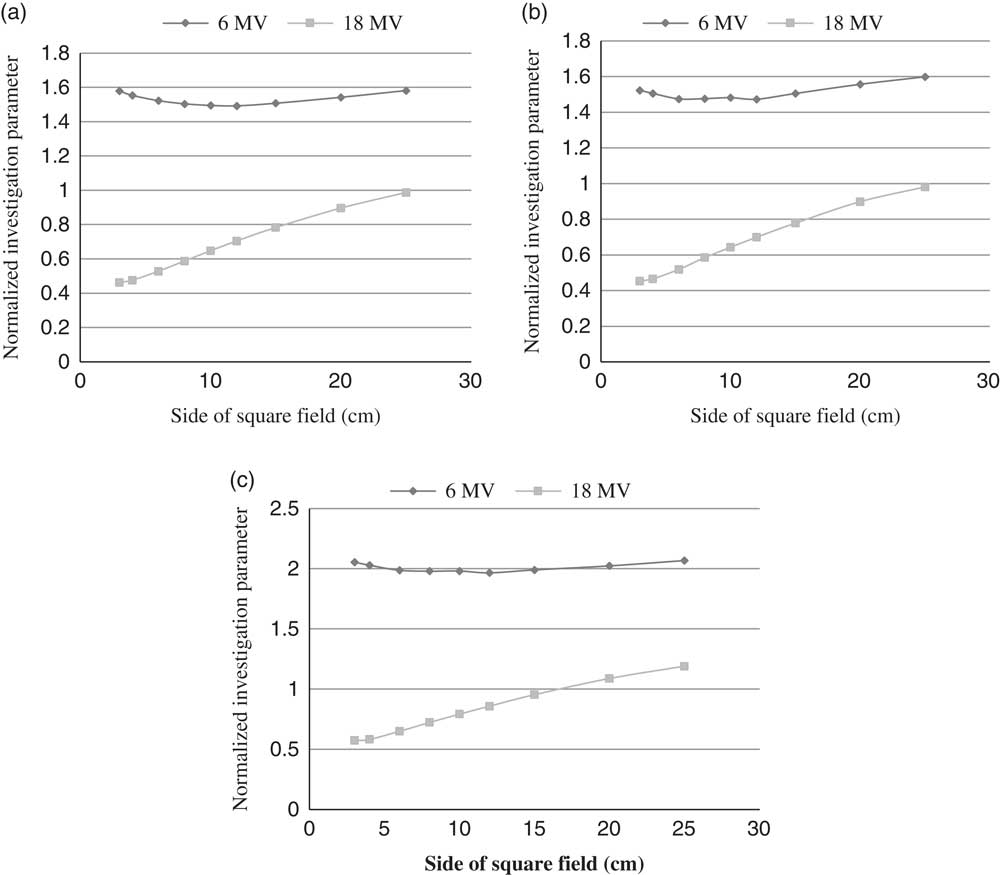
The exponential decay region ranges from depth of maximum dose to exit dose (depth of 300 mm). It is characterised by exponential photon beam attenuation with depth. The beam quality index is calculated on this PDD sub-region as recommended by IAEA TRS 398 protocol.Reference Lye, Butler and Oliver12 In our study, we have determined the parameter  $\overline{Q}$ for three sub-regions in the exponential decay region.
To understand the dosimetric properties in the exponential decay region with field size and the overall PDD for both photon beam energies 6 and 18 MV, the parameter  $\overline{Q}$ is determined for three sub-regions of the PDD.
Figure 5 presents the  $\overline{Q}$ variation in the exponential decay region with field size.
 $\overline{Q}$ variation for exponential decay region as a function of field size.

It can be seen from Figure 5, the dosimetry quality varied with depth in the exponential decay region and is not limited to middle regions, as recommended by IAEA TRS 398 protocol.  $\overline{Q}$ is located above to 1 for 6 MV and below 1 for 18 MV.
As a generalisation of our approach, for a photon beam with energy <6 MV, we found a  $\overline{Q} $ value >1 and for a beam with an energy >18 MV, the
 $\overline{Q}$ value is <1 in the overall exponential decay region for field size less than 15 × 15 cm2. However, IAEA TRS 398 and AAPM TG 51 limit the beam quality determination on field size of 10 × 10 cm2.Reference Lye, Butler and Oliver12 On the basis of these results, we were able to make a distinction between photon beams used in radiotherapy treatment at any field size smaller than 15 × 15 cm2 and at any sub-regions of exponential decay region. For example, the 6 MV photon beam has
 $\overline{Q}$ value >1 and the 18 MV photon beam has
 $\overline{Q}$ <1 (Figures 5a–5c).
Conclusion
The findings of this work are based on an experimental study of beam quality by introducing a new approach based on fragmentation of PDD curves into seven sub-regions. On the basis of the proposed approach, we can assess the dosimetry quality by taking into account overall PDD not only in the exponential decay region but also in the field. This new approach of the beam quality assessment is more accurate than in current calibration methods as recommended by the IAEA and AAPM.Reference Silvia and Francisco10
According to this new approach, the 6 MV photon beam is more dosimetric efficient than an 18 MV photon beam.
Acknowledgements
The authors would like to thank Varian Medical Systems who provided us with the Varian Clinac 2100 dosimetry data and afforded the opportunity to study the Varian linear accelerator technology and to contribute to its future development.