

INTRODUCTION
Canada is following an international move to include Screening for Distress as part of comprehensive cancer care. In 2009, a national working group was created under the auspices of the Canadian Partnership Against Cancer (CPAC; a program funded by the federal government), whose focus is to facilitate the implementation of a pan-Canadian strategy embedding distress as the sixth vital sign to be routinely screened for in cancer care (Canadian Partnership Against Cancer, 2008). Systematic Screening for Distress is seen as a major change in healthcare culture, with the aim of achieving person-centered care (Canadian Partnership Against Cancer, 2009). Caring for the whole patient involves attending to his or her needs not only within the physical domain but also the psychosocial, functional, spiritual, and practical realms, thus taking into consideration the full range of consequences related to the cancer experience. Screening for Distress, which involves further assessment and intervention that targets the specific needs of patients, is now considered essential for well-coordinated and comprehensive cancer care.
Numerous articles have described the rationale and benefits of endorsing distress as the sixth vital sign (Rebalance Focus Action Group, 2005; Bultz & Carlson, Reference Bultz and Carlson2006; Bultz & Holland, Reference Bultz and Holland2006; Holland & Bultz, Reference Holland and Bultz2007). In addition, some research has emphasized the challenges of implementing a systematic screening program within busy oncology settings (Watson & Bultz, Reference Watson and Bultz2010; Absolom et al., Reference Absolom, Holch and Pini2011; Bultz et al., Reference Bultz, Groff and Fitch2011; Dolbeault et al., Reference Dolbeault, Boistard and Meuric2011). Several other articles have been aimed at describing the prevalence of distress and the type of concerns of patients across various tumor sites and stages of the disease (Zabora et al., Reference Zabora, BrintzenhofeSzoc and Curbow2001; Carlson & Bultz, Reference Carlson and Bultz2004; Carlson et al., Reference Carlson, Angen and Cullum2004; Graves et al., Reference Graves, Arnold and Love2007; Carlson et al., Reference Carlson, Groff and Maciejewski2010; Senf et al., Reference Senf, Brandt and Dignass2010; Dolbeault et al., Reference Dolbeault, Boistard and Meuric2011; van Scheppingen et al., Reference van Scheppingen, Schroevers and Smink2011). In several studies, distress is conceptualized principally as psychological distress, and their focus was to assess the prevalence of anxiety and depression (Frick et al., Reference Frick, Tyroller and Panzer2007; Neilson et al., Reference Neilson, Pollard and Boonzaier2010). This article takes a complementary approach. First, it adopts the definition of distress formulated by the National Comprehensive Cancer Network: “an unpleasant experience of a psychological, social, and/or spiritual nature that interferes with the ability to cope with cancer, its physical symptoms, and its treatment” (National Comprehensive Cancer Network, 2010). This definition opens the door to a multidimensional understanding of patients' distress and the unmet needs that could trigger it. Second, this study is part of an effort to evaluate the quality of a clinical change of practice, namely, the implementation of routine Screening for Distress by nurse navigators. The aim of this article is threefold: (1) to document the characteristics of patients in terms of prevalence of distress, problems, and symptoms that they report, in addition to the support they want versus the support they are offered at the time of their first meeting with nurse navigators; (2) to identify the factors that are the most strongly associated with distress; and (3) to verify whether the cutoff score used to orient patients on the basis of their reported distress is optimal.
Data presented here were collected at a university tertiary care hospital, a major center situated in Quebec City treating >5000 cancer patients per year from all over the eastern part of the province of Quebec. Quebec City is one of Canada's early adopter jurisdictions taking part in the national strategy on Screening for Distress, the 6th Vital Sign. Routine monitoring for distress is now stated as a standard of practice in cancer programs in Canada and, progressively, in the province of Quebec (Accreditation Canada, 2009; Direction de la lutte contre le cancer, 2011). Implementation of Screening for Distress within our jurisdiction was based on the National Comprehensive Cancer Network (NCCN) recommendation to “screen patients from all cancer sites at point of entry and critical time points over their cancer journey” (National Comprehensive Cancer Network, 2010). Screening was implemented in our center's ambulatory oncology clinics at three of these points: close to diagnosis, at initiation, and at mid-term of radiation treatment. Work is also in progress to implement screening at initiation (or change of protocol) of chemotherapy. Screening is performed by a nurse, except at the mid-term of radiation, when technicians are involved, all of them using a paper version of the questionnaire.
The process of implementation was phased in gradually and the first stage involved all 10 nurse navigators of our center. They integrated screening as part of their routine care at the moment of their first meeting with patients, which generally occurs close to the diagnosis or announcement of a recurrence. Screening for Distress is largely consistent with the nurse navigators' professional role, which includes making an in-depth initial assessment of patients' needs and planning further actions or interventions accordingly. This is a major reason why nurse navigators were chosen to pioneer the first stage of implementation: because Screening for Distress could easily be integrated in their professional role and they were ready to adopt this change of practice. Throughout the implementation phase, several timely activities aimed at promoting Screening for Distress, training, and support were held among nurse navigators, such as individual and group meetings. These were accompanied by the ongoing clinical supervision of the Screening for Distress coordinator (e.g., phone discussions related to specific clinical situations).
Initially, our team performed a qualitative pre-post study on the implementation of Screening for Distress with nurse navigators (Fillion et al., Reference Fillion, Cook and Blais2011). Although a number of reservations were expressed by managers and frontline staff (including the navigators themselves) prior to the implementation, these persons also described positive implications for patients, continuity of care, and interprofessional collaboration at post-implementation. In line with a recent article on a national change management strategy for integrating Screening for Distress into clinical practice (Watson & Bultz, Reference Watson and Bultz2010), several recommendations were made on how to address barriers and facilitate clinical uptake. For example, frontline staff (as well as managers) often expected that a large proportion of patients would report a high level of distress and, therefore, they worried about the prospect that the implementation of screening into routine care might lead to an explosion of referrals to limited psychosocial resources. As a strategy to address this concern, several cutoff scores have been proposed for the purpose of identifying distressed cancer patients (Roth et al., Reference Roth, Kornblith and Batel-Copel1998; Gil et al., Reference Gil, Grassi and Travado2005; Ransom et al., Reference Ransom, Jacobsen and Booth-Jones2006; Ozalp et al., Reference Ozalp, Cankurtaran and Soygur2007; Vitek et al., Reference Vitek, Rosenzweig and Stollings2007; Bulli et al., Reference Bulli, Miccinesi and Maruelli2009) and eventually designing care pathways accordingly. However, the cutoff scores that have been proposed in the literature may vary, depending upon the population and setting among which the studies were conducted. Moreover, there is still limited knowledge about how to integrate these findings into clinical practice. With regard to designing localized care pathways for action based on the screening results, our team had to select a cutoff score by combining these divergent and somewhat confusing data. We had to move forward without knowing whether the selected cutoff score would be optimal. We therefore realized that there was the need for descriptive data about the characteristics of patients screened for distress as part of routine care. The empirical data from this article could constitute valuable feedback for the purpose of implementing and managing this change of practice by answering a practical question: What to do with the scores obtained from the Screening for Distress Tool?
METHODS
Design
This study evaluates the quality of the first implementation phase of Screening for Distress within our facility. As such, completing the distress questionnaire was not part of a typical research project for patients but part of their routine cancer care. More specifically, data used in this cross-sectional retrospective descriptive study were collected from November 2009 to June 2011.
Participants
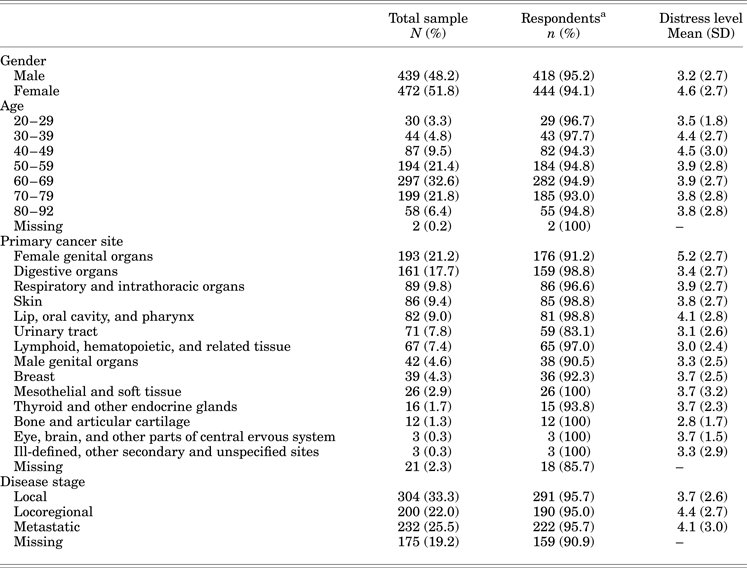
The sample comprised 911 patients (472 women and 439 men, all French-speaking and the great majority Caucasians) who were Screened for Distress by a nurse navigator at the initial phase of the care process: following diagnosis (23%), at the time of pre/post surgery (47.8%) or initiation of chemotherapy with adjuvant or palliative intent (40.6%), or other time points during the care trajectory (16.5%).Footnote 1 This sample included patients with a mean age of 61 years old (SD =13.64; range, 20–92) from all cancer sites at diverse stages of the disease (Table 1). The total number of Screenings included in the sample is 922, as 11 patients were screened twice.Footnote 2
Distress level on the Distress Thermometer (DT) by patient characteristics (n = 911)

aPatients who reported their distress level on the DT. The 11 patients who were screened twice (as required by their clinical situation) are calculated only once in this demographic data.
Instruments
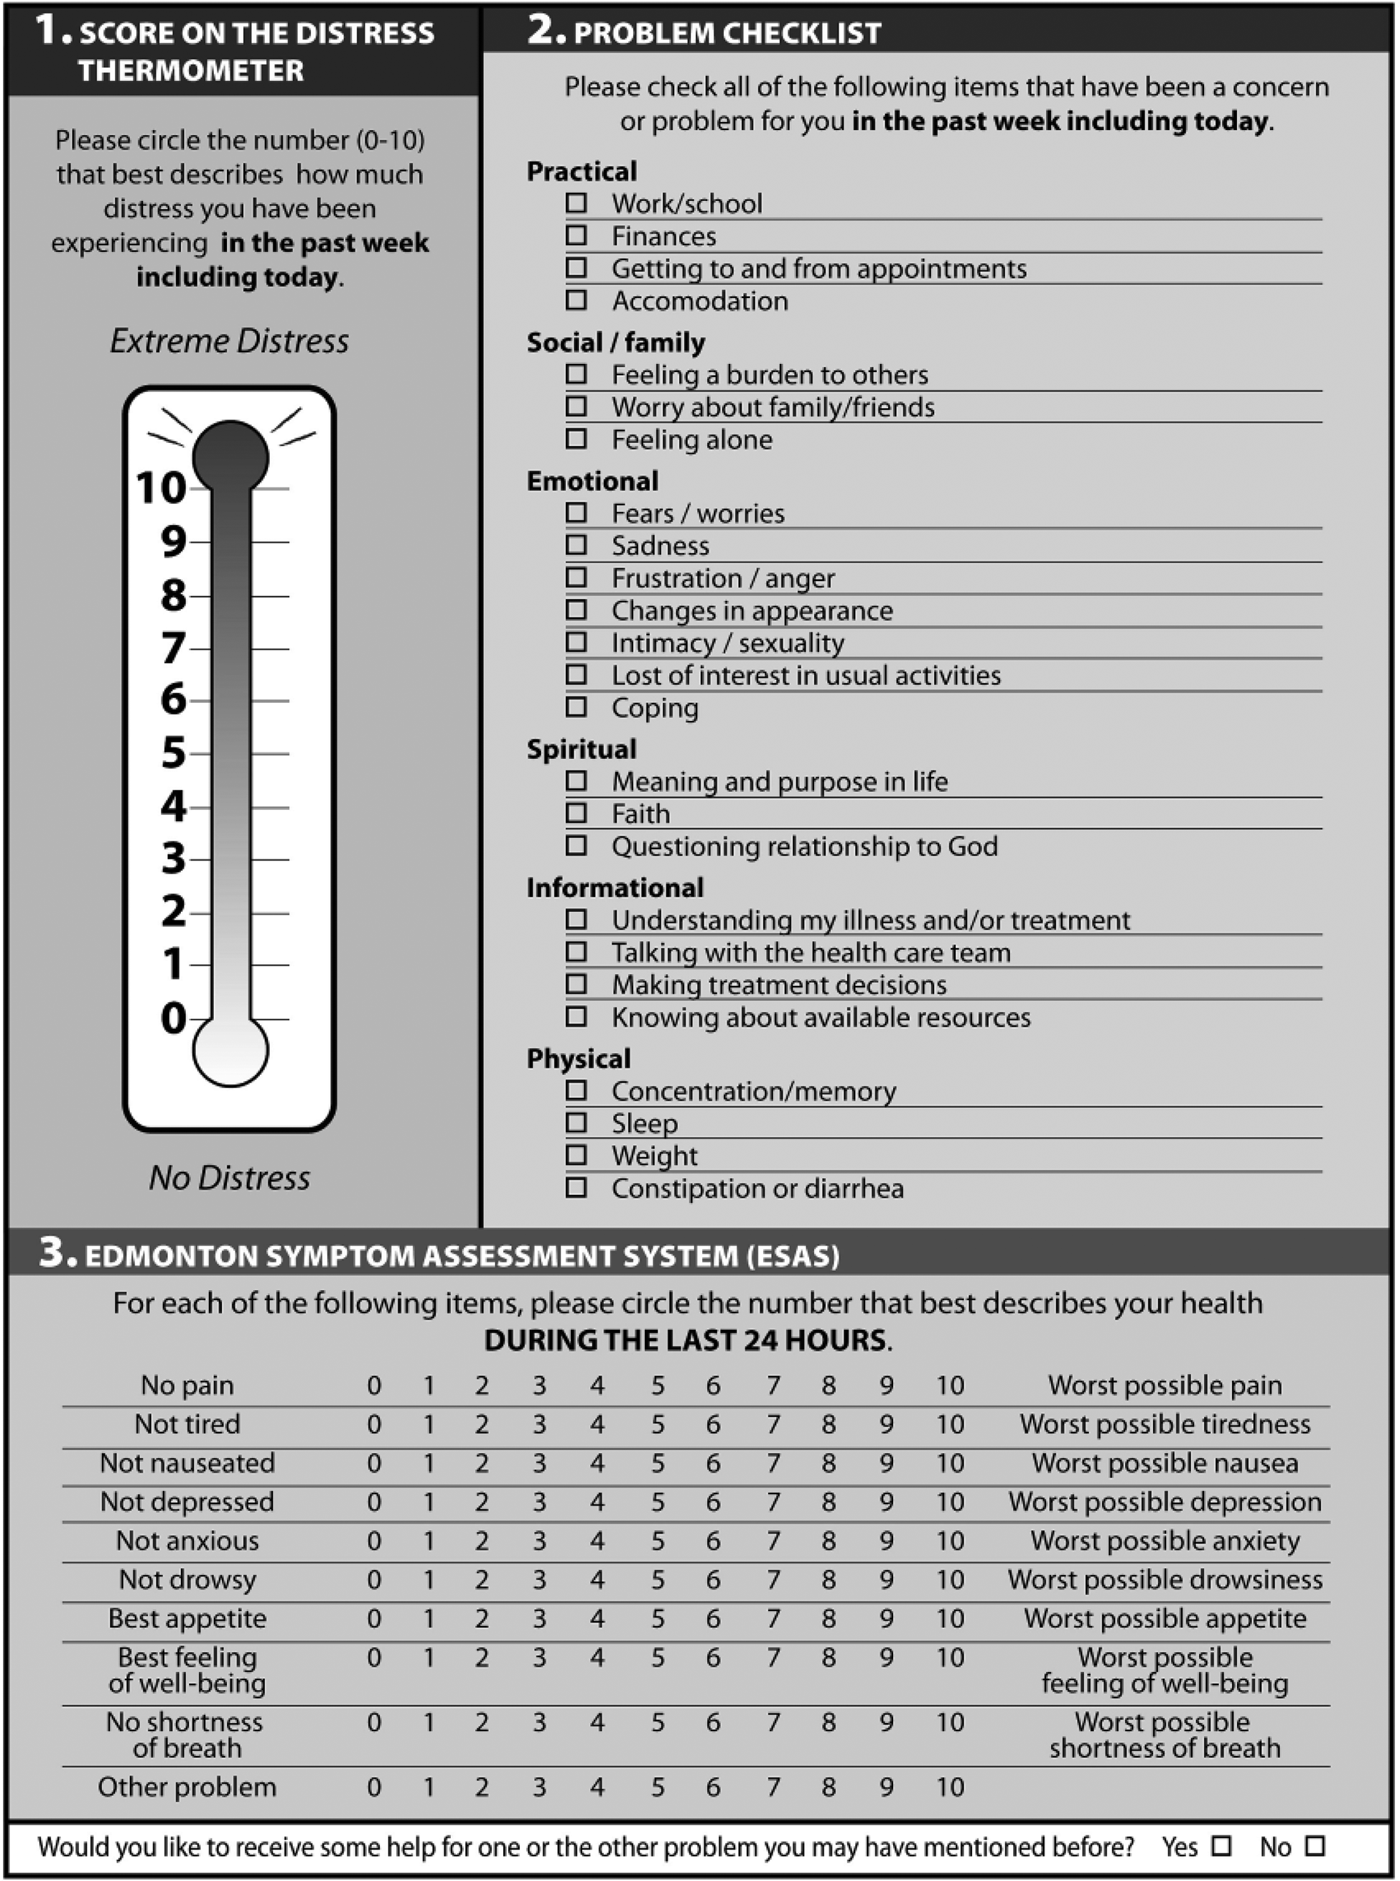
The Screening for Distress Tool (hereafter the Screening Tool), illustrated in Figure 1, is a paper questionnaire that includes the Distress Thermometer (DT) and the minimum data set recommended by CPAC's national implementing group (Canadian Partnership Against Cancer, 2009). These are the Canadian Problem Checklist (CPC) and the Edmonton Symptom Assessment System (ESAS).
Screening for Distress tool.
DT
The DT is a one item instrument measuring distress on an 11 point (0–10) rating scale, with 0 meaning no distress and 10 meaning extreme distress. Patients are asked to report on this scale their level of distress during the past week, including the day the questionnaire is administered. Based on data from the literature (Grassi et al., Reference Grassi, Nanni and Caruso2010) and consensus among clinicians within our facility, a cutoff score of ≥5 was selected to indicate a high level of distress. Although the DT is not part of the minimal data set recommended by CPAC, the Quebec jurisdiction included it in its Screening questionnaire, as it is endorsed by the NCCN Distress Practice Guidelines (National Comprehensive Cancer Network, 2010) and is highly valued among the clinicians of our team. This tool is widely used in cancer centers (Jacobsen et al., Reference Jacobsen, Donovan and Trask2005) and has been translated and validated in French (Dolbeault et al., Reference Dolbeault, Bredart and Mignot2008).
CPC
The CPC is a list that contains 21 psychosocial, practical, physical, spiritual, and informational concerns (Ashbury et al., Reference Ashbury, Findlay and Reynolds1998; Fitch, Reference Fitch2008). This list is based on problems frequently reported by oncology patients, and is modified from the NCCN list of common problems. Patients are asked to check all the concerns/problems they experienced within the past week (including the day of screening). Our French-adapted version of the CPC included the minimal data set recommended by CPAC, to which we added four items: loss of interest in activities, coping with the disease, questioning my relationship to God, and constipation/diarrhea. The rationale for this addition was to better match the specific needs expected within our population with the clinical resources available within our facility. This addition was performed following a round of peer consultation involving several types of professionals from our oncology interdisciplinary team.
ESAS
The ESAS is the most commonly used screening tool across Canada (Bruera et al., Reference Bruera, Kuehn and Miller1991; Linden et al., Reference Linden, Yi and Barroetavena2005). It is a valid and reliable tool that screens for nine common symptoms experienced by cancer patients (pain, tiredness, nausea, depression, anxiety, drowsiness, appetite, lack of well-being, and shortness of breath). Patients are asked to rate the severity of each symptom for the past 24 hours on a numerical scale from 0 (absence) to 10 (severe). A systematic review of cancer symptom assessment instruments showed that the ESAS is a psychometrically sound instrument (Kirkova et al., Reference Kirkova, Davis and Walsh2006). The ESAS has been validated in a variety of populations, including both advanced cancer populations and among patients earlier in the cancer trajectory (Chang et al., Reference Chang, Hwang and Feuerman2000; Nekolaichuk et al., Reference Nekolaichuk, Watanabe and Beaumont2008).
Procedure
Patients are screened for distress as part of routine care, on an individual basis, at their first encounter with a nurse navigator. This meeting commonly takes place close to diagnosis or surgery, but can also happen at the beginning of anti-cancer treatments, depending upon the oncologic treatment guidelines of each tumor site. Patients complete the Screening Tool on their own after receiving instructions and a brief introduction on the purpose of the questionnaire. After the Screening Tool has been filled out, a conversation between the nurse navigator and the patient involves discussion about the concerns the patient reported on the Screening Tool as well as an appropriate response (e.g., information on resources, education/support/symptom management, further assessment, referral to another professional for in-depth assessment/intervention). The scores of a patient on the Screening Tool are interpreted within the context of this conversation. In addition, our implementation committee developed a care pathway to assist professionals and complement their clinical judgement in their decision making. Briefly, a score of ≤4 on the DT and items of the ESAS indicates the need for basic and supportive action by front line staff, whereas a score of ≥5 suggests the need for a referral to more specialized resources for in-depth assessment and intervention. Referrals are tailored to the problems and symptoms identified both on the CPC and the ESAS. The cutoff values selected by our team at the beginning of the implementation of Screening in 2009 were based on literature data (Vignaroli et al., Reference Vignaroli, Pace and Willey2006; Grassi et al., Reference Grassi, Nanni and Caruso2010; Dolbeault et al., Reference Dolbeault, Boistard and Meuric2011; Watanabe et al., Reference Watanabe, Nekolaichuk and Beaumont2011) and consensus among the clinical experts of our team including the nurse navigators. Our decision was also a tradeoff between the best evidence and the need for a greater homogeneity of cutoffs on both the DT and ESAS items, so as to facilitate uptake.
The Screening Tool is entered in the patient's medical chart while a copy transits to our team for compilation of data. The director of professional services of our center authorized the use of these data for evaluative research, because this was perceived to be an essential component in the process of implementing this change of practice. All procedures to ensure confidentiality were applied.
Data Analysis
All analyses were performed using the Statistical Package for the Social Sciences (SPSS) version 13.0 for Windows. A two tailed α probability of <0.05 was considered to be statistically significant.
In order to respond to the first objective, we first conducted descriptive analyses. As a second step, we were interested in knowing whether patients with a high level of distress on the DT were reporting more problems and symptoms. For the purpose of answering this question, t tests and effect sizes were used in order to assess differences between patients with and without a clinical level of distress on the DT. To facilitate comparison among categories of the CPC, the number of problems in each category and the total number of problems were listed as percentages. For symptoms, only data of patients who had completed a minimum of five of the nine items of the ESAS were included in this analysis, using a total scaled score on the ESAS (i.e., score reported on 100). In addition to the traditional p values, we present the effect sizes (Cohen's d), which represent the difference between two groups on a scale expressed in terms of standard deviation. Cohen's d ranging from 0.20 to 0.50 shows a small difference between the two groups, whereas Cohen's d ranging from 0.50 to 0.80 and ≥0.80 shows, respectively, moderate and strong differences (Cohen, Reference Cohen and Cohen1988). Finally, point-biserial and Pearson correlations were, respectively, performed to highlight associations between the Screening Tool components and gender and age, whereas t tests were used to compare patients on their wish to receive help or not.
In order to answer the second objective aimed at identifying the factors that were the most strongly associated with distress level on the DT, a stepwise multiple regression was conducted. Only variables of the Screening Tool showing moderate to strong associations with the DT were included in the model.
The third objective was to assess the appropriateness of the actual cutoff score on the DT. In order to verify whether the cutoff score of 5 that we selected was optimal, we conducted receiver operating characteristic curve (ROC) analyses by plotting the true positive rate (sensitivity) against the false positive rate (1-specificity) for selected cutoff scores. ROC curves assess the impact of varying cutoff scores and indicate which one gives the best combination of sensitivity and specificity. In order to perform the ROC analysis, the selection of a comparison point was necessary. The total scaled score on the ESAS was retained, based on its moderate correlation with the DT (r = 0.56). Following data from a recent literature review suggesting cutoff scores of 3, 4, and 5 on the DT to distinguish patients with clinical distress (Grassi et al., 2010) and based on the fact that no single cutoff criteria has been yet validated to categorize ESAS severity (mild, moderate, severe) (Richardson & Jones, Reference Richardson and Jones2009), we therefore performed ROC curves to compare those three different cutoff scores on the DT to cutoff scores of 30, 40, and 50 on the total scaled score on the ESAS.
RESULTS
Description of Patients' Characteristics
Distress Level
Of the 922 screenings, the level of distress on the DT was reported 873 times. Table 1 shows the Distress level on the DT by patient characteristics. The mean score was 3.9 (SD = 2.8). Using a cutoff score of 5, 37.7% (n = 348) of the patients reported experiencing distress at or above this clinical level. Women reported significantly higher levels of distress than did men (mean = 4.6 vs. 3.2, respectively), t (871) = −7.65, p < 0.001, d = 0.52, but were not significantly more likely to report a score of ≥5, t (346) = −1.03, p = 0.305. Women with a gynecologic tumor reported the highest level of distress. It was the only group for whom the mean score on the DT reached the clinical level of ≥5.
Problems and Symptoms Reported on the CPC and ESAS
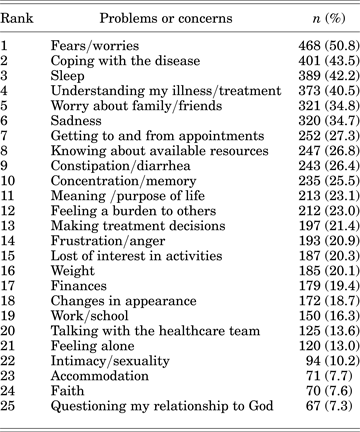
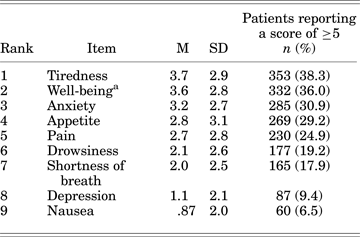
The frequency distribution of the problems reported on the CPC is shown on Table 2. Means and standard deviations for the whole sample as well as the percentage of patients who reported a score of ≥5 and higher on each item of the ESAS are shown on Table 3.
Frequency distribution of the problems on the Canadian Problem Checklist (CPC) (n = 922)
Descriptive statistics on the Edmonton Symptom Assessment System (ESAS) (n = 922)
aHigher score on this scale indicates a worse feeling of well-being.
Comparison of the Percentage of Problems and Symptoms Reported According to Patients' Level of Distress
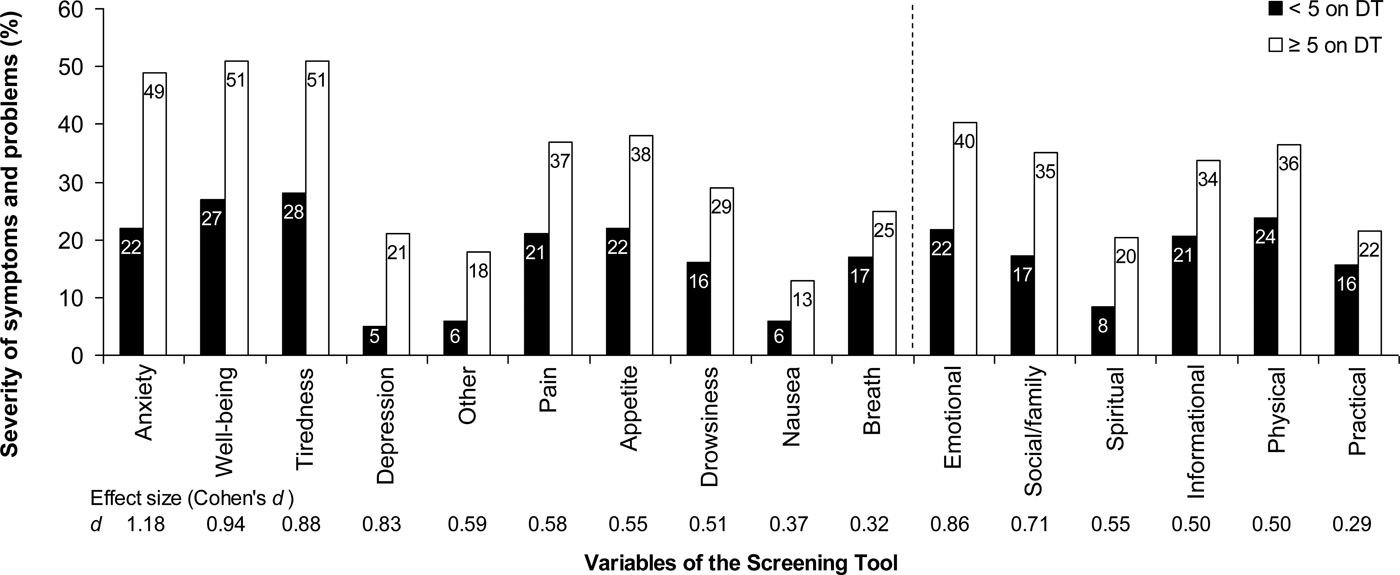
Patients with a high level of distress (score of ≥5 on the DT) reported a significantly higher frequency of problems on all categories of the CPC (p < 0.001) and higher intensity on all ESAS items (p < 0.001) than did patients with a low level of distress (Fig. 2). Effect sizes were strong on emotional problems on the CPC, as well as on the anxiety, well-being, tiredness, and depression items of the ESAS. Moreover, patients reporting a high level of distress on the DT also had a mean score reaching a clinical level (≥5), or thereabouts, on anxiety (4.9), well-being (5.1), and tiredness (5.1).
Comparison of the percentage of problems and symptoms reported on the Edmonton Symptom Assessment System (ESAS) and Canadian Problem Checklist (CPC) according to patients' level of distress on the Distress Thermometer (DT). Items presented to the left of the dotted line represent the average severity of each ESAS symptom, and those on the right are problems reported on the CPC. The ESAS scores were converted to percentages to allow comparisons between all variables of the screening tool. For example, a percentage of 49 corresponds to a score of 4.9 on a scale from 0 to 10. Effect sizes are presented at the bottom of the figure in order to simplify the graph.
Wish to Receive Help and Resources Offered
From the total sample of screenings, 28.3% of patients (n = 261) expressed their wish to receive help for one or the other problem they may have mentioned on the Screening Tool, whereas 53.0% (n = 489) did not want help, and 18.7% (n = 172) did not answer this question, which appeared at the bottom of the screening questionnaire. Women were more likely to express their wish for help, χ 2(1, n = 750) = 12.32, p < 0.001. From the patients who wished to receive help, 86.2% (n = 225) were offered a referral to at least one resource, and of this number, 79.1% (n = 178) accepted the referral. In addition, 36.4% (n = 178) of patients who first reported not wishing help nevertheless were offered a referral, and 55.1% (n = 98) of them accepted it. Overall, of the patients to whom a referral was offered to (n = 512), 68.2% (n = 349) accepted it, 25.4% (n = 130) declined, and 6.4% (n = 33) did not answer.
The top five list of the most frequent referrals offered to the patients were social worker (n = 281, 30.5%), psycho-oncology team (psychologist, psychiatrist, occupational therapist; n = 175, 19.0%), nurse navigator (n = 121, 13.1%), dietician (n = 117, 12.7%), and support groups offered by community-based organizations (n = 62, 6.7%).
Associations Among the Components of the Screening Tool and Gender, Age, and the Wish to Receive Help
Biserial correlation of the points' coefficients showed significant associations between gender and the number of problems reported on the CPC, as women reported more problems for several categories (emotional (p < 0.001), social/family (p < 0.001), spiritual (p < 0.001), and informational (p = 0.008), as well as the total number of problems on the CPC (p < 0.001). However, associations were weak, with effect sizes ranging from small to nearly moderate (d = 0.18–0.44). Moreover, weak or insubstantial Pearson's correlation between age and the number of problems reported on the CPC were noticed.
Patients who expressed a wish to receive help reported significantly higher scores on the DT than did those not wishing help (mean score of 5.6 vs. 3.1, respectively), t (722) = −12.28, p < 0.001, corrected t and p values for non-equality of variances. Similarly, they reported a significantly higher frequency of problems on each of the CPC categories and its total score (p < 0.001) as well as significantly greater intensity on each of the ESAS items and its total score (p < 0.001). Strong effect sizes were found for these relationships on the DT (d = 0.98), total number of problems on the CPC (d = 0.94), total scaled score on the ESAS (d = 0.85), anxiety item of the ESAS (d = 0.82), and emotional problems on the CPC (d = 0.80).
Factors Most Strongly Associated with Distress
In order to identify the variables that were the most strongly associated with distress, variables showing moderate to strong associations with the DT (r ≥ 0.40) were included in the regression modelFootnote 3: anxiety, total scaled score on the ESAS, total number of problems on the CPC, well-being, emotional problems, tiredness, depression, and social/family problems. After eliminating nonsignificant predictors, the final model accounted for 48.4% of the variance of distress and included anxiety (ΔR 2 = 0.375), total number of problems on the CPC (ΔR 2 =0.072), well-being (ΔR 2 = 0.006) and tiredness (ΔR 2 = 0.003), R 2 = 0.484, F(5,740) = 139.32, p < 0.001. The standardized coefficients indicated a positive relationship, that is, the higher the level for each of these variables, the higher was the distress.
Given that distress is sometimes conceptualized as being mostly a depressive and anxious mood, we performed a standard regression to measure the unique contribution of the ESAS depression and anxiety items to the variance of the distress score on the DT. A regression model including only these two scores accounted for 39.2% of the variance on the DT (R 2 = 0.392, F (2, 812) = 261.55, p < 0.001) that is, almost 10% less than the complete model. A conservative test administered to compare the two R 2 previously cited showed that the complete model explained significantly more variance of distress than did anxiety and depression alone, Z (2.34, p = 0.019) (Tabachnick & Fidell, Reference Tabachnick, Fidell, Tabachnick and Fidell2006). Anxiety contributed to the variance of distress more than depression (anxiety uniquely contributed to 20.3% of the variance of distress on the DT, whereas depression uniquely contributed to 2% of this variance).
Optimal Cutoff Score on the DT
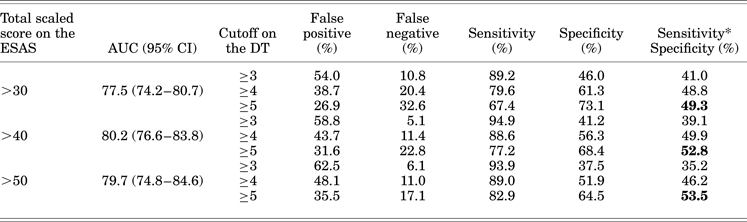
Results reported in Table 4 indicate that a cutoff score of 5 on the DT provides the best combination of sensitivity and specificity when using a cutoff of 50 on the total scaled score on the ESAS.
False positives and false negatives, sensitivity, specificity and area under the curve (AUC) for the cutoff scores of 3, 4, and 5 on the Distress Thermometer (DT), using scaled score on the Edmonton Symptom Assessment System (ESAS)
n = 860.
Sensitivity measures the percentage of patients who are correctly identified as having distress. Specificity measures the percentage of patients who are correctly identified as not having distress. AUC of 50 signifies that accuracy is equal to chance. AUC of 100 signifies a perfect accuracy (Swets et al., Reference Swets, Dawes and Monahan2000).
DISCUSSION
The first objective of this article was to describe the characteristics of patients screened for distress as part of routine care at the time of their first consultation with nurse navigators. The mean score on the DT globally suggested low to moderate levels of distress at this particular point in time, which was lower than what was expected by clinical teams and managers. Compared with men, women tended to report higher levels of distress, which is consistent with other data (van Scheppingen et al., Reference van Scheppingen, Schroevers and Smink2011). Moreover, as distress reported on the DT increased, the frequency and intensity of problems and symptoms on the CPC and ESAS also increased. Because the level of distress as measured by the DT increased with the frequency and intensity of problems and symptoms on the CPC and ESAS, the DT presented a good “snapshot” of the extent of patients' psychosocial and supportive care needs. This supports including the DT in the Screening Tool. Moreover, this is consistent with a comment made by nurse navigators of our facility who appreciated the inclusion of the DT in the Screening Tool for this very reason, as it facilitated the screening process.
The most prevalent problems and symptoms reported by patients related to a range of concerns: emotional (fears/worries, anxiety, well-being, coping with the disease), physical (sleep, tiredness, pain), informational (understanding my illness and/or treatment), and social/family (worry about family/friends). These data support the use of a screening tool that encompasses psychosocial, practical, and physical domains, to tackle all the supportive care needs of patients. Knowing the most prevalent problems and symptoms may lead our organizations to prioritize particular areas for the development of further resources to be offered to patients, as well as to offer further training to professionals in order to enhance their skills at addressing these needs.
As shown in Figure 2, anxiety, a low feeling of well-being, tiredness, and depression were the symptoms that most distinguished patients who reported a “high” from those who reported a “low” level of distress on the DT. Knowledge of this typical pattern of symptoms associated with higher distress may help health caregivers to orient their subsequent steps in the process of screening. For example, it may lead them to target these symptoms more directly for further assessment and selection of appropriate follow-up actions. In another scenario, it may also suggest that they further question these particular aspects in their dialogue with patients who may be experiencing distress.
Results show no link between patients' age and the frequency/intensity of problems and symptoms, and this is also true for gender if we consider the small effect sizes of this association. In addition, patients reporting a higher level of distress or frequency/intensity of problems or symptoms were more likely to express their wish for help when they completed the Screening Tool. Almost one third of the patients expressed their wish for help. Half of those who did not initially appear to want assistance did accept a referral following their conversation with the nurse navigator when she offered one. Overall, a high proportion of patients (near 70%) accepted a referral when it was offered to them.
Authors have explored reasons patients did not want or accept assistance despite the fact they were experiencing distress (Frick et al., Reference Frick, Tyroller and Panzer2007; Dolbeault et al., Reference Dolbeault, Boistard and Meuric2011). Among these reasons were, for example, not expecting problems outside of the medical area to be addressed by the facility they were attending; the belief that nothing could be done about their concerns, which they perceived to be the expected side effects of cancer treatment; not wanting to talk about their problems; the feeling they already had enough to cope with; or receiving adequate support from family and friends. As an additional reason, Dolbeault and colleagues (Reference Dolbeault, Boistard and Meuric2011) hypothesized that the use of the word distress, which might have a slightly different (stronger) connotation in French, may itself have contributed to patients' reluctance to volunteer their concerns or to accept help when it was offered. This term could be either perceived as being too strong to describe what they were experiencing, or might be associated with a “psychological” or “psychiatric” stigma.
Patient-centered care represents a cultural change of practice not only for healthcare providers and managers, but also for patients themselves. Patients and their families need to be sensitized about the cultural acceptability of voicing their distress and needs in the context of cancer care; they need to be given information on the resources available for their total needs; and educated about the extent of services and the willingness/capability of the healthcare team to help them. This is consistent with enhancing patients' empowerment and engagement in their care over their cancer journey, which is another key function of nurse navigators (Fillion et al., Reference Fillion, Cook and Veillette2012). Finally, as suggested by van Scheppingen et al. (Reference van Scheppingen, Schroevers and Smink2011), screening might be more efficient if it emphasized the unmet need for assistance and resources, rather than distress, and this could be particularly relevant in the context of French culture discussed earlier.
The second objective of this article was to identify the variables that were the most strongly associated with distress. Anxiety was the factor showing the strongest association with the distress score on the DT. The complete model, which included the total number of problems on the CPC, well-being, and tiredness, predicted almost 50% of the variance of distress. This model explains significantly more variance than merely anxiety and depression. This suggests that at the moment when patients complete the DT on the Screening Tool, their initial evaluation of their global well-being goes beyond psychological dimensions. This is consistent with the NCCN conceptualization of distress, which takes into account the global nature of this experience. Again, these data support the use of a screening tool that allows the identification of concerns associated with the physical, emotional, psychosocial, spiritual, and practical consequences of cancer. The items of the Screening Tool that did not significantly contribute to the variance of distress are not less important to the screening process, as they are likely to reflect important needs and concerns for a number of patients. When necessary, focused assessment to understand the parameters associated with these concerns and appropriate exploration of ways to cope with them or, eventually, a timely referral to other relevant services could even prevent the emergence of high levels of distress.
Our third objective was to verify whether the cutoff score used to orient patients on the basis of their reported distress was optimal. We indicated cutoff scores within our localized care pathways (algorithm) to aid clinical decisions in the process of screening (e.g., further assessment, psychoeducational information, symptom management, referral to other services). In the actual sample, results suggest that a cutoff of 5 on the DT together with a cutoff of 5 on the ESAS items represents the best combination of specificity and sensitivity. These data correspond to the actual cutoff scores we use in our facility. Especially at this first phase of the implementation process within our facility, the homogeneity of cutoffs on both the DT and the ESAS items facilitates uptake. Moreover, balancing sensitivity and specificity has the advantage of limiting the probability of large numbers of false positives, which would constitute a barrier to an efficient implementation of Screening for Distress in routine care. This is especially true in the psychosocial area, where managers were concerned about an explosion of referrals to limited psychosocial resources. Again, one should note that the cutoff scores indicated in the care pathway we developed are there to assist professionals in their decision making and as a complement to their clinical judgement, not as a strict cutoff score per se.
In addition, as stated by Chang and colleagues (Reference Chang, Hwang and Feuerman2000), one single cutoff value may not be appropriate for all symptoms of the ESAS. For example, data from our study suggest that the depression item of the ESAS is four times greater in patients reporting a high level of distress than in patients reporting a low level of distress. Therefore, a more stringent cutoff for the depression item might be something to consider if this result is replicated among several samples at different time points over the cancer journey.
Refinement of the cutoff values constitutes a further stage of work in the implementation process. To do this, we can rely on the emergence of a growing body of data on Screening for Distress, the 6th Vital Sign, and the support of a national strategy from which recommendations emerged for scoring algorithms to respond to distress scores (Fitch et al., Reference Fitch, Howell and McLeod2012). Provincial cancer agencies and the Cancer Journey Action Portfolio of the Canadian Partnership Against Cancer are currently leading the way with the production of clinical practice guidelines and brief algorithms to guide practices related to physical and psychological symptom scores on the ESAS (Fitch et al., Reference Fitch, Howell and McLeod2012). Completed guidelines include those on depression and anxiety, fatigue, sleep disturbances (Howell, Reference Howell and Doran2010), pain, dyspnea, and nausea/vomiting (Cancer Care Ontario, 2011; Fitch et al., Reference Fitch, Howell and McLeod2012). More guidelines are in the planning stages.
What Information do these Data Provide to Answer our Question “What to do with the Distress Scores”?
In the first phase of implementation of systematic screening in the Quebec jurisdiction, efforts were mostly directed to developing a localized toolkit including a French adaptation of the Screening Tool, care pathway, and training material, as well as adoption by clinical staff and managers. The very large numbers of patients screened by nurse navigators who pioneered Screening in our facility as well as current ongoing screening are encouraging indicators of adoption. The data presented in this article will provide evidence-based feedback to clinical teams (and managers) implementing Screening for Distress in daily practice and will help them to move forward on the next steps of this endeavor. The following paragraphs present two aspects that this feedback will focus on: the need for a programmatic approach and further support for clinical staff who are implementing screening.
First, in order to build on initial adoption and continue to be successful and make a real difference in patients' well-being or the capacity of staff to meet their needs, work is needed to better embed screening into a programmatic approach. This means that screening must be followed by focused assessment of problems using valid tools and appropriate follow-up action/intervention based on the best evidence. Fitch et al. (Reference Fitch, Howell and McLeod2012) provide an excellent description of how a nurse would go about responding to screening scores. Within our facility, anecdotal data gathered among nurses indicated that how the staff implemented this framework varied greatly. Still, screening can be perceived by frontline staff mainly as a tool to orient patients to external resources/services. Training therefore needs to emphasize the conceptual framework linking screening–assessment–intervention. If well embedded in a programmatic approach, Screening for Distress can become a genuine tool that can be used toward offering an effective hierarchical response to cancer patients' needs. Several of the problems or symptoms reported by patients can first be addressed by frontline staff without necessarily requiring referral to specialized resources. For example, frontline staff may give medical and/or basic psychoeducational information to patients either to inform them about their illness/treatment or to manage their symptoms.
Second, several nurse navigators from our facility indicated that routine screening using a standardized tool contributes to establishing the therapeutic relationship. It helps to open a dialogue with patients as well as to focus more closely on patients' concerns and needs (Fillion et al., Reference Fillion, Cook and Blais2011). At the same time, systematic screening sheds light on clinical situations that are more likely to be reported as challenging as, for example, patients who are experiencing a high level of distress, but who are unwilling to accept the assistance that might need or that would be beneficial to them. As part of an initial education stage among nurse navigators, we emphasized that identifying and acknowledging patients' needs and concerns was an intervention in itself. Actively listening to, and supporting patients may often constitute a first step in defining or solving problems or, eventually, future intervention. For this reason, we emphasized the process of opening a dialogue and establishing relationship as valuable and critical components in the process of Screening for Distress.
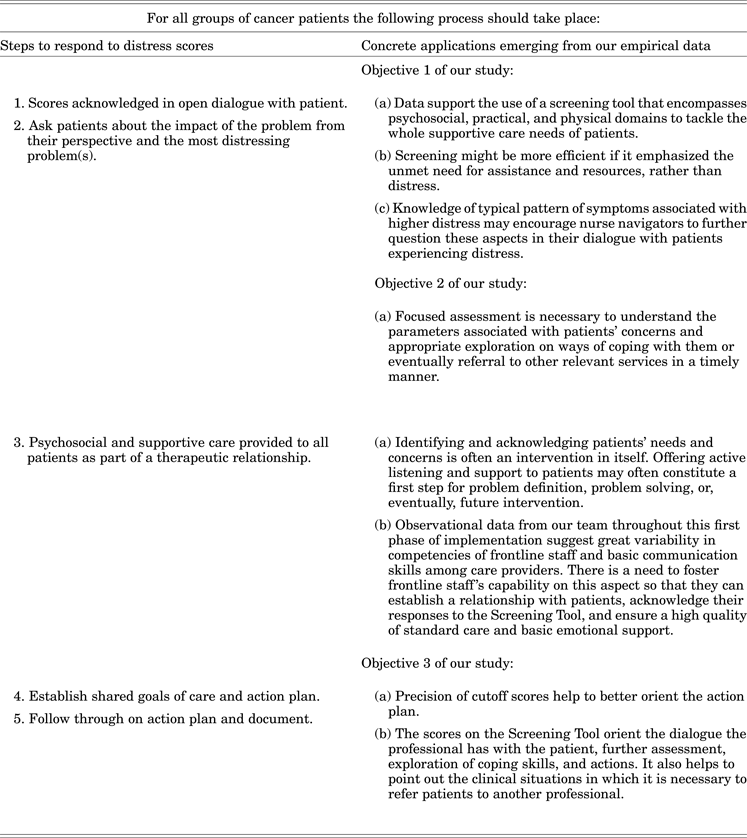
We also have to help healthcare providers to enhance their basic communication skills so that they can improve their confidence in establishing a therapeutic relationship and providing psychosocial care. In better knowing how to acknowledge patient responses to the Screening Tool, this could contribute to ensuring a high quality of standard care and basic emotional support. Observational data from our team throughout this first phase of implementation suggest that the competencies of frontline staff varied a great deal in this aspect. Nurse navigators have already benefited from extended psychosocial training (Fillion et al., Reference Fillion, Cook and Veillette2012), which is not the case with several other frontline staff. Healthcare providers need support, and their skills need to be reinforced so that all of them can efficiently contribute to the screening process. This is true for all patients whether they are reporting low, moderate, or high levels of distress, as for all of them, the following actions should take place: (1) screening scores should be acknowledged, (2) what that score means to the patient should be discussed, (3) the conversation should be charted, and (4) follow through on an action plan should be identified (Canadian Partnership Against Cancer, 2009). In Table 5, we represented this screening process based on the ones proposed by Fitch and colleagues (Reference Fitch, Howell and McLeod2012) and the Cancer Journey Action Group (Canadian Partnership Against Cancer, 2009) along with concrete applications to this process that emerged from our empirical data.
The Screening for Distress process (Canadian Partnership Against Cancer, 2009; Fitch et al., Reference Fitch, Howell and McLeod2012) and concrete applications emerging from our empirical data
The present article is one of the first to document quantitative data emerging from the national strategy on Screening for Distress, the 6th Vital Sign. It describes the characteristics of a large sample of patients, and gives initial answers to questions regarding the clinical implementation of a screening program. As these data were collected within a naturalistic design, there are some associated limits to mention. First, screening happened at the time of the first contact that nurse navigators had with their patients, which was generally close to the time of diagnosis. However, this moment is not the same for every cancer journey and, therefore, may have varied from patient to patient (e.g., following diagnosis/surgery, beginning of chemotherapy or radiation). Second, the great majority of patients at our facility are French-speaking Caucasians. We did not collect specific sociodemographic data, and this limits the generalization of the results. Third, there are no data on the percentage of patients who were screened based on the total number of patients who received care within our facility during the time when the actual data were collected. Finally, one should bear in mind that the screening data we have presented here are like a “snapshot” of patients' characteristics at a given moment, and that this may change over time. We cannot generalize these results to other time points in the cancer trajectory or to other populations. Data from multiple screenings over the cancer care trajectory will be necessary, which is in line with CPAC recommendations and others (Annunziata et al., Reference Annunziata, Muzzatti and Bidoli2011), as patients' needs and symptoms are likely to vary from one moment to another.
As further work in this area, it would be beneficial to document the outcomes of systematic Screening for Distress embedded in a programmatic approach. As stated by Dolbeault et al. (Reference Dolbeault, Boistard and Meuric2011), further questions such as “What impact does the response to the expressed needs have in terms of patients' quality of life and impact on the healthcare system?” are of great relevance. It would also be useful to investigate patients' level of satisfaction specifically with regard to the process of Screening for their Distress.
CONCLUSION
To answer our practical question about what to do with the scores, each of our three objectives is bringing concrete applications. First, the way to present the tool to patients, with an emphasis on acknowledgement and normalization of their emotional stress and needs rather than assessing their distress; second, an acknowledgement of patients' response makes it possible for them to explore the different domains of their needs; and third, the process of screening for distress is including a dialogue that leads to focused assessment, the identification of specific problems, the exploration of solutions to these problems, and eventually to referrals, where cutoff scores may become an indicator. How to implement these actions into practice and assess their effectiveness on patient outcomes and frontline staff satisfaction could be the next steps.
ACKNOWLEDGMENTS
The first phase of the implementation of Screening for Distress in Quebec jurisdiction was funded by Health Canada, through the Canadian Partnership Against Cancer Corp., Cancer Journey Action Group (CPACC-CJAG). We thank all staff and patients participating in this important initiative. We are also grateful to Fred Sengmueller for his continuous help with the English revision of this article, Hans Ivers for his support in statistical analysis, and Sabrina Rousseau and Véronique Leclair, who made an important contribution to the data entry.