INTRODUCTION
Parasite effects on individual host fitness can strongly impact host population dynamics (Anderson and May, Reference Anderson and May1978; May and Anderson, Reference May and Anderson1978), community structure (Dobson and Hudson, Reference Dobson and Hudson1986; Minchella and Scott, Reference Minchella and Scott1991) and evolution (Duffy et al. Reference Duffy, Brassil, Hall, Tessier, Caceres and Conner2008). Predicting parasite fitness effects in nature is therefore critical for both basic and applied ecology. Accurate prediction requires understanding the factors that influence when and where hosts will interact with parasites and the consequences for host fitness. A holistic understanding of the pathway from environmental context to host infection to fitness effects is thus needed.
A principal challenge to predicting infection levels emerges from the fact that processes at multiple spatial (microhabitat, local, regional) and temporal scales (intra- and inter-annual) can influence infection, but these processes are seldom considered simultaneously. Individual host traits (Saino et al. Reference Saino, Moller and Bolzern1995; Wilson et al. Reference Wilson, Muzzall and Ehlinger1996; Zelmer and Arai, Reference Zelmer and Arai1998), local site characteristics (Richgels et al. Reference Richgels, Hoverman and Johnson2013), dispersal (Vaughn and Taylor, Reference Vaughn and Taylor2000), seasonal forcing (Altizer et al. Reference Altizer, Dobson, Hosseini, Hudson, Pascual and Rohani2006; Cornell, Reference Cornell2008) and longer-term processes (e.g. climate change, Harvell et al. Reference Harvell, Mitchell, Ward, Altizer, Dobson, Ostfeld and Samuel2002) may influence variation in host–parasite encounter rates and parasite persistence over space and time. In addition, many parasites have complex life cycles involving multiple hosts or free-living stages, which can be affected by drivers operating over different scales.
A second challenge arises from attempting to accurately assess the consequences of infection for host fitness components in nature. Laboratory or mesocosm studies can provide insights into parasite fitness effects (Anderson and May, Reference Anderson and May1978; May and Anderson, Reference May and Anderson1978), but experimental venues rarely faithfully mimic field conditions. To validate laboratory studies, measurements of both infection and fitness components in the field, controlling for potentially confounding factors such as individual age, are badly needed. Such measurements should offer insights into natural rates of parasite transmission and effects on host demographic rates (e.g. mortality rates), which will be vital to scale up individual-level fitness effects, e.g. to predict population-level effects of parasites (Hudson et al. Reference Hudson, Dobson and Newborn1998).
Here, we take steps to confront these challenges and develop a more complete understanding of a larval frog–trematode parasite system, linking environmental context, parasite distributions at multiple life stages and levels of organization, and host demographic rates. Larval frogs provide an ideal system to address factors influencing the distribution of parasites and demographic effects. Tadpoles are frequently parasitized (Hoverman et al. Reference Hoverman, Mihaljevic, Richgels, Kerby and Johnson2012; Johnson and Hoverman, Reference Johnson and Hoverman2012) and occur in discrete populations (i.e. ponds) that vary considerably in habitat characteristics (e.g. pond size, hydroperiod and canopy cover) that influence both parasite (Richgels et al. Reference Richgels, Hoverman and Johnson2013) and amphibian distributions (Werner et al. Reference Werner, Skelly, Relyea and Yurewicz2007). We focus on echinostomes (Digenea: Echinostomatidae), which are common, generalist parasites with a complex life cycle (described in ‘Study System’ below). Echinostome infection has been shown to affect larval frog traits and reduce larval frog survival under controlled exposures in the laboratory (Holland et al. Reference Holland, Skelly, Kashgarian, Bolden, Harrison and Cappello2007; Marino et al. Reference Marino, Holland and Middlemis Maher2014), mesocosms (Raffel et al. Reference Raffel, Hoverman, Halstead, Michel and Rohr2010; Marino and Werner, Reference Marino and Werner2013) and field experiments (Holland, Reference Holland2010). Evidence also suggests that echinostome infection increases near human activities, such as agriculture and urbanization (Beasley et al. Reference Beasley, Faeh, Wikoff, Staehle, Eisold, Nichols, Cole, Schotthoefer, Greenwell, Brown and Lannoo2005; Skelly et al. Reference Skelly, Bolden, Holland, Freidenburg, Friedenfelds, Malcolm, Collinge and Ray2006; King et al. Reference King, McLaughlin, Gendron, Pauli, Giroux, Rondeau, Boily, Juneau and Marcogliese2007; Rohr et al. Reference Rohr, Schotthoefer, Raffel, Carrick, Halstead, Hoverman, Johnson, Johnson, Lieske, Piwoni, Schoff and Beasley2008). However, factors underlying echinostome distributions and dynamics and the effects of parasitism are still poorly understood in nature, although such effects may contribute to anuran population dynamics (Karraker et al. Reference Karraker, Gibbs and Vonesh2008).
We had two main objectives in this study: (1) Characterize the correlates of echinostome distributions within and across ponds. (2) Evaluate changes in larval frog survival associated with echinostome infection in natural ponds. To meet these objectives, we performed a field survey of echinostome infection levels in snail first intermediate and larval green frog (Rana clamitans) second intermediate hosts across 23 ponds over 5 years. The survey results were also coupled with a field enclosure experiment in which we measured infection and survival of larval green frogs.
METHODS
Study system
Echinostomes have a complex life cycle involving three hosts (Kanev et al. Reference Kanev, Sterner, Fried, Fried and Graczyk2000). Adult worms typically live in the intestinal tract of mammal or bird hosts, where they reproduce sexually. Eggs pass in the feces, hatch and a free-swimming miracidium enters a snail host, where the parasite goes through multiple rounds of asexual reproduction during sporocyst and redia stages. Cercariae, another free-swimming form, exit the snail host and infect a second intermediate host – a snail, fish, or larval amphibian. In larval frogs, cercariae enter through the cloaca and encyst in the kidney as metacercariae. When the second intermediate host is consumed by the definitive host, the parasite completes its development to adulthood.
In the laboratory, high infection burdens in tadpoles have been shown to impair kidney function and can result in host death, especially at early developmental stages (Schotthoefer et al. Reference Schotthoefer, Cole and Beasley2003; Marino et al. Reference Marino, Holland and Middlemis Maher2014). For example, a laboratory study showed that infection in green frog tadpoles (mean burden = 12 metacercariae) resulted in 40% occurrence of oedema, indicative of impaired kidney function and 30% mortality (Holland et al. Reference Holland, Skelly, Kashgarian, Bolden, Harrison and Cappello2007).
Animal care
This research was performed in accordance with University of Michigan UCUCA Protocol #07765 and applicable guidelines for the care and use of animals were followed.
Field survey of infection in snails and larval green frogs
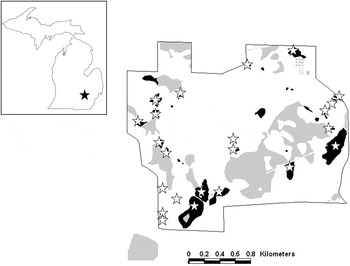
To evaluate factors that influence echinostome distributions among ponds, we surveyed infection in 23 ponds on the Edwin S. George Reserve (ESGR) in Livingston County, Michigan (Fig. 1). Ponds were selected from a set of 37 ponds based on survey data that indicated where snail hosts had recently occurred (Hoverman et al. Reference Hoverman, Davis, Werner, Skelly, Relyea and Yurewicz2011). These 37 ponds were part of a long-term survey in which amphibians, amphibian predators and snails were collected and a range of abiotic factors were measured (for details, see Werner et al. Reference Werner, Skelly, Relyea and Yurewicz2007, Reference Werner, Relyea, Yurewicz, Skelly and Davis2009; Hoverman et al. Reference Hoverman, Davis, Werner, Skelly, Relyea and Yurewicz2011).
Map of the E. S. George Reserve showing ponds that were sampled in the general survey in black (Werner et al. Reference Werner, Skelly, Relyea and Yurewicz2007). Ponds that were surveyed for echinostomes in snails and larval green frogs (Rana clamitans) when present are marked with white stars. Other wetlands (few of which support amphibian larvae) are grey. Inset: Michigan map, with location of ESGR marked with black star.

Ponds were sampled in June and July of 2008 and monthly from May–August from 2009–12 with dip nets (22 × 27 cm2, 1 × 2 mm2 mesh size). Our surveys were performed mid-month and in May–July were simultaneous or within 1 week of the long-term survey dates. We assessed infection in five snail species, as some echinostome species can exploit multiple species of snail hosts (Kanev et al. Reference Kanev, Sterner, Fried, Fried and Graczyk2000; Detwiler et al. Reference Detwiler, Bos and Minchella2010). We collected Planorbella trivolvis, Stagnicola elodes and Physa gyrina on all dates and Planorbella campanulata and Helisoma anceps from 2010 to 2012. In July and August 2010–12 (and from two ponds in July 2009), we also collected green frog tadpoles, which were euthanized and preserved in 70% ethanol. We collected 20 individuals of each snail species and ten tadpoles from each pond on each date when possible, although few or no snails or tadpoles were collected from some ponds on some dates due to low densities or if the pond was dry. Sampling effort (measured in dipnet-minutes) was quantified to establish whether a pond had sufficient densities of snails or green frog tadpoles to continue sampling. Ponds that held water were sampled for at least 10 dipnet-minutes. We then determined a pond as having too low a density to continue if we were unable to collect at least five individuals of any focal species after the initial 10 dipnet-minutes of sampling. Otherwise, we discontinued sampling after 20 individuals of each reasonably abundant (i.e. five or more individuals collected in at least 10 dipnet-minutes of sampling) focal species were collected or after a maximum of 20 dipnet-minutes in small ponds (<750 m2), 30 dipnet-minutes in medium ponds (750–1500 m2) or 40 dipnet-minutes in large ponds (>1500 m2).
All snails were screened for the presence or absence of parasite infection by placing them in 60 mL water in sample cups and putting them under a 60 W light for a minimum of 3 h. Due to space limitations, typically multiple (2–3) snails of the same species from a single pond were initially put into a single cup together. After 3 h, all cups were examined under a dissecting microscope for the presence of trematode cercariae. If any trematode cercariae were observed before at least 3 h elapsed, the snails were separated into new individual cups and placed under a 60 W light for at least two additional hours. Any snails that did not release cercariae after at least 3 h were recorded as not infected. After the additional 2 h, cups containing individual snails were examined under a dissecting microscope to examine if any trematode cercariae were present. If present, we moved a sample of cercariae into a small Petri dish in 70% ethanol. The cercariae were then identified as echinostomes or other groups (e.g. Ribeiroia ondatrae, strigeid cercariae, Alaria sp.) based on morphology (Schell, Reference Schell1985). We note that this method for assessing infection likely underestimated infection in snails, as any infected snails that did not actively shed cercariae were counted as not infected. All snails were preserved in 70% ethanol. To assess infection in tadpoles, five tadpoles (or all when fewer) from each pond on each date were dissected under a microscope. We dissected the pronephri, nephric ducts and mesonephri and counted the number of echinostome metacercariae present.
Infection and survival in pond enclosures
We used enclosures to measure infection and survivorship of tadpoles in a subset of eight ponds (including one off-ESGR pond, which we also surveyed following the same approach). Due to the long breeding season of green frogs, tadpoles collected during the survey may have experienced a range of exposure times to parasites, and also may have experienced selective predation, which could influence patterns in observed infection. Enclosures allowed us to exclude predators and control for initial size of tadpoles and length of time in ponds. Green frog egg masses were collected from the experimental ponds on the ESGR during the first week of June 2010 and placed in 300 L pools filled with aged well water. After hatching tadpoles were fed ad libitum with Purina® Rabbit Chow until the beginning of the experiment. On 22 June 2010, ten sets of ten tadpoles [21·4 ± 0·9 mg, Gosner (Reference Gosner1960) stage 25] were introduced into each pond. Tadpoles were moved into 0·5 L plastic containers of water from the culture pools and placed into the pond floating for 30 min, to allow water in containers to reach pond temperature. Cages (30 × 45 × 5 cm3) were constructed of window screening covering a frame of plastic fencing. The ten tadpoles from a plastic container were then moved into a cage along with three pieces of polystyrene to ensure floatation near the pond surface, and the cage was closed with two plastic zip ties. Pairs of cages were secured with zip ties to five stakes (~1·5 m PVC pipe, diameter = 2·54 cm), which were used to hold each cage into place, with a total of ten cages per pond. The five stakes were placed at least 5 m from the edge of each pond, and at least 5 m apart from one another. In ponds with multiple habitat types (open water, submergent vegetation (e.g. Elodea sp.), emergent vegetation (e.g. cattails and water lilies or overhanging vegetation), we arranged the stakes so that some cages would be in different microhabitat types, which can influence parasite exposure (Sapp and Esch, Reference Sapp and Esch1994). Cages were collected at two time points to assess changes in infection and survival over time. One half of the cages (one from each pair on each stake) were collected after 2 weeks. Remaining cages were collected after 4 weeks. After cages were collected, surviving tadpoles were removed, counted, weighed, euthanized and preserved in 70% ethanol for later dissection. Tadpoles that died during the experiment rapidly degraded in ponds and were not recovered, so infection and final mass was measured and included in analysis only for tadpoles that survived to collection.
Species-level identification
Multiple morphologically similar species of echinostomes occur across North America (Detwiler et al. Reference Detwiler, Bos and Minchella2010) and at our field site (Marino and Werner, Reference Marino and Werner2013). We therefore used molecular methods to identify the echinostome species present at our field site. We dissected snails and removed five rediae or sporocysts, and we then extracted DNA using a Qiagen DNeasy Tissue Extraction Kit and amplified a portion of the 28S ribosomal DNA using digenean specific primers (Dig12 and LSU 1500R) (Tkach et al. Reference Tkach, Littlewood, Olson, Kinsella and Swiderski2003). We confirmed successful amplification using gel electrophoresis and the PCR product (1/5 dilution) was submitted to the University of Michigan DNA Sequencing Core for sequencing. We examined chromatograms for each sequence in Sequencher and compared sequences to GenBank using NCBI Nucleotide BLAST (http://blast.ncbi.nlm.nih.gov/Blast.cgi).
Statistical analysis
All analyses were performed in the R statistical package v.2.15 (http://www.r-project.org). For the ESGR survey data, we analysed hypothesized factors that influence echinostome infection in snails and larval green frogs using mixed models, which were appropriate for nested data and unequal sample sizes. We analysed prevalence (proportion of hosts infected, sensu Bush et al. Reference Bush, Lafferty, Lotz and Shostak1997) in snails using a generalized linear mixed effects model (GLMM) with a binomial distribution, using the glmer function in the lme4 package (http://cran.r-project.org/web/packages/lme4), with pond and year as random effects. Fixed effects included snail species identity, month sampled, pond canopy cover, pH, mean annual hydroperiod and maximum pond area (rescaled relative to the largest pond and log-transformed). We expected that each factor could affect one or more processes that affect prevalence, such as host competence, definitive host visitation, host–parasite contact rates, or snail demographics. We also included the species × month interaction in the model, because snail species differ in life history traits that may influence how prevalence changes seasonally (DeWitt, Reference DeWitt1955; Morris and Boag, Reference Morris and Boag1982; Brown et al. Reference Brown, Leathers and Minchella1988).
In addition to the GLMM, we also performed Mantel tests to examine whether prevalence in each snail species and overall was spatially correlated. We expected that a spatial correlation could result from spatial clustering of definitive host movement among ponds. Mantel tests were performed using the mantel.rtest function in the ade4 package (http://cran.r-project.org/web/packages/ade4), using overall prevalence in ponds calculated across years for snails collected in June and July.
We analysed echinostome abundance (number of metacercariae per host, including both uninfected and infected hosts, sensu Bush et al. Reference Bush, Lafferty, Lotz and Shostak1997) in tadpoles using a GLMM with a negative binomial distribution implemented using the glmmADMB package (http://glmmadmb.r-forge.r-project.org). Fixed effects included individual snout-vent length (SVL), Gosner developmental stage (1960), prevalence in snails in the previous survey month (arcsine-square root transformed), year, and month sampled, with pond as a random factor. Tadpoles were included in the analysis if at least 20 snails were collected from the same pond during the corresponding sampling event (i.e. to reduce the likelihood of potential biases from including events when fewer snails were collected).
For the enclosure experiment, we analysed echinostome abundance in tadpoles using a GLMM with a negative binomial distribution and included prevalence in snails, microhabitat (open or structured, i.e. emergent, submergent or overhanging vegetation), and date as fixed effects, with random effects of enclosure, stake and pond. Prevalence in snails for this analysis was calculated across sampling dates in 2010 (all dates were included due to limited sample sizes of snails in some ponds in a single month). We analysed survival using a GLMM with a binomial distribution, with date, microhabitat and mean echinostome abundance in enclosures as fixed effects and random effects of stake and pond.
RESULTS
Field survey of infection in snails and larval green frogs
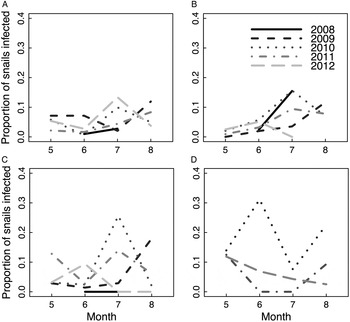
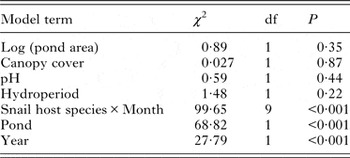
Of the 8700 snails collected in the ESGR ponds, 459 were infected with echinostomes, so that overall prevalence was 5·3%. Across snail host species, prevalence was 4·0% in S. elodes, 4·7% in P. trivolvis, 6·0% in P. gyrina and 9·7% in P. campanulata, while we observed no infection in H. anceps. Echinostomes were found in snails in all but one pond, and infected tadpoles were recovered from that pond and all other ponds from which tadpoles were collected. Echinostomes are thus ubiquitous among ponds containing appropriate snail hosts on the ESGR, although prevalence varies extensively over time and space. A significant snail species × month interaction suggests that the seasonal change in prevalence differed among host species (Fig. 2; Table 1). Prevalence also varied across ponds and years, while remaining terms were not significant (Table 1). The Mantel tests provided no evidence for a correlation between prevalence and spatial distance between ponds for any host species or across species (P > 0·1).
Echinostome prevalence (proportion of hosts infected) in four snail species on the Edwin S. George Reserve over the 5-year survey. (A) Planorbella trivolvis. (B) Stagnicola elodes. (C) Physa gyrina. (D) Planorbella campanulata. Ponds were sampled in June and July 2008 and monthly May–August in 2009–12. Planorbella campanulata was sampled beginning May 2010. Seasonal changes in prevalence differed across species (Binomial GLMM: month × species interaction: χ 2 = 100·35, df = 9, P < 0·001).

Results of binomial generalized linear model analysis of echinostome prevalence in snails

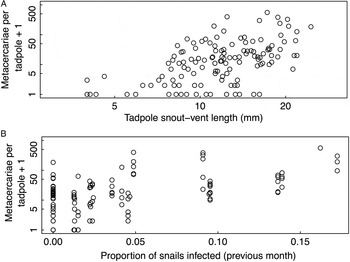
Of 250 green frog larvae collected from 16 ponds on the ESGR, 202 were infected. Echinostome abundance ranged from 0 to 555 metacercariae per tadpole, and the frequency distribution was strongly skewed to the right, showing a pattern of aggregated infection (Fig. S1; mean ± SE = 38·6 ± 5·1; median = 15). Our analysis included data from 147 tadpoles from 13 of the sampled ponds for which sufficient comparable data for infection in snails were available (i.e. from ponds where we collected at least 20 snails). The analysis included infection data from at least five tadpoles from each pond except one (Spring Pond North) where only two tadpoles were collected, and excluding that pond from analysis did not substantially affect the results. Echinostome abundance in larval green frogs increased with SVL (Fig. 3a) and prevalence in snails (Fig. 3b) and differed across years and among ponds, while remaining terms were not significant (Table 2).
(A) Individual tadpole snout–vent length vs echinostome abundance (number of metacercariae per host) in field-collected green frog tadpoles collected in 2009–12 (n = 147, negative binomial GLMM, P < 0·001). (B) Echinostome abundance in tadpoles vs prevalence in snails (proportion of hosts infected) in ponds in the previous survey month (negative binomial GLMM, P < 0·001). Note log scales [(A) both axes, (B) y-axis].

Results of negative binomial generalized linear model analysis of echinostome abundance in larval green frogs

Infection and survival in pond enclosures
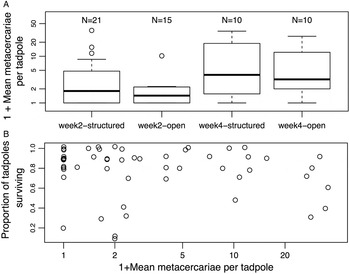
We were able to measure tadpole survival from 77 cages, final mass from 65 cages and infection from 56 cages. No data were collected from three cages, because two had holes and a third was entangled with a branch and suspended above the water's surface. No tadpoles survived in 12 cages, and samples from nine cages were lost after preservation due to defective vials resulting in degradation of material. Echinostome abundance in caged tadpoles differed among ponds (deviance = 15·33, df = 1, P < 0·001), among sites within ponds (deviance = 8·20, df = 1, P < 0·001), and between dates (deviance = 14·25, df = 1, P < 0·001). Metacercariae per tadpole increased from a mean ± s.e. = 3·2 ± 1·2 on the first date to 8·0 ± 2·3 on the second date. There was a non-significant trend of lower echinostome abundances in open portions of the pond compared to other microhabitats (Fig 4a; deviance = 3·17, df = 1, P = 0·075). The relationship between echinostome abundance in caged tadpoles and prevalence in snails across ponds was not significant (deviance = 0·58, df = 1, P = 0·45). Survival was lower in cages that had higher mean metacercariae per host (Fig 4b, χ 2 = 5·86, df = 1, P = 0·015) and there was a non-significant trend towards lower survival in open portions of the pond (χ 2 = 3·30, df = 1, P = 0·069), but no difference across dates (χ 2 = 0·097, df = 1, P = 0·76).
(A) Echinostome abundance in tadpoles (number of metacercariae per host) in enclosures in open areas or structured habitat (i.e. submerged, emergent, or overhanging vegetation) within ponds, collected after 2 or 4 weeks (negative binomial GLMM, habitat effect: P = 0·075; week effect: P < 0·001). (B) Final survival of tadpoles (proportion alive at collection) vs mean echinostome abundance in enclosures (binomial GLMM, P = 0·015). Jittering (added noise) used to show overlapping points. Note log scales [(A) y-axis, (B) x-axis].

Species-level identification
Echinostome DNA was successfully amplified and sequenced from 22 infected snails (4 P. trivolvis, 8 S. elodes, 7 P. gyrina and 3 P. campanulata) collected across the ESGR. Sequences from echinostomes collected on the ESGR closely matched (>99% sequence similarity for all samples) five genera: Echinostoma, Echinoparyphium, Euparyphium, Isthmiophora and Hypoderaeum (Table S1). Matches for Echinostoma and Echinoparyphium occurred in all four snail species. Matches for the other three genera occurred only in S. elodes, and different echinostome genera occurred in snails from the same pond (snails of both different or the same species).
DISCUSSION
Our results provide insights into the links between environmental context, parasite distributions and a component of host fitness (survival) in an echinostome–snail–amphibian system. We identified factors that influence parasitism over time (seasonality) and at the host (i.e. snail species and tadpole size), microhabitat and pond scales across multiple hosts in the parasite life cycle (i.e. snails and amphibians). Further, we provide evidence that, consistent with experiments using controlled parasite exposures (Holland, Reference Holland2010; Marino and Werner, Reference Marino and Werner2013; Marino et al. Reference Marino, Holland and Middlemis Maher2014), parasite infection in the field may reduce larval anuran host survivorship.
Our results reveal drivers of variation in parasite infection in amphibians at multiple scales. The survey results demonstrated that infection in snails and amphibians differed among ponds, and that high prevalence in snails predictably corresponded to increased infection in larval green frogs. The enclosure experiment similarly showed that echinostome abundance in tadpoles differed among ponds and also among sites within ponds, with a non-significant trend of higher abundance in enclosures in structured microhabitats, likely due to higher snail densities in those areas or microhabitat variation in infection in snails (Sapp and Esch, Reference Sapp and Esch1994; Zimmermann et al. Reference Zimmermann, Luth and Esch2016). Structured microhabitats are typically preferred by larval frogs, likely because of protection from some predators and higher resource levels (Warkentin, Reference Warkentin1992; Tarr and Babbitt, Reference Tarr and Babbitt2002), but parasitism may introduce a potential cost. The result of spatial heterogeneity at these scales may be altered parasite dynamics (Paull et al. Reference Paull, Song, McClure, Sackett, Kilpatrick and Johnson2012) and natural selection on hosts’ response to parasites, such as spatial avoidance of parasites by tadpoles (Rohr et al. Reference Rohr, Swan, Raffel and Hudson2009) or adult breeding site selection (Kiesecker and Skelly, Reference Kiesecker and Skelly2000). Surprisingly, we did not find a significant relationship between prevalence in snails and echinostome abundance in caged tadpoles across ponds, although the limited number of ponds (8) included compared to the general survey and the relatively coarse measure of infection in snails (annual prevalence) may offer an explanation.
Other patterns observed here may result from multiple mechanisms and have additional important dynamical and evolutionary implications. First, seasonal variation in infection is consistent with other studies (Sapp and Esch, Reference Sapp and Esch1994; Peterson, Reference Peterson2007) and may result from seasonal variation in snail demography, microhabitat availability or definitive host visitation. Seasonality is common among trematodes (Lemly and Esch, Reference Lemly and Esch1984), contributes to within-population variation in infection of larval frogs (Raffel et al. Reference Raffel, Lloyd-Smith, Sessions, Hudson and Rohr2011), and will be important to consider in predicting parasite dynamics (Altizer et al. Reference Altizer, Dobson, Hosseini, Hudson, Pascual and Rohani2006). Second, variation among snail species in prevalence and dynamics may result from differential resistance to infection (Raberg et al. Reference Raberg, Graham and Read2009) or contact rates with miracidia originating from variation in species’ densities and habitat use (Hoverman et al. Reference Hoverman, Davis, Werner, Skelly, Relyea and Yurewicz2011). These differences among snail species likely have important consequences for parasite transmission to amphibians. For instance, since the degree of habitat overlap between amphibians and snail species varies (e.g. green frogs and P. trivolvis typically overlap, Werner et al. Reference Werner, Skelly, Relyea and Yurewicz2007; Hoverman et al. Reference Hoverman, Davis, Werner, Skelly, Relyea and Yurewicz2011), infection dynamics are likely more synchronized for some snail–amphibian associations than others. Finally, higher observed echinostome abundances in larger tadpoles may result from longer durations of exposure for older, larger hosts (Nikolaev et al. Reference Nikolaev, Sukhotin and Galaktionov2006; Gustafson et al. Reference Gustafson, Newman, Pulis and Cabarle2015), increased transmission to larger tadpoles (e.g. due to greater contact of parasites with hosts with larger body surface area) or lower survivorship of smaller tadpoles with high abundances of infection, consistent with experimental studies (Holland et al. Reference Holland, Skelly, Kashgarian, Bolden, Harrison and Cappello2007; Marino et al. Reference Marino, Holland and Werner2016). Variation in body size may thus contribute to the strong pattern of aggregated infection observed in green frog hosts. The consequences of aggregation in larger hosts could be enhanced persistence of the parasite, given that larger hosts are better able to tolerate infection (Holland et al. Reference Holland, Skelly, Kashgarian, Bolden, Harrison and Cappello2007). However, the consequences for subsequent transmission (e.g. the relationship between tadpole body size and risk of predation by an appropriate definitive host) are unclear.
Our results thus complement existing knowledge of environmental factors influencing snail and amphibian distributions (e.g. pond size, fish presence; Werner et al. Reference Werner, Skelly, Relyea and Yurewicz2007; Hoverman et al. Reference Hoverman, Davis, Werner, Skelly, Relyea and Yurewicz2011) to identify the conditions that enhance associations between amphibians and parasites. Knowing the strength of echinostome–amphibian associations will be important for predicting the effects of species composition on parasite dynamics (e.g. Johnson et al. Reference Johnson, Preston, Hoverman and Richgels2013) and evolution of defences against parasites, such as avoidance behaviour (Rohr et al. Reference Rohr, Swan, Raffel and Hudson2009) and the physiological response of hosts to parasites (Middlemis Maher et al. Reference Middlemis Maher, Werner and Denver2013; Marino et al. Reference Marino, Holland and Middlemis Maher2014). However, much variation in infection in our study also remains unexplained. Several factors that we hypothesized could influence definitive host visitation to ponds (e.g. pond size) and parasite production (e.g. canopy cover) provided no explanatory power. Unmeasured variation in individual host traits (e.g. immunocompetence) and stochasticity in definitive host visitation to ponds and host–parasite contact rates at multiple life stages likely contribute to unexplained variation. Furthermore, the presence of alternative hosts or predators may also have influenced observed infection patterns (Wojdak et al. Reference Wojdak, Edman, Wyderko, Zemmer and Belden2014; Rohr et al. Reference Rohr, Civitello, Crumrine, Halstead, Miller, Schotthoefer, Stenoien, Johnson and Beasley2015).
We also found a surprisingly high level of diversity in echinostome species on the ESGR based on our sequencing results, including representatives from five genera. Our focus here was on general patterns and consequences of echinostome distributions. However, ecological differences among echinostome species or strains may contribute to some of the observed spatial and temporal variation. Future work should attempt to examine how species-level variation contributes to broader, family-level patterns.
Our results also indicate that natural levels of parasitism may reduce host survivorship. Survivorship was negatively associated with echinostome infection in green frogs in enclosures. Echinostomes have been demonstrated to reduce larval frog survivorship in experimentally exposed animals in previous experiments (Holland et al. Reference Holland, Skelly, Kashgarian, Bolden, Harrison and Cappello2007; Holland, Reference Holland2010; Marino et al. Reference Marino, Holland and Middlemis Maher2014), but our results are the first to directly relate natural exposure to reduced larval survivorship (but see Beasley et al. Reference Beasley, Faeh, Wikoff, Staehle, Eisold, Nichols, Cole, Schotthoefer, Greenwell, Brown and Lannoo2005 for evidence of a similar pattern observed in cricket frogs, Acris crepitans, in largely human-impacted ponds). Notably, we only measured infection in tadpoles that survived the enclosure experiment due to rapid degradation of dead tadpoles in the field. We therefore may be underestimating the effect of echinostomes on survival, as tadpoles experiencing the highest infection levels would be most likely to suffer mortality due to parasite dose-dependent effects (Marino et al. Reference Marino, Holland and Middlemis Maher2014).
Another consideration is that tadpoles in enclosures were infected with relatively few metacercariae compared with individuals collected during the field survey. The reasons for this difference may be a longer duration of exposure for the field collected tadpoles, the limited number of ponds used for the enclosure study, or cage effects. For example, cages may have reduced contact of tadpoles with cercariae if the mesh acted as a barrier to cercariae movement. Such cage effects could further lead to underestimating typical effects of echinostomes on tadpole survival in nature.
Changes in tadpole density in cages throughout the duration of the experiment may also have influenced observed patterns of infection. Higher host density might be expected to reduce host infection levels due to an ‘encounter dilution’ effect (Rifkin et al. Reference Rifkin, Nunn and Garamszegi2012). However, evidence from mesocosm studies suggests that increased tadpole density has no effect (Raffel et al. Reference Raffel, Hoverman, Halstead, Michel and Rohr2010; Marino et al. Reference Marino, Holland and Werner2016) or even a positive effect (Wojdak et al. Reference Wojdak, Edman, Wyderko, Zemmer and Belden2014) on individual infection levels. We thus expect that encounter dilution is unlikely to explain the observed negative relationship between infection and survival here, and our results instead represent a negative effect of parasite infection on survival.
However, alternative explanations for differential survival should also be noted, as conditions under which parasites thrive may be poorer conditions for tadpoles generally. For instance, other parasites and pathogens occur in some of the surveyed ponds (e.g. Ribeiroia ondatrae, Batrachochytrium dendrobatidis), which occur at lower prevalence (Zellmer et al. Reference Zellmer, Richards and Martens2008, J. Marino, unpublished data), but could have affected survival if study tadpoles were exposed and infected. In particular, trematode parasite distributions can be correlated in amphibian hosts (Johnson and Hoverman, Reference Johnson and Hoverman2012), likely because snail distributions are correlated and the same snail host species is used by multiple parasites. For instance, we observed eight morphologically distinct trematode cercariae from P. trivolvis on the ESGR over the course of the survey, several of which are known to infect amphibians, although echinostomes were the most common group observed. We also found that, after accounting for differential infection, there was a non-significant trend of lower survival in open habitats than structured habitats. The underlying mechanism is unclear, but lower food resources available in open microhabitats may offer an explanation.
Nevertheless, our results are consistent with echinostome effects on larval frog survival, which has both ecological and evolutionary implications. Larval mortality can be important for amphibian population dynamics, depending on environmental context (Vonesh and De la Cruz, Reference Vonesh and De la Cruz2002; Karraker et al. Reference Karraker, Gibbs and Vonesh2008), and likely influences host community structure through apparent competition, as host species differ in susceptibility (Holland, Reference Holland2010; Rohr et al. Reference Rohr, Raffel and Hall2010). Effects on larval survivorship also have feedbacks to parasite population dynamics, if parasites have a regulatory role in amphibian populations or if amphibian hosts are a limiting step in the parasite life cycle. Effects of echinostomes also interact with other stressors, such as predation (Thiemann and Wassersug, Reference Thiemann and Wassersug2000; Marino and Werner, Reference Marino and Werner2013) or competition (Koprivnikar et al. Reference Koprivnikar, Forbes and Baker2008; Marino et al. Reference Marino, Holland and Werner2016), which should be addressed in future field studies. Evidence of fitness costs of parasitism in the field also indicates the potential for parasite-mediated natural selection, which would contribute to species-level differences in susceptibility (Rohr et al. Reference Rohr, Raffel and Hall2010; Koprivnikar et al. Reference Koprivnikar, Redfern and Mazier2014) and suggests the potential for local adaptation. Moreover, the extensive variation in host–parasite associations over space and time could select for plasticity in host defences (e.g. a behavioural avoidance response, Koprivnikar et al. Reference Koprivnikar, Forbes and Baker2006).
Finally, these findings also have conservation implications, as echinostomes are strongly associated with human activities (Skelly et al. Reference Skelly, Bolden, Holland, Freidenburg, Friedenfelds, Malcolm, Collinge and Ray2006; King et al. Reference King, McLaughlin, Gendron, Pauli, Giroux, Rondeau, Boily, Juneau and Marcogliese2007; Rohr et al. Reference Rohr, Schotthoefer, Raffel, Carrick, Halstead, Hoverman, Johnson, Johnson, Lieske, Piwoni, Schoff and Beasley2008), and disease is believed to play a role in recent global amphibian declines (Stuart et al. Reference Stuart, Chanson, Cox, Young, Rodrigues, Fischman and Waller2004). Given that we found evidence for effects of infection on survival in a natural setting, where infection rates are lower than developed areas, parasite effects should be a major concern in populations where infection is elevated due to anthropogenic stressors. Future work examining links between environmental factors, parasite distributions among hosts and the consequences for host fitness and vital rates in more disturbed habitats should be informative. Furthermore, linking these patterns with amphibian and parasite populations across both host and parasite life cycles are needed to evaluate longer-term dynamical consequences.
SUPPLEMENTARY MATERIAL
The supplementary material for this article can be found at https://doi.org/10.1017/S0031182016002547
ACKNOWLEDGEMENTS
We would like to thank two anonymous reviews for comments that improved the manuscript. We thank Chris Davis for help planning and performing the field survey; Ariel Heldt, Alexandria Novo, Nicholas Gezon, Alex Stuart, Jessica Middlemis Maher, and Liz Wason for assistance in the field and laboratory; the ESGR amphibian survey group for sharing their data; Liliana Cortés Ortiz and Tom Duda for assistance with molecular work in the University of Michigan Genomic Diversity Laboratory; Daniela Vergara, Aaron King, Ines Ibanez and the Ecology and Evolution of Infectious Diseases workshop for help with analyses.
FINANCIAL SUPPORT
This study was supported by the National Science Foundation (J. A. M. and E. E. W., DEB 1110137) and the University of Michigan Edwin S. George Reserve Scholarship Award.