INTRODUCTION
Ecosystems are already being affected by global climate change, especially temperature increase (Walther et al. Reference Walther, Post, Convey, Menzel, Parmesan, Beebee, Fromentin, Hoegh-Guldberg and Bairlein2002; Parmesan Reference Parmesan2006; IPCC 2007a). The agricultural sector is known to be particularly vulnerable to climate variability as the growth and development of cultivated crops is closely linked to climatic variables. Modelling studies have documented that global warming will adversely affect crop yield and global food security (Parry et al. Reference Parry, Rosenzweig, Iglesias, Livermore and Fischer2004; Schmidhuber & Tubiello Reference Schmidhuber and Tubiello2007; Lobell et al. Reference Lobell, Burke, Tebaldi, Mastrandrea, Falcon and Naylor2008). A recent report synthesized by the Intergovernmental Panel on Climate Change (IPCC) suggests that global warming will have increasingly negative yield impacts for the major cereal crops all over the world at the end of 21st century (IPCC 2007a). A few observational studies have reported the negative relationship between growing season temperature and crop yield (Lobel & Asner Reference Lobell and Asner2003; Peng et al. Reference Peng, Huang, Sheehy, Laza, Visperas, Zhong, Centeno, Khush and Cassman2004; Lobell Reference Lobell2007; Kucharik & Serbin Reference Kucharik and Serbin2008). To identify and assess crop adaptation, there is a pressing requirement for more observational field studies to achieve detailed knowledge about how crops respond to global warming. Observations on long-term agroecosystem experiments, made across time scales of decades, provide unique opportunities to document these responses (Rasmussen et al. Reference Rasmussen, Goulding, Brown, Grace, Janzen and Korschens1998).
Soybean (Glycine max (L.) Merr.) was first domesticated in Northeast China and has become the staple food for people and high protein feed supplements for livestock. Continued increase in soybean yield will be required to meet the growing demand worldwide. However, recent observational studies revealed that soybean yield in the USA could be adversely affected by average temperature increase during the summer growing season (Lobel & Asner Reference Lobell and Asner2003; Kucharik & Serbin Reference Kucharik and Serbin2008). Northeast China is the top soybean-producing region in the world (Editorial Board – China Agriculture Press 2006; FAOSTAT 2006). Therefore, evaluating the response of soybean yield in this region to global warming will be of particular concern.
The overwhelming majority of the studies have focused on crop yields associated with changes in average daily temperature (IPCC 2007a). An important assumption in recent studies is that there was no difference in the yield impacts of daily daytime and night-time temperature. Recent observational studies show that the potential response of crops to the extreme daily temperatures has become a key concern (Nicholls Reference Nicholls1997; Peng et al. Reference Peng, Huang, Sheehy, Laza, Visperas, Zhong, Centeno, Khush and Cassman2004; Tao et al. Reference Tao, Yokozawa, Xu, Hayashi and Zhang2006; Lobell & Field Reference Lobell and Field2007). In soybean, most studies have used controlled temperature chambers (Gibson & Mullen Reference Gibson and Mullen1996; Allen & Boote Reference Allen, Boote, Reddy and Hodges2000) and projected climate change scenarios (Lal et al. Reference Lal, Singh, Srinivasan, Rathore, Naidu and Tripathi1999; Mall et al. Reference Mall, Lal, Bhatia, Rathore and Singh2004) to explore the impacts of increases in day/night temperature on grain yield. Yet few, if any, observational field studies consider the differential effects of changes in daily minimum temperature (T min), daily maximum temperature (T max) and diurnal temperature range (DTR). The global mean trends in minimum and maximum land-surface air temperature were respectively 2·04°C per 100 years and 1·41°C per 100 years since the 1950s (Vose et al. Reference Vose, Easterling and Gleason2005), and projections suggest that future changes will be greater (IPCC 2007b). Associated with such asymmetric warming, widespread reduction in the DTR has been observed in many parts of the world (Vose et al. Reference Vose, Easterling and Gleason2005). A key objective of the present study was to examine the responses of soybean yield to the asymmetric diurnal temperature changes from global warming. The analysis was conducted on experimental and climatic data from a long-term fertilization experiment in Northeast China. The objectives of the present paper were to: (i) examine which temperature parameters have significant impacts on soybean yields; (ii) test whether the different fertilization treatments respond differently to changes in temperature variables; and (iii) investigate the impacts of the trends in recent temperatures on soybean yields.
MATERIALS AND METHODS
Study site and experimental design
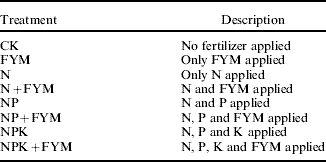
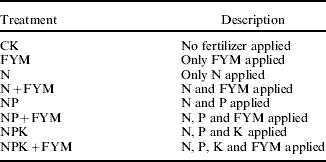
The long-term experiment was conducted in the Hailun Experimental Station of Agricultural Ecology, Chinese Academy of Sciences (Heilongjiang, China, 47°26′N, 126°38′E). The station is in a temperate continental monsoon zone with an annual mean temperature of 2·41°C and annual precipitation of 464 mm (based on data since 1979). The topography is flat with an elevation of 240 m asl. The growing season for dry crops of soybean, wheat and maize is confined to May–September. The experiment was initiated in 1985 and included three blocks for crop rotation of wheat–maize–soybean. Each crop was present each year. Eight fertilization treatments with three replications were established in each block and each treatment covers 224 m2 (40×5·6 m). Rotation and fertilizer treatments started in 1985, but there was no farmyard manure (FYM) addition in the first 2 years. Fertilizer and FYM treatments used since 1987 are given in Table 1. The same cultivar was used in each treatment, Heinong 35 (G. max (L) Merr.) for soybean, Haiyu 6 (Zea mays L.) for maize and Long 4083 (Triticum aestivum L.) for wheat; these are representative cultivars for the study region. N, P and K were added as urea, diammonium hydrogen phosphate and potassium sulphate. The annual application rate of N, P and K was the same in all the treatments with no adjustment to compensate for nutrients in the FYM. N was applied at rate of 107·2 kg N/ha for wheat and maize, but zero for soybean; P and K were applied at rates of 18·6 kg P/ha and 60 kg K/ha, respectively. FYM is defined as follows: 0·80 of harvested grain from each treatment was fed to pigs, and straw was shredded into pieces and placed into the pigsties. The decomposed, mixed manure and residues were applied annually to the original plots where the grain and straw came from, forming a closed system. The design of the experiments is described in more detail by Han et al. (Reference Han, Wang, Veneman and Xing2006). Soybean was planted in early May at a sowing rate of 55 kg/ha; wheat and maize were planted in early April at a rate of 250 kg/ha and in early May at a rate of 30 kg/ha, respectively. The three crops were all seeded with rows spaced 0·65 m apart. Herbicides and pesticides were applied prophylactically at seeding. The pesticides were used at the same rates for all the treatments. No irrigation was used in any of the treatments during the study period.
The fertilization treatments used in the long-term experiment
Data collection
Daily weather data have been recorded since 1952 at Hailun meteorological station located about 2 km from the long-term experiment site. Minimum temperature, maximum temperature, precipitation, sunshine and cloud data for the Hailun meteorological station were obtained from the Chinese Meteorological Agency (http://data.cma.gov.cn/index.jsp, verified 8 April 2009). Average annual and growing season (May–September) climatic parameters were calculated over two periods (1979–2004 and 1987–2004). Data from the two periods were used to examine trends in changes of climate variables and data from 1987 to 2004 were used to evaluate the response of soybean yields to seasonal climate variability. Soybean in all the treatment plots was harvested from a 1 m2 (1 m×1 m) area for each replication in early October. Plants were separated into straw and grain and dry weight of grain was determined after oven drying at 70°C to constant weight. Grain yield was adjusted to a water content of 125 g dry matter/kg fresh weight. The average of soybean yield from the three replicates for each fertilization treatment in each year was used as the dependent variable in subsequent analyses.
Statistical analysis
All data analyses were performed by SYSTAT 12 (Systat Software, San Jose, CA, USA). The significance of time trends in changes of temperature parameters and soybean yields was analysed using the Student's t test. Pearson correlations were used to analyse the relationship between DTR and cloud, and between DTR and precipitation. Analysis of covariance with fertilization treatments as the factors and temperature variables as the covariate was conducted on the yield data. Temperature with treatment interaction was used to test differences in the temperature response of soybean yields between any two fertilization treatments.
Two different models were used to account for long-term variation in soybean yield caused by changes in extreme daily temperatures. To minimize the possible influences of non-climatic factors such as technology, a first-difference time series for yield and climatic variables was used (Nicholls Reference Nicholls1997; Lobell & Field Reference Lobell and Field2007). This approach calculated annual year-to-year changes in each variable. Multiple linear regressions were then performed with first differences in yields (ΔYield) as the response variables, and first differences of climatic parameters (ΔDTR, ΔT min, ΔT max, ΔP, ΔS) as predictor variables. The models are given by


where ΔYield represents the change in yield, ΔDTR is the change in DTR change (°C), ΔP is the change in precipitation (mm), ΔS is the change in sunshine duration (hour), ΔT min is the change in minimum temperature (°C), ΔT max is the change in maximum temperature (°C), δa and δA are the model intercepts, other δ values are the coefficients for each climate variable, and ∊1 and ∊2 are the model errors.
To avoid biasing results of regression models, precipitation and sunshine, which generally correlate to temperatures, were also considered in the models. Collinearity among the parameters was screened by using variance inflation factors (VIFs). All VIFs were less than three and most were substantially less, suggesting that collinearity did not strongly affect the precision of these models. In all the linear regression models, the important assumption is that climate changes were not highly correlated with improvement of technology and management.
RESULTS
Soybean yield and temperature trends
Trends for soybean yields under the eight treatments over the last 18 years are shown in Table 2. The linear regressions of yields vs. time had positive slopes and were statistically significant (P<0·05) in all the treatments. The annual increases in soybean yield ranged from 0·021 t/ha/yr in the CK treatment to 0·058 t/ha/yr in the NPK+FYM treatment.
Trends (t/ha/yr) in soybean yields of different treatments from 1987 to 2004

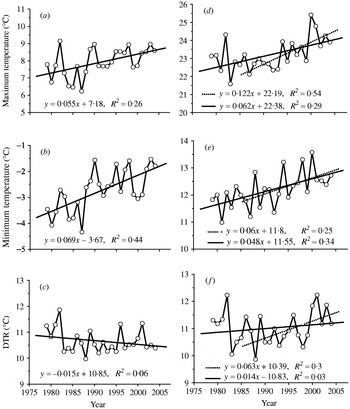
Significant warming trends (P<0·01) in annual T max and T min (Fig. 1a, b) were detected from 1979 to 2004. On average, annual mean T max and T min increased by 0·55 and 0·69°C per decade, respectively. Mean T max for the growing season (Fig. 1d) increased at a faster rate than that for the whole year (Fig. 1a), while mean T min (Fig. 1e) increased at a slower rate than that for the whole year (Fig. 1b). During the study period (1987–2004), the warming trends for the growing season as indicated by T max and T min were 1·22 and 0·6°C per decade, respectively. The rate of warming for the growing season was stronger from 1987 to 2004 than from 1979 to 2004, where records were available (Fig. 1d and e).
Time series of annual and growing season average maximum temperature, minimum temperature and DTR at Hailun Experimental Station for Agricultural Ecology in northeast China: (a–c) the whole year and (d–f) the growing season (May–September). The solid and dotted lines represent the trends of the periods from 1979 to 2004 and from 1987 to 2004, respectively.

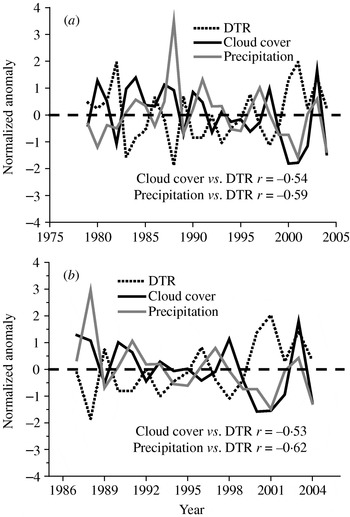
Daily T min increased much faster than T max, and thus a substantial reduction in DTR (−0·147°C per decade) was observed for the whole year during the period 1979–2004 (Fig. 1c). However, trends of increasing DTR for the growing season were found over both of the periods, with increases of 0·14 and 0·63°C per decade for 1979–2004 and 1987–2004, respectively (Fig. 1f). Moreover, the DTR series for 1987–2004 showed a significant warming trend (P<0·05). Variations in DTR were significantly negatively correlated with those in total cloud cover and precipitation (P<0·05) in the study region (Fig. 2).
Anomalies of DTR, cloud cover and precipitation for the growing season: (a) 1979–2004 and (b) 1987–2004. All of the variables were normalized by subtracting their means divided by their standard deviation.

Relationships of soybean yields and seasonal climate variability
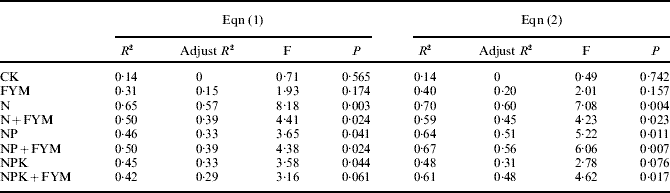
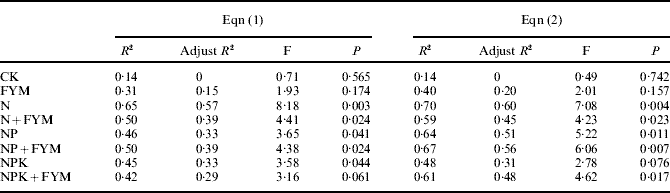
Empirical statistical models (Eqns (1) and (2)) were adopted to explore climate–yield relationships for all the treatments. There were strong effects of variation in growing season climate on soybean yields (P<0·08), except for the CK and FYM treatments (Table 3). High coefficients of determination (R 2) were obtained from these equations, which indicate that the linear regressions can accurately describe the relationships between climate change and soybean yields. At least 0·42 of soybean yield variability can be explained by these year-to-year climatic variables (Table 3). Eqns (1) and (2) were also applied for maize and wheat. The regression analysis results indicated that there was no significant relationship (P>0·15) between climate variability and the crop yields under any treatment.
Results of multiple regression models between first differences of yield (t/ha/yr) and climatic parameters (1987–2004)
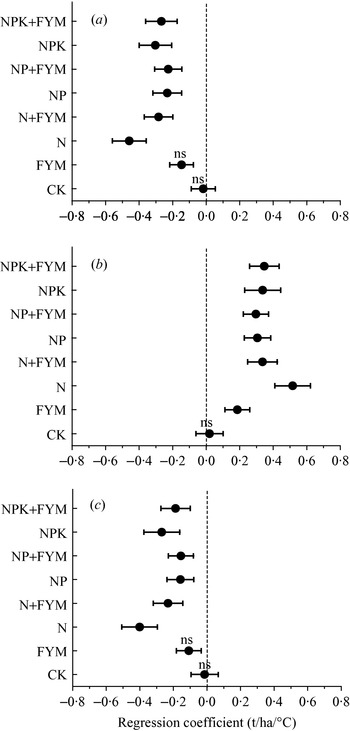
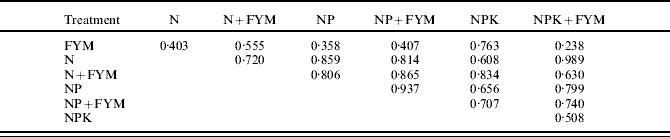
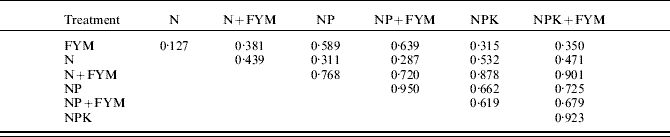
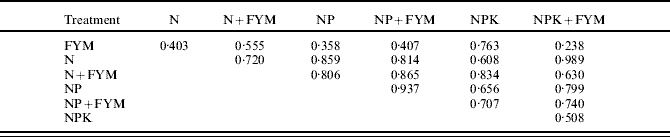
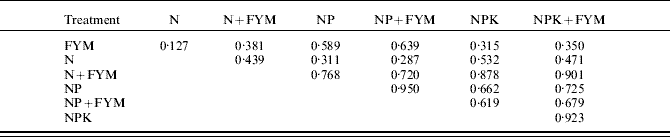
To specifically investigate the responses of crop yields to each temperature variable, the regression model coefficients on the temperature variables of different treatments were extracted from these multiple regression equations. Close association was found between soybean yields in most of the treatments and year-to-year variability in DTR, T max and T min (P<0·05; Fig. 3), but changes in these climate variables did not significantly (P>0·11) affect maize or wheat yield. Although estimated coefficients on these three temperature parameters varied among the treatments (Fig. 3), analysis of covariance revealed that there were no significant differences (P>0·1) between any two treatments on the responses of soybean yields to T max (Table 4), T min (Table 5) and DTR (Table 6). However, there were significant negative relationships between soybean yields and DTR, except in the CK and FYM treatments (P<0·05; Fig. 3a). Further analyses of the separate effects of T max from Eqn (2) demonstrated that T max had relatively strong negative effects on soybean yields (P<0·05), except for the CK and FYM treatments (Fig. 3c), while the separate effects of T min showed that soybean yields were estimated to have significant positive responses to T min (P<0·05), except in the CK treatment (Fig. 3b).
Response of soybean yields change to (a) DTR change, (b) minimum temperature change and (c) maximum temperature change for different treatments. Error bars indicate the 95% confidence intervals for the mean.

The significance (P values) of the effect of interactions between any two treatments and T max on soybean yields

The significance (P values) of the effect of interactions between any two treatments and T min on soybean yields
The significance (P values) of the effect of interactions between any two treatments and DTR on soybean yields
Effects of recent global warming on soybean yields
Multiple regression models were applied to quantify the degree to which recent warming climate has influenced soybean yields. The resulting negative coefficients for DTR (Fig. 3a) from Eqn (1) revealed that the trend towards an increased DTR for the growing seasons in 1987–2004 had a statistically significant negative effect on soybean yields in all except the CK and FYM treatments. Based on these significant regression coefficients, the analysis indicated that a relative decrease in soybean yields of 14–28% was credited to the warming trend in DTR (Fig. 4a). The largest yield reduction occurred in the N treatment. Although the separate effects of T min from Eqn (2) indicated that recent warming trend in T min resulted in increases in soybean yields (17–31%; Fig. 4b), but these yield increases were wholly offset by large reductions due to rapidly increasing T max (18–49%; Fig. 4c). While the separate impacts of T min and T max were considered at the same time, the estimates showed that soybean yields had decreased by 1–18% for climate warming over the past 18 years. To further measure the effects of global warming on soybean yield, the relatively stronger impact of DTR and T max on yield over the positive effect of T min was analysed. The result of the analysis exhibited a substantial negative impact of recent warming on yields, with yield decreases from 15% for the NP+FYM treatment to 47% for the N treatment.
Estimated soybean yield impacts of trends in (a) DTR, (b) minimum temperature and (c) maximum temperature during 1987–2004. Negative values indicate yield decreases. Error bars show the 95% confidence intervals.

DISCUSSION
The annual increases in T max (Fig. 1a) and T min (Fig. 1b) were nearly twice that of the corresponding linear trends of 0·29°C per decade for both T max and T min over the global land areas for the same period (Vose et al. Reference Vose, Easterling and Gleason2005). The trend for greater temperature increases in the study region indicates that it is one of the warming regions of the world, which was in agreement with the finding that current warming trend is generally larger at high latitudes in the Northern Hemisphere (Hansen et al. Reference Hansen, Sato, Ruedy, Lo, Lea and Medina-Elizade2006). A few studies (Easterling et al. Reference Easterling, Horton, Jones, Peterson, Karl, Parker, Salinger, Razuvayev, Plummer, Jamason and Folland1997; Stone & Weaver Reference Stone and Weaver2003; Vose et al. Reference Vose, Easterling and Gleason2005) have reported an increase in daily T min exceeding the increase in daily T max, resulting in a trend for narrowing DTR over most land areas since the 1950s. However, associated with the asymmetric warming in T max (Fig. 1d) and T min (Fig. 1e), a significant increase in growing season DTR (Fig. 1f) was observed in the long-term experiment during the study period. This increased trend in DTR was primarily explained by the decreases in both clouds and precipitation in the growing season (Dai et al. Reference Dai, Del Genio and Fung1997; Stone & Weaver Reference Stone and Weaver2003). The aim of the present study was to investigate the impacts of these climatic changes on crops yield, which should be of general interest, especially to those concerned about crop responses to rapid global warming.
In the present study, strong negative relationships between DTR and soybean yields were detected. This is in accordance with previous studies that have reported that there were many locations where other crops yields were negatively related to DTR, such as wheat in Australia and Canada (Nicholls Reference Nicholls1997; Lobell Reference Lobell2007), rice in Philippines, China, India and Bangladesh (Lobell Reference Lobell2007), maize in US, China, Brazil, France, India and Italy (Lobell Reference Lobell2007). A possible explanation for these negative relationships is that high temperature results in direct heat stress as well as increased evapotranspiration, and consequent water stress, which reduces plant photosynthesis and crop growth (Dhakhwa & Campbell Reference Dhakhwa and Campbell1998; Lobell Reference Lobell2007). The combination of high temperature and drought in summer can lead to considerable reduction in plant productivity (Ciais et al. Reference Ciais, Reichstein, Viovy, Granier, Ogee, Allard, Aubinet, Buchmann, Bernhofer, Carrara, Chevallier, De Noblet, Friend, Friedlingstein, Grunwald, Heinesch, Keronen, Knohl, Krinner, Loustau, Manca, Matteucci, Miglietta, Ourcival, Papale, Pilegaard, Rambal, Seufert, Soussana, Sanz, Schulze, Vesala and Valentini2005). In the study area, growing season T max has increased by 2·2°C for the period 1987–2004. Moreover, clear declined trends of growing season precipitation were observed (Fig. 2). The existence of rapid increases in T max and reduced precipitation may confirm the above explanation of the negative relationships. However, the relative importance of the negative effects of heat and water stress could not be examined in the present report.
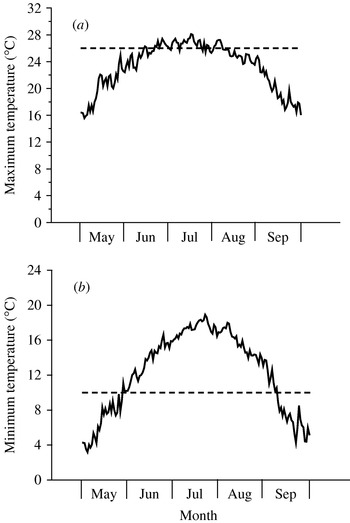
In soybeans, plants were very sensitive to temperature and precipitation at the earlier stages (e.g. flowering and pod) of reproductive growth (Egli & Wardlaw Reference Egli and Wardlaw1980; Ferris et al. Reference Ferris, Wheeler, Hadley and Ellis1998). High temperatures and water deficit during these periods greatly reduced photosynthesis and seed yields of soybean (Ferris et al. Reference Ferris, Wheeler, Hadley and Ellis1998). A controlled temperature study showed that soybean seed germination and growth were reduced when plants were exposed to high temperatures during flowering and pod set or seed fill (Gibson & Mullen Reference Gibson and Mullen1996). Other controlled temperature studies have shown that pod numbers and yield of soybean decreased when plants were grown at season-long T max exceeding 26°C (Huxley et al. Reference Huxley, Summerfield and Hughes1976; Sionit et al. Reference Sionit, Strain and Flint1987). During the period considered by the present study, soybean plants experienced a long period (from mid-June to mid-August) of T max greater than 26°C (Fig. 5a). This could be a possible explanation for the negative impact of the greater T max on soybean yields in the long-term experiment. In addition, water deficit stress due to decreased growing season precipitation and increased evaporative demand resulted from the higher temperature may represent an important factor in determining the negative yield response.
Distribution of (a) the mean daily maximum temperature and (b) the mean daily minimum temperature, both during the growing season (May–September) in 1987–2004. The horizontal dashed line shows the days above (a) 26°C or (b) 10°C.

Miller et al. (Reference Miller, McConkey, Clayton, Brandt, Staricka, Johnston, Lafond, Schatz, Baltensperger and Neill2002) reported that soybean had lower water use efficiency when compared with other pulse crops. Thus, for the rainfed area with asymmetric precipitation distribution during the growing season, soybean water stress could occur at various stages of development, but especially during flowering and pod set (Haskett et al. Reference Haskett, Pachepsky and Acock2000). Although water stress during the seed filling period did not affect soybean seed growth, it shortened the seed-filling period and resulted in smaller seed size and yield loss by accelerating leaf senescence (Egli & Bruening Reference Egli and Bruening2004). On the basis of the above analysis, it is suggested that adaptation strategies should be developed to enhance soybean adaptation to high temperature and water stress. In this respect, breeding and selection of types with improved heat and drought tolerance, efficient water use and moisture-conserving growing habits will provide advantages for the study region (Miller et al. Reference Miller, McConkey, Clayton, Brandt, Staricka, Johnston, Lafond, Schatz, Baltensperger and Neill2002; Cutforth et al. Reference Cutforth, McGinn, McPhee and Miller2007).
Recent observational studies suggested that increasing T min caused the observed decrease in yield of wheat in Mexico (Lobell et al. Reference Lobell, Ortiz-Monasterio, Asner, Matson, Naylor and Falcon2005) and of rice in the Philippines (Peng et al. Reference Peng, Huang, Sheehy, Laza, Visperas, Zhong, Centeno, Khush and Cassman2004). This is in contrast to the present study for soybean in Northeast China and another study for wheat in Australia (Nicholls Reference Nicholls1997), where a rise in T min was found to increase crop yields. Additionally, the present study revealed that there was no significant response of maize or wheat yields to higher T min. These findings imply that the responses of crop yields to T min differ, both between crops and within the same crop grown in different regions. For soybean, the present results agree with Seddigh & Jolliff (Reference Seddigh and Jolliff1984) and Gibson & Mullen (Reference Gibson and Mullen1996) who reported that higher T min benefited grain yield and T min stress did not occur at 30°C. However, soybean is a warm-season crop and the base night-time temperature is c. 10°C (Cutforth et al. Reference Cutforth, McGinn, McPhee and Miller2007). If night-time temperature is lower than the base temperature, soybean seed germination, growth and production will be severely limited. In Ontario, Canada, a key adaptation to address this constraint was the introduction of cold-tolerant genetic material (Smithers & Blay-Palmer Reference Smithers and Blay-Palmer2001). In the experimental plots studied in the current programme, the mean date for onset of the base temperature occurred in late May over the past 18 years (Fig. 5b), which was about 20 days after planting. Therefore, higher T min appears to help reduce the risk of spring frost for soybean. In this regard, Nicholls (Reference Nicholls1997) have reported that increases in Australian wheat yields were predominantly attributed to the reduction in frost frequency from rapid increases in T min. Moreover, if earlier planting dates coincide with increases in T min, higher soybean yield will be produced, because plants can grow longer in favourable growing conditions and will accumulate more biomass. However, planting too early risks frost damage and it is necessary to determine a precise planting date to avoid frost year by year.
The present research suggests that recent asymmetric day/night warming trends in the study area have led to a discernable reduction in soybean yields. The effects of higher T max were the dominant contributor to the reduction. However, the magnitude of these warming effects is uncertain, because the contributions of genetic improvement, CO2 fertilization and advances in agronomic management to yield trends were not considered. Researchers have found that genetic improvement of soybean cultivars had resulted in a 0·8% (13·7 kg/ha) annual yield gain in the experimental site since 1980 (Jin et al. Reference Jin, Wang, Liu, Xu, Mi, Wang and Herbert2007). This result is very similar to other reports (0·5–1·0% annual genetic gains) in Canada and USA in the past few decades (Leudders Reference Leudders1977; Wilcox et al. Reference Wilcox, Schapaugh, Bernard, Cooper, Fehr and Niehaus1979; Voldeng et al. Reference Voldeng, Cober, Hume, Gillard and Morrison1997). Studies of the direct fertilization effects of rising CO2, have shown that the relative enhancement of soybean yield would be, on average, 1·24 at 700 μmol/mol relative to 370 μmol/mol CO2 (Ainsworth et al. Reference Ainsworth, Davey, Bernacchi, Dermody, Heaton, Moore, Morgan, Naidu, Ra, Zhu, Curtis and Long2002; Morgan et al. Reference Morgan, Bollero, Nelson, Dohleman and Long2005; Ziska & Bunce Reference Ziska and Bunce2007). Based on the mean response ratio of soybean yield to CO2 and annual mean CO2 growth rate (1·4 μmol/mol per year) since 1950 (IPCC 2007b), there is a 0·1% annual increase obtained in soybean yield derived from the CO2 fertilization effect. Although implementation of agronomic technology requires a long time, management practices, such as better weed control, changing planting date and lower harvest losses may be playing a significant role in yield trends. All these potential yield gains were likely offset to some extent by the negative impact of warming.
A recent study demonstrated that soybean yields in Wisconsin, US Corn Belt, could potentially decrease by 16% for every 1°C rise of future warming during summer months (Kucharik & Serbin Reference Kucharik and Serbin2008). The present study confirms the result of Kucharik & Serbin (Reference Kucharik and Serbin2008) that soybean will suffer due to global warming. Long, hot and dry summers could be commonplace in the future (Meehl & Tebaldi Reference Meehl and Tebaldi2004; IPCC 2007b; Schiermeier Reference Schiermeier2008). Therefore, it is expected that agricultural adaptation options will be urgently required to enable soybean to adapt. A combination of adjustments in breeding efforts and changes in agronomic management practices appears to be available for soybean adaptation. These adaptation options can include the introduction of new varieties tolerant to heat and drought, irrigation, no-till practices, crop rotations and early planting (Cutforth et al. Reference Cutforth, McGinn, McPhee and Miller2007; De Bruin & Pedersen Reference De Bruin and Pedersen2008). However, model studies have shown that the benefits of adaptations will vary among scenarios of climate changes considered (Rosenzweig & Parry Reference Rosenzweig and Parry1994; IPCC 2007a). Thus, many unpredictable barriers to adaptations such as more severe climate change and frequent extreme events in the future may limit their effectiveness. Precision weather or climate forecasts will be a critical tool in this endeavour. For the purposes of food security, it is essential to explore more effective adaptation options to deal with climate change, which include both autonomous and planned adaptations (Howden et al. Reference Howden, Soussana, Tubiello, Chhetri, Dunlop and Meinke2007). These adaptations can occur at a range of spatial scales including plant, plot, field, farm, region and nation, and in various sectors including individual producers, local communities, private sector and local or national government (IPCC 2007c). More importantly, an adaptation development and assessment framework needs to be established (Howden et al. Reference Howden, Soussana, Tubiello, Chhetri, Dunlop and Meinke2007), with specific aspects undertaken by scientists and development organizations, government, agribusiness and farmers. International scientists need to develop and assess benefits of adaptation strategies, government and development organizations need to provide incentives and develop accompanying education programmes, agribusiness needs to develop new products and services for support, and finally, farmers need to accept and put new adaptation strategies into practice.
In conclusion, the present study revealed that recent rapid warming trends in growing season temperatures have had substantial negative effects on soybean yields in the study area. The estimates of the impacts may be characterized by uncertainties, which arise from the potential confounding effects of other factors, such as genetic improvement, increased CO2, advanced technology (the technology trend) and adaptation options year by year (e.g. planting dates). Nonetheless, the present report confirms the conclusions of previous studies that the impacts of temperature rising by a few degrees have probably cancelled out some of the increases in soybean yields due to increased CO2, advanced technology and other non-climatic factors (Mall et al. Reference Mall, Singh, Gupta, Srinivasan and Rathore2006; Lobel & Field Reference Lobell and Field2007; Kucharik & Serbin Reference Kucharik and Serbin2008). To understand the net impacts of recent climate change, there is a need for reducing these uncertainties and continued field research. It is widely believed that the trends of global warming and drought will continue and even accelerate in the future (IPCC 2007b). Effective adaptation options should be adopted by farmers across Northeast China to improve ability of soybean systems to adapt to climate change. It is expected that a second ‘Green Revolution’ or ‘Blue Revolution’ in agriculture will be required to enable plants to adapt to water scarcity (Pennisi Reference Pennisi2008; Schiermeier Reference Schiermeier2008). Furthermore, society must continue to develop new technologies for adaptation of soybean to climate change.
The authors thank N. B. McLaughlin, Agriculture and Agri-Food Canada, for providing review of earlier drafts of this manuscript and helping with English revisions, and all of the people involved in the long-term experiments of Hailun Experimental Station. This work was supported by the National Basic Research Program of China (2005CB121107), the National Natural Science Foundation of China (40621061) and the Chinese Academy of Sciences (KZCX2-YW-421).