Introduction
Shifting cultivation is an agricultural production system in which land is cleared of vegetation for cultivation of crops, and after a few years of cultivation abandoned for a new area whilst the land can regenerate as a fallow before it is cleared and cultivated again (Conklin, Reference Conklin1961). It continues being an important driver for forest structure and change in the Amazon region (Coomes et al., Reference Coomes, Takasaki and Rhemtulla2011; Jakovac et al., Reference Jakovac, Dutrieux, Siti, Peña-Claros and Bongers2017). Prior to cultivation, the aboveground vegetation is normally slashed and burned, as a method of clearing the land and supplying nutrients to the soil in available form for crop uptake via the biomass ashes (e.g., Andriesse and Schelhaas, Reference Andriesse and Schelhaas1987; Brinkmann et al., Reference Brinkmann, Nascimento, Brinkmann and Nascimento1973; Stromgaard, Reference Stromgaard1984). The fallow period between the crop cultivation cycles plays a key role in sustaining the productivity of these systems (Jakovac et al., Reference Jakovac, Peña-Claros, Mesquita, Bongers and Kuyper2016; Wood et al., Reference Wood, Rhemtulla and Coomes2017). The re-growing vegetation during fallow accumulates nutrients (Feldpausche et al., Reference Feldpausch, Rondon, Fernandes, Riha and Wandelli2004; Hölscher et al., Reference Hölscher, Möller, Denich and Fölster1996; Hughes et al., Reference Hughes, Kauffman and Cummings2002), can increase soil organic matter (Bruun et al., Reference Bruun, Ryan, de Neergaard and Berry2021; Greenland and Nye, Reference Greenland and Nye1959; Lemos et al., Reference Lemos, Vasconcelos, Santiago, de Oliveira and Souza2016), controls soil erosion (Sanchez, Reference Sánchez1982), suppresses herbaceous weeds (De Rouw, Reference De Rouw1995) and breaks down pest and disease cycles (Bianchi et al., Reference Bianchi, Booij and Tscharntke2006). In the Amazon region, human population growth, increased demand for food products and the associated increased demand for land, especially in the context of forest conservation, have led to reduced lengths of fallow periods in shifting cultivation systems with an increased frequency of crop cultivation cycles (Jakovac et al., Reference Jakovac, Dutrieux, Siti, Peña-Claros and Bongers2017; Van Vliet et al., Reference Van Vliet, Adams, Vieira and Mertz2013). Shorter fallows result in lower soil fertility, shifts in plant (weed) community composition and slower biomass regeneration (e.g., Villa et al., Reference Villa, Martins, de Oliveira Neto, Rodrigues, Martorano, Monsanto, Cancio and Gastauer2018; Wood et al., Reference Wood, Rhemtulla and Coomes2017). These processes are expected to lead to a gradual decrease in crop yields over the cultivation cycles (e.g., Jakovac et al., Reference Jakovac, Peña-Claros, Mesquita, Bongers and Kuyper2016; Silva-Forsberg and Fearnside, Reference Silva-Forsberg and Fearnside1997). Therefore, there is a need for appropriate fallow management, particularly aimed at farmers with low resource endowments who cannot afford the use of external inputs in the form of fertilizers and herbicides.
Cassava (Manihot esculenta Crantz) is commonly grown in shifting cultivation systems in the Eastern Amazon region, occasionally in combination with maize (Zea mays L.), common bean (Phaseolus vulgaris L.) or rice (Oryza sativa L.), with fallow periods ranging from 1 to 20 years (Jakovac et al., Reference Jakovac, Peña-Claros, Mesquita, Bongers and Kuyper2016). Cassava plays an important role in providing local food security because its flour is the main source of carbohydrates for farm households in the Amazon (Díaz et al., Reference Diaz, Dini, Viña and García2018). Cassava productivity and its determining factors have been studied in many parts of the tropics (e.g., Fermont et al., Reference Fermont, Van Asten, Tittonell, van Wijk and Giller2009; Melifonwu, Reference Melifonwu1994; Visses et al., Reference Visses, Sentelhas and Pereira2018), but few studies are available for the Amazon region where declining yields jeopardise food security and livelihoods of smallholder farmers.
Cassava productivity is positively associated with planting density (Silva et al., Reference Silva, Lima e Silva, Braga, Da Silveira and Sousa2013) as the root storage capacity has been found to be strongly related to the crop leaf area (Cock, Reference Cock1976; Sagrilo et al., Reference Sagrilo, Soares, Filho, Pequeno, Celeste, Vidigal, Scapim, Kvitschal, Rui and Rimoldi2006). As a result, recommendations of best management practices for cassava production in the Amazon region revolve around the use of optimal planting densities in combination with seedling selection and weed management (Modesto and Alves, Reference Modesto and Alves2016). However, in practice, root yields are highly variable, and farmers have recently reported declining yields, which could partially be explained by the current trend of reduced lengths of fallow periods in the shifting cultivation systems (Jakovac et al., Reference Jakovac, Peña-Claros, Mesquita, Bongers and Kuyper2016; Parsons et al., Reference Parsons, Ramı´Rez-Aviles and Jerome2009), and by the associated depletion of soil fertility (Sommer et al., Reference Sommer, Vlek, Sá, Vielhauer, Coelho and Fölster2004; Wood et al., Reference Wood, Rhemtulla and Coomes2017) and increase of weed pressure (De Rouw et al., Reference De Rouw, Casagrande, Phaynaxay, Soulileuth and Saito2014; Uhl et al., Reference Uhl, Clark, Clark and Maquirino2009).
We currently lack understanding of the relative importance of these factors and the potential interactions with other factors governing the productivity of cassava in slash-and-burn shifting cultivation systems. Besides, quantitative information is needed to compare the productivity of traditional slash-and-burn with alternative fire-free land preparation that is promoted in Eastern Amazon in the context of the zero-fire initiatives (Carmenta et al., Reference Carmenta, Coudel and Steward2018).
The aim of this study was to assess the key factors that influence cassava root productivity in shifting cultivation systems in the Eastern Amazon region of Brazil. First, we analysed how cassava plant density at harvest was related to pedoclimatic and management factors. Second, we assessed the relationship between cassava plant density and root yield at harvest and conducted a yield gap analysis to better understand which factors govern cassava productivity beyond plant density in slash-and-burn systems. Finally, we compared cassava productivity between slash-and-burn and the fire-free land clearing techniques that some farmers started to adopt in the study region.
Materials and Methods
Site characteristics and field selection
Our study was conducted in the rural region of Paragominas in the Pará state, Brazil. This region experiences a monsoonal equatorial climate (Am, Köppen classification) with the rainy season occurring from December to June. The average annual temperature is 26.6 °C and the average annual rainfall is 1800 mm. Soils in our study are characterised as yellow dystrophic Latosols (Brazilian Soil Classification System) or xanthic Ferralsols (World Reference Base for Soil Resources). The pedoclimatic conditions in our study sites are representative of the Eastern Amazon region.
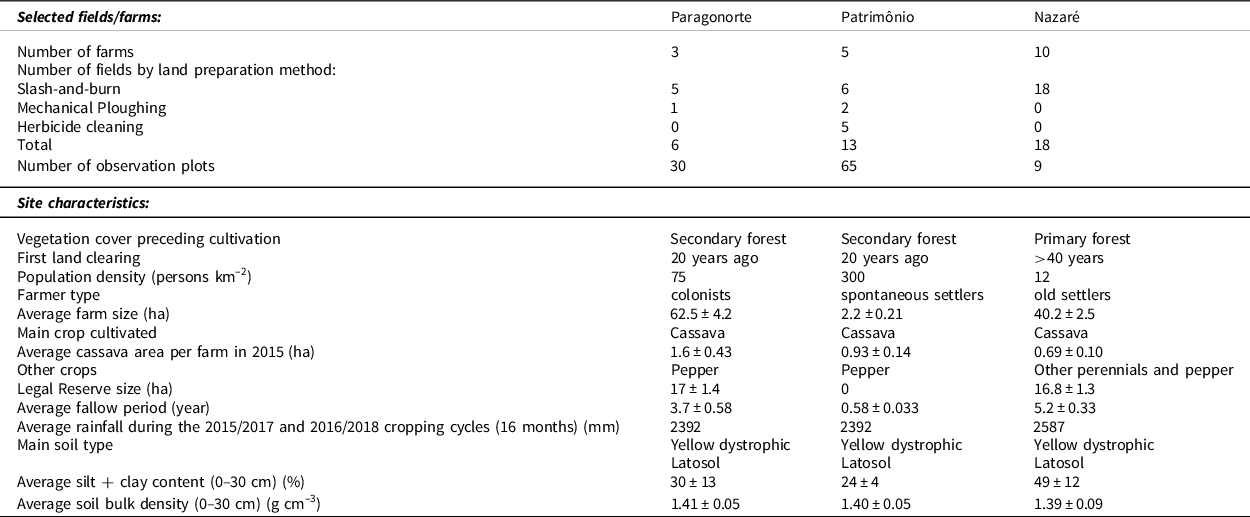
We selected three study sites: the community of Nazaré (2°40.92' S, 47°53.35' W) and the communities of Paragonorte and Patrimônio, which both are part of the Luiz Inácio Lula da Silva village (2°32.03' S, 46°57.25' W). The farms in Nazaré, Paragonorte and Patrimônio represent different farming contexts (Table 1). Nazaré is an old settlement prior to the creation of the municipality of Paragominas in 1964. The village of Luiz Inácio da Silva is a settlement created at the end of the 1990s as part of the Brazilian agrarian reform and hosts the communities of Paragonorte and Patrimônio in spatially separated areas. Paragonorte is populated by colonists, i.e., farmers who were officially appointed by the government, while the community of Patrimônio hosts spontaneous settlers with no official status (Fujisaka et al., Reference Fujisaka, Hurtado and Uribe1996). Farms in Patrimônio are smaller than in Paragonorte and Nazaré and do not have Legal Reserves (Table 1), i.e., areas that farmers should maintain under native vegetation cover according to the Forest Code, law no. 12.651/2012 (Bandeira, Reference Bandeira2015). The size of the Legal Reserves ranges from 20 to 80% of the total farm area, depending on the local policy context. The available labour force on the farms is mostly family labour in all three study sites.
Main characteristics of the study sites (means and standard deviations)

Means and standard deviations are reported.
The main staple crop in the study sites is cassava, which is typically grown in slash-and-burn systems. Cassava tubers are processed by farmers into flour that is used for subsistence food needs (Diaz et al., Reference Diaz, Dini, Viña and García2018). Cassava is planted at the onset of the rains starting in December and is harvested between 12 and 20 months later. We selected cassava fields in Nazaré, Paragonorte and Patrimônio depending upon the farmers’ consents to participate at a field monitoring study of several months, corresponding to the 2015–2017 and 2016–2018 cassava cropping cycles. Eighteen fields were selected in Nazaré (in 10 different farms), six fields in Paragonorte (in three farms) and 13 fields in Patrimônio (in five farms). Fields were managed by the farmers according to their usual practices. Cassava was planted in the selected fields in December 2015 in the first cropping cycle of the study and in December 2016/January 2017 in the second cycle. Field sizes ranged from 0.15 to 4.4 ha and 10 out of the 37 fields were intercropped with maize.
Data collection
Farmers were visited on a weekly basis during the two cassava cropping cycles to collect data on crop management activities. We classified the management activities as: land clearing and preparation (through slashing and burning, applying herbicides or ploughing), cassava planting, replanting of cassava (when required), maize planting (when applicable), weeding (one to four times per cropping cycle) and harvesting. For each activity, we recorded the start and end date, the family and external labour input and the amount of external inputs. The tools used by the farmers in the slash (and burn) activities consisted of chainsaws for the largest trees and shovels and machetes for the remaining vegetation. The mechanical fire-free land clearing with a tractor was always in the form of hired services. Land clearing with herbicides was usually done with glyphosate. No additional weeding was conducted between clearing the fallow and cassava planting, as all crops were planted at most two weeks after land preparation. Weeding was the only activity between planting and harvesting and was performed with hand hoes. The fields were completely cleared from weeds at each weeding event, and the weed biomass was then left to decompose on the field. All cropping activities were conducted by family labour, except for weeding, for which sometimes additional labour was hired, and mechanical land clearing, for which tractor services were hired. The same tools and techniques were used on all fields, except for the land clearing methods (see above).
In each selected field, five georeferenced observational plots (5x5 m2) were established in an ‘X’ pattern (i.e., one plot in the centre of each field and four plots in between the centre and each field corner) to account for within-field variability, mainly resulting from spatial heterogeneity in soil characteristics and residual biomass (mainly tree stumps and roots) from the fallow.
We monitored weed growth in all fields during the second cropping cycle (2016–2018). Prior to each weeding event and at harvest, we determined the weed cover of the plots using the Canopeo® Smartphone App (Patrignani and Ochsner, Reference Patrignani and Ochsner2015) with five replicate images per plot. We calculated the weed cover development rate (WCDR) (day–1) by dividing the measured weed cover by the number of days since the last weeding (or since planting). At each weeding event and at harvest, we also determined the total aboveground biomass of weeds in the observational plots, separated in monocotyledonous and dicotyledonous weeds. The aboveground parts of weeds were cut a ground level, fresh biomass was measured with a 15-g digital precision scale. A 300-g sub-sample was oven dried at 70 °C for 72 hours to determine the moisture content and calculate the dry weight (dw) of the weed sample. The weed (monocotyledonous and/or dicotyledonous) biomass growth rate (WBGR, g dw m–2 day–1) was calculated by dividing the dry weight weed biomass by the number of days since the last weeding event (or since planting). Specific WBGRs were calculated for monocotyledonous and dicotyledonous weeds separately. Finally, we integrated the respective WCDRs and WBGRs over the successive weeding events and calculated the average daily rates for the period between the cassava planting and harvest.
Cassava was harvested at a date decided by the farmer, i.e., after between 12 and 20 months of growing cycle. Cassava root yields were determined in each observational plot by weighing the total fresh root biomass of all plants present in the plot. The number of plants for each variety in the plot was also recorded. In some observational plots, cassava plants suffered from root rot diseases, leading to the death of all plants; yield was then recorded as null. In the fields with maize as an intercrop, we determined the maize grain yield when farmers decided to harvest maize by collecting the grains of all plants in the observational plots. A 300-g sub-sample of grains was oven dried at 70 °C for 72 hours to determine its moisture content and calculate dry matter content.
During the dry season (August/September) of 2016 and 2017, soil was sampled in the fields at a one-meter distance from each observational plot, resulting in five replicate samples per field. Steal rings with a volume of 100 cm³ were used to collect undisturbed soil samples at depths of 0–5, 5–10, 10–20 and 20–30 cm. After air-drying to constant weight, the soil bulk density was determined by weighing the samples, and for each sample, a 50-g sub-sample was oven dried at 110 oC for 24 hours to determine its moisture content. The air-dried samples were ground to pass through a 2-mm sieve and analyzed for texture (pipette method), pH (CaCl2), organic carbon (Schollenberger method), total nitrogen (Kjeldhal method) and exchangeable K+ (extraction with ammonium acetate, NH4OAc, pH 7.0 and flame photometry), according to the procedures used at Embrapa, the Brazilian Agricultural Research Corporation (Elisabeth and Claessen, Reference Elisabeth and Claessen1997). pH was only determined on the 0–5 cm soil samples.
Air temperature and rainfall were monitored with an automatic weather station at each site. Total daily rainfall was calculated from 15-minute interval recordings of an automatic rain gauge.
Data analysis
The association between the measured environmental, management and crop variables was assessed using principal component analysis (PCA; n = 37). Given the strong correlations between clay plus silt content, organic carbon, total nitrogen and available potassium of the 0–30 cm soil layer, we selected soil clay plus silt content as the explanatory variable for soil fertility in the further analysis below. In addition, we used labour requirements for fallow clearing in slash-and-burn systems as a proxy for the amount of fallow aboveground biomass and the associated quantity of nutrients supplied to the soil after slashing and burning. Furthermore, temperature and cumulative rainfall during the cropping cycle were strongly correlated, and therefore we only used rainfall as explanatory variable in the analysis, and not temperature. After this first variable selection, we evaluated the correlations among pairs of the remaining explanatory variables to control for multicollinearity in the linear mixed-effects regression models that are described in the next paragraph.
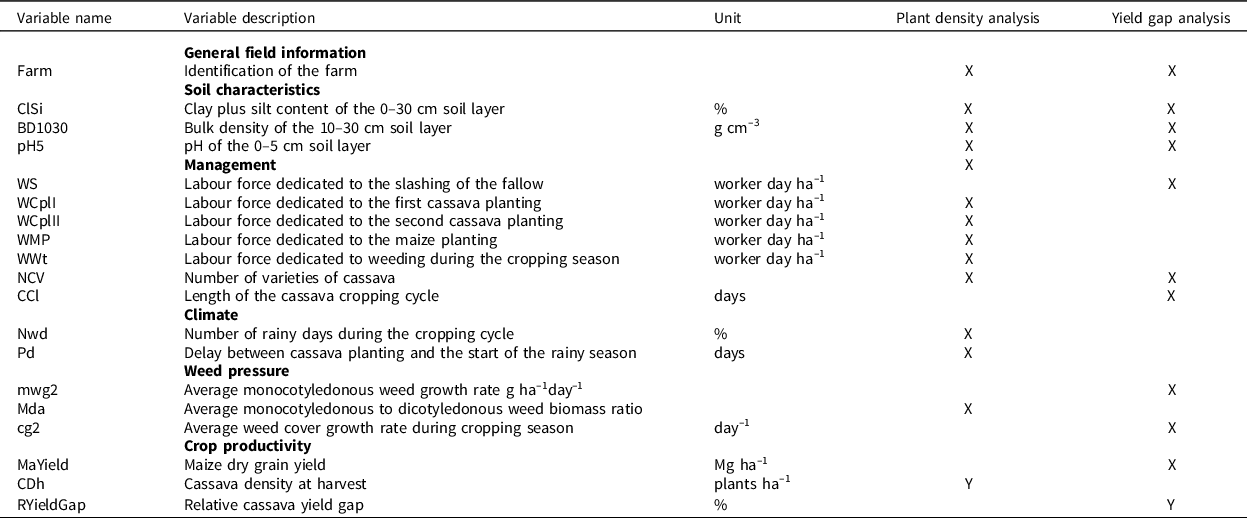
We conducted the analysis of the cassava root yield variability in the slash-and-burn fields (n = 29) in two steps. First, as part of the yield variability was expected to be related with plant density, we analysed the variation in cassava plant density at harvest (response variable) against a set of explanatory variables (i.e., soil characteristics, management practices and rainfall, Table 2) using a linear mixed-effects model. Second, we determined the plant density-specific yield gap and explained its variability through variations in soil characteristics, weed pressure, crop management and rainfall. To do so, we first fitted a boundary line, i.e., a non-linear model of maximum yield as function of cassava plant density at harvest, as follows:
 $$Maximum{\rm{\;}}Yield = a{\rm{*}}\left( {1 - ex{p^{ - b{\rm{^*}}\left( {plant{\rm{\;}}density} \right)}}} \right)$$
List of the variables used in the linear mixed-effects model analyses of plant density at harvest and yield gap

X and Y indicate response and explanatory variables, respectively.
The relative yield gap at plant density i (RYGi) for each observational plot was then defined as
 $$RYGi = \left( {Maximum\;Yield\;i - Observed\;Yield\;i} \right)/Maximum\;Yield\;i$$
Finally, the relationship between the relative yield gap (response variable) and a set of variables related to soil, management, rainfall and weed pressure (explanatory variables; Table 2) was explored using linear mixed models. Rainfall variables had no significant effect here and were omitted. Since some fields were located on the same farm, and farms were nested within sites, we used ‘Farm within Sites’ as a random factor. For each analysis, the individual observational plots were used as unit of observation to capture the intra-field variability (total of 114 observations). As weed growth dynamics were only assessed in the second cropping cycle (2016–2018), data on weed pressure variables were only available for 66 out of the 114 slash-and-burned observational plots. The following three models were used:
 $$\rm{MODEL 1: RYG} \sim {\it{f}} ({\rm{soil \ variables + management \ variables }}); ({\it{n}}=114)$$
 $${\rm{MODEL 2: RYG}} \sim f ({\rm{weed \ pressure \ variables}}); (n=66)$$
 $${\rm{MODEL 3: RYG}} \sim {\it{f}} ({\rm{significant \ explanatory \ variables \ from \ MODELS \ 1 \ and \ 2}}); ({\it{n}}=66)$$
In the above analysis of yield variability, we only considered fields that were prepared by slash and burn (29 out of the 37 fields, Table 1) and thus discarded eight fields that had been cleared by either ploughing or herbicide application. A Student’s t-test was used to compare the average fresh cassava root yields from fields prepared with traditional slash-and-burn to those from fields with mechanical ploughing or herbicide clearing.
All statistical analyses were conducted in R (R Core Team, 2020). We used the ade4 package for the PCA, the lme function of the lme4 package for the mixed models and the geom_signif function of the ggsignif package for the comparison of cassava root yields.
Results
Soil characteristics at the study sites
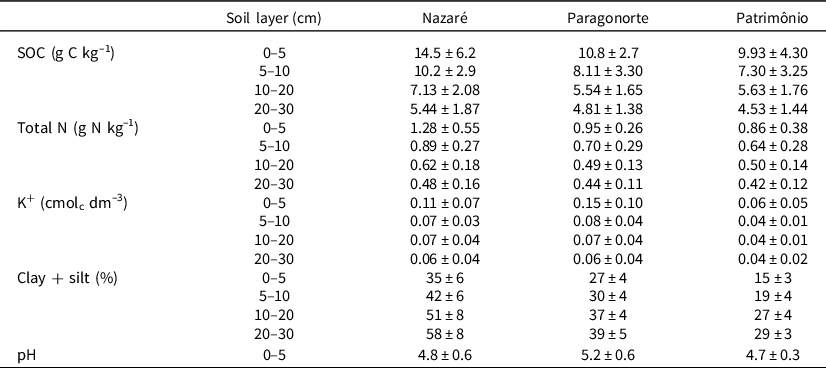
On average, soils at Nazaré were inherently more fertile than at Paragonorte and Patrimônio, as indicated by the higher soil organic carbon contents in the upper soil layers (Table 3). Soils at Nazaré had also higher clay plus silt contents than at the two other sites. The sandiest soils were found at Patrimônio. Exchangeable K+ was lowest at Patrimônio, but variable within sites. pH values (0–5 cm soil layer) were similar across the three sites ranging from 4.7 to 5.2.
Soil characteristics of the study sites (means and standard deviations)

Cassava root yield
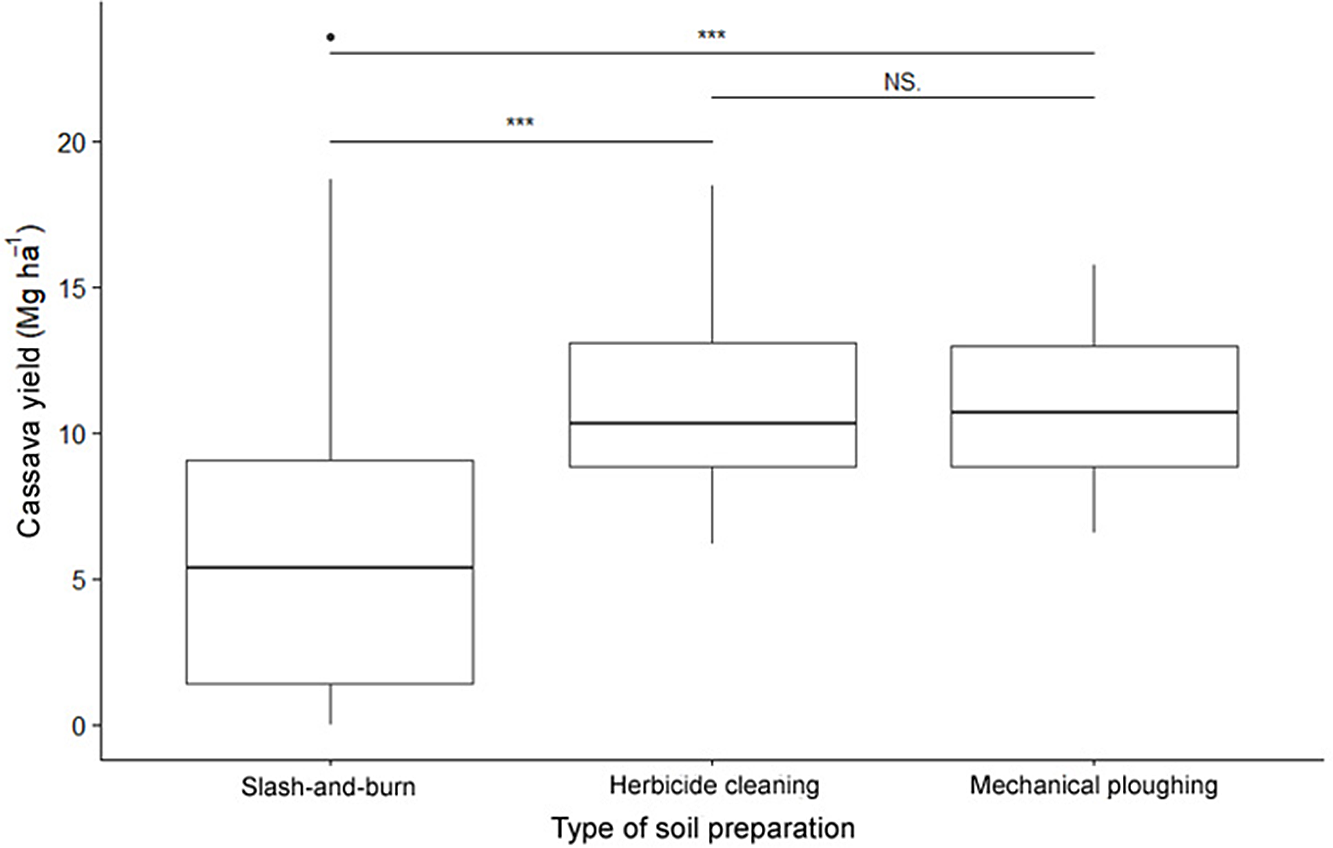
The mean cassava fresh root yield across all 37 fields was 7.2 ± 5.4 Mg ha–1 and yields ranged between 0 (i.e., complete crop failure due to root rot diseases) and 24 Mg ha–1 (Figure 1). Besides the variation in yield among fields, there was also substantial variation among plots within a field with a mean difference between minimum and maximum yield of 7.5 Mg ha–1, ranging from 1.0 to 18 Mg ha–1 (Figure 1). Cassava root yield was influenced by the method of field preparation, whereby yields were about 50% lower (and more variable) when fields were prepared by slash and burn than by mechanical ploughing or herbicide application (p < 0.001; Figure 2). The fields prepared by slash and burn had significantly higher yields in Paragonorte than in Patrimônio and Nazaré (Table 4, 11.0 ± 5.0 vs. 4.5 ± 5.4 and 5.2 ± 4.6 Mg ha-1, respectively; p < 0.05). Root yields below 5 Mg ha–1 occurred in the fields harvested before 450 days after planting, which corresponded to a harvest before February, and this mostly occurred in Nazaré (Figure 3a). There was no clear relationship between root yield and the total rainfall during the cropping cycle (Figure 3b). On the other hand, there was a trend of decreasing yield with higher silt plus clay content of the 0-30 cm soil layer, the latter also corresponding to site differences (Figure 3c). Fields that were intensively weeded (in Patrimônio see below), i.e., with a total weeding labour during the cropping cycle of more than 65 worker days ha–1, had yields exceeding 5 Mg ha–1 (Figure 3d), except for two plots that were infected with root rot. There was no clear relationship between labour dedicated to the slashing of the fallow prior to cultivation and cassava yield (Figure 3e), while the variation in yields increased and higher maximum yields were attained with increasing plant density at harvest (Figure 3f).
Average cassava fresh root yields in the slash-and-burn fields (circles) and corresponding yields in the individual observation plots (crosses). The labels of the X-as indicate the identifiers of the 29 fields of the study.

Boxplot of the cassava fresh root yield vs. the type of land preparation. Significance of the difference between means is represented by *** (p < 0.001) or NS (non-significant). n = 100 for slash-and-burn, n = 20 for herbicide cleaning, n = 15 for mechanical ploughing.

Number of varieties, plant density at harvest and fresh root yield of cassava in the slash-and-burn fields at the three study sites (means and standard deviations)

Relationships between cassava fresh root yield and the length of the cropping cycle (a), the cumulated rainfall during the cropping cycle (b), the silt plus clay content of soil (c), the weeding labour (d), the labour for clearing of the fallow (e), and the cassava density at harvest (f) during the cropping cycles of 2015–2017 and 2016–2018. The marker type indicates the site. The equation of the envelop curve of (f) is
 $y = \;a\left( {1 - {{\exp }^{ - b*density}}} \right)$
with a = 19 Mg ha–1 ± 17 (p < 0.001) and b = 3.1 * 10–4 ± 7.6 * 10–5 (p < 0.001).

Weed pressure and weeding labour
Weeding labour for the slash-and-burn fields was significantly higher in Patrimônio than in Paragonorte and Nazaré, averaging 108 ± 10 vs. 19 ± 3 and 29 ± 2 workers day ha–1 (p < 0.05; Table 5), respectively, suggesting that weed pressure was highest in Patrimônio. This corresponded with the numbers of weeding events that were about twice higher in Patrimônio than in Paragonorte and Nazaré. On the other hand, the observed seasonal WBGR was significantly higher in Nazaré and Patrimônio than in Paragonorte (20.7 ± 15.2 and 17.8 ± 8.3 versus 9.4 ± 5.8 g m–2 day–1 for the slash-and-burn fields, p < 0.05) (Table 5). The majority of the weeds were dicotyledonous, i.e., on average between 60 and 80% of the total weed growth at the three sites. Average WCDR during the cassava cropping cycle in the slash-and-burn fields was largest in Patrimônio (0.23 ± 0.08 day–1) compared to 0.16 ± 0.09 and 0.11 ± 0.08 day−1, respectively, in Nazaré and Paragonorte.
Weeding labour and weed pressure in the slash-and-burn fields at the three study sites (means and standard deviations)

sWCDR: seasonal weed cover development rate; sWBGR: seasonal weed biomass growth rate
Correlations between variables
The first two principal components of the PCA indicated that the length of the cassava cropping cycle (CCl) and cassava root yield (YIELD) were negatively correlated with soil clay plus silt content (ClSi) and the amount of labour dedicated to the slashing of the fallow prior to cultivation (WS) (Figure 4a). The third principal component was associated with the bulk density of the 0–30 cm soil layer (BD) (Figure 4b). Management variables that were correlated along the first two axis were differentiated by the fourth axis of the PCA (Figure 4b). The cumulative variance explained by the first four principal components was 21 (PC1), 41 (PC1 and 2), 55 (PC1–3) and 66% (PC1–4; Figure 4).
Plot of the principal component analysis (PCA) of variables at the plot and field level. Panel (a) shows the first and second principal component and panel (b) the third and fourth. The cumulative explained variance of the four axes is 54%. The full name of variables can be found in Table 2.

Cassava plant density at harvest
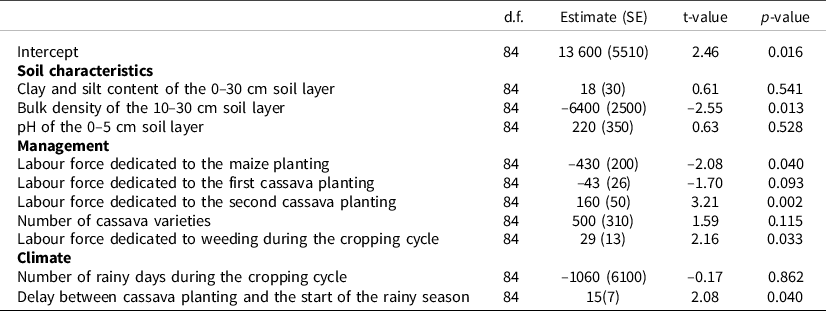
The cassava plant density at harvest ranged from zero (in case of plant death due to root rot) to 11 000 plants ha–1 (Figure 3f) and was on average significantly lower in Nazaré than in Paragonorte and Patrimônio (Table 4, 4200 ± 730 vs. 5320 ± 630 and 5340 ± 460 plants ha–1 for the slash-and-burn fields; p < 0.05). Fields contained on average 1.9 ± 0.15 planted cassava varieties in Nazaré, 1.3 ± 0.09 in Paragonorte and 1.5 ± 0.11 in Patrimônio (Table 4). The plant density was positively associated to the labour dedicated to weeding and to cassava replanting (p < 0.05; Table 6), whilst a negative association was observed to the bulk density of the 10–30 cm soil layer (p < 0.05) and the labour dedicated to intercropped maize planting (p < 0.05; Table 6). Concerning the climatic (rainfall) variables, we found that the delay between cassava planting and the start of the rainy season was positively associated to the plant density of cassava at harvest (p < 0.05), whilst the number of rainy days during the growing cycle was not significantly associated (p > 0.05). Lastly, there was no significant (p > 0.05) association between soil clay plus silt content, soil pH or the number of varieties planted and cassava plant density at harvest (Table 6).
Estimates and standard errors (in brackets) for variables explaining cassava plant density at harvest (plants ha–1) using a linear mixed-effects model

Relative cassava yield gap
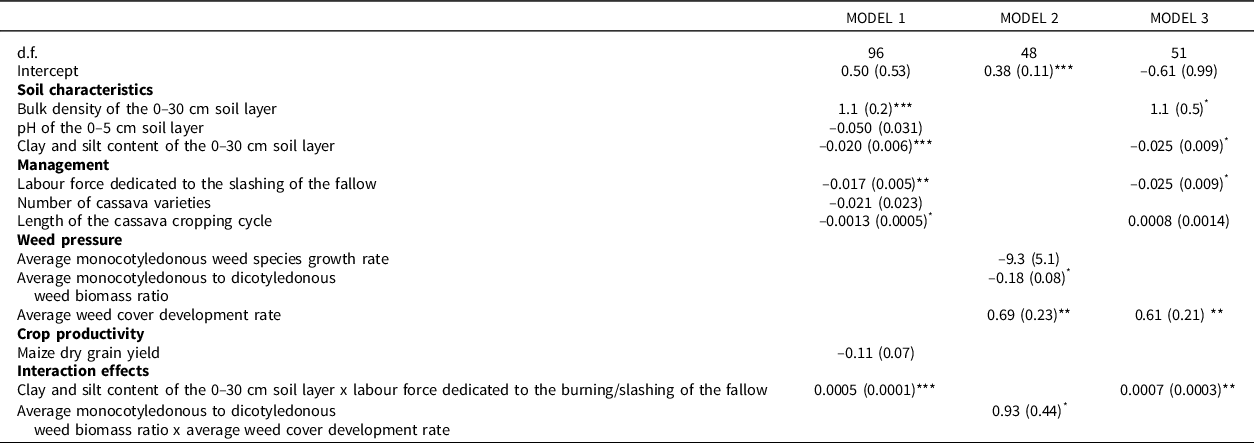
The plant density-specific relative yield gap ranged from 0 to 95% (Figure 3f). Model 1 (including all observational plots, n = 114) showed significant positive effects of the soil clay plus silt content (0–30 cm), the length of the cropping cycle and the labour dedicated to the slashing of the fallow prior to cultivation on reducing the relative cassava yield gap (Table 7). The effect of the amount of labour used for clearing the fallow depended on the soil texture of the site, as indicated by the significant interaction term (Table 7). On the other hand, a significant negative effect of soil bulk density (0–30 cm) on closing the relative yield gap was observed. Model 2 (including the observational plots with weed monitoring, n = 66) indicated a significant positive association between the average seasonal WCDR and the relative yield gap, indicating that weed cover negatively affected yield for a given plant density. Model 2 also indicated a significant negative association between the average (seasonal) ratio of monocotyledonous to dicotyledonous weed biomass and the relative yield gap. Moreover, this effect depended on the value of the average seasonal WCDR, as indicated by the significant interaction term between the two variables. There was no significant association between soil pH, the number of cassava varieties planted or intercropped maize grain yield and the relative yield gap. Model 3 (including the observational plots with weed monitoring, n = 66) confirmed the significance of the effects of soil fertility and weed pressure on the relative yield gap shown by the models 1 and 2.
Estimates and standard errors (in brackets) for variables explaining plant-density specific relative cassava root yield gap (RYG) using linear mixed-effects models

MODEL 1: RYG ∼ soil fertility + management (n = 114), MODEL 2: RYG ∼ weed pressure (n = 66), MODEL 3: RYG ∼ significant explanatory variables from MODELS 1 and 2 (n = 66).
*Indicating p < 0.05, **indicating p < 0.01 and ***indicating p < 0.001.
Discussion
We found high variability in cassava root yields between and within farmers’ fields in the Amazon region of Paragominas, which could to a large extent be explained by the variability of plant density at harvest (Figure 3f). As plant density appeared as a key determinant of attainable root yields, proper management of plant density during the cropping cycle is key to increase the yield potential of cassava. At different plant density levels, differences in cassava root yields were largely explained by differences in labour inputs for weeding and fallow clearing, the effect of the latter depending on soil type (i.e., soil texture). Thus, our results suggest that labour is a key production factor for cassava in the shifting cultivation systems of the Eastern Amazon in which the use of external inputs, such as chemical fertilizers and herbicides, is very limited.
Variability of cassava plant density at harvest
The positive association between cassava plant density at harvest and root yield (Figure 3f) highlights the importance of managing plant density to secure cassava productivity. While we were not able to find other studies reporting measurements of cassava plant density at harvest, the highest values in our study (around 10 000 plants ha–1) were in the same order of magnitude as densities at planting of cassava reported by e.g., Fermont et al. (Reference Fermont, Van Asten, Tittonell, van Wijk and Giller2009) and Jakovac et al. (Reference Jakovac, Peña-Claros, Mesquita, Bongers and Kuyper2016). The negative association between the bulk density of the 10–30 cm soil layer and the cassava plant density at harvest can be related to development of root rot, mainly caused by Phytophthora spp. and Pythium spp. (Poltronieri et al., Reference Poltronieri, Trindade, Silva and Albuquerque1997). A high bulk density in subsoil layers can cause water stagnation in the upper soil layer, creating favourable conditions for fungal diseases on harvestable roots and can ultimately lead to the death of cassava plants (Boas et al., Reference Boas, Oliveira, Bragança, Ramos and Oliveira2016; Byju et al., Reference Byju, Ravindran, Nair and Ravi2010). In the Amazon region, it is estimated that cassava yield losses due to root rot can reach to more than 50% in the floodplains and over 30% in the uplands. In some cases, there is a complete yield loss, especially in fields that are located on poorly drained soils that are frequently flooded (Modesto and Alves, Reference Modesto and Alves2016). Selecting non-sensitive areas to root rot diseases for the cultivation of cassava, or using resistant varieties when available, replanting cassava when stand reduction occurs and controlling the weed pressure can help farmers achieving the plant density of 10 000 plants ha–1 that is recommended in the Pará state (Modesto and Alves, Reference Modesto and Alves2016) and can increase the yield potential (cf. Figure 3f). Smallholder farmers in the Amazon region occasionally intercrop cassava with maize in order to maximize food production and income per area (Schons et al., Reference Schons, Streck, Storck, Adeliburiol, Zanon, Pinheiro and Kraulich2009). The negative association between the labour input for maize planting and the cassava plant density at harvest may point to strong competition for resources between maize and young cassava plants (Olutayo et al., Reference Olutayo, Olubunmi, Olanipekun, Olasoji and Aduramigba-Modupe2014), or to the occasional destruction of cassava sprouts during maize planting. In addition, the amount of labour for replanting cassava was positively associated with the plant density at harvest, highlighting the importance of a second planting in case that the first planting resulted in a suboptimal crop stand. Furthermore, the observed positive association between weeding labour and cassava plant density at harvest underlines the importance of timely weeding to avoid weed competition with young cassava plants (Staver, Reference Staver1991) and even to prevent mortality of cassava plants (Aspiazú et al., Reference Aspiazú, Sediyama, Rebeiro, Silva, Concenco, Ferreira, Galin, Silva, Borges and Araujo2010; Fermont et al., Reference Fermont, Van Asten, Tittonell, van Wijk and Giller2009). This was exemplified in one of the cassava fields in which we observed the development of a dense cover of Acacia mangium Willd that smothered the cassava plants. Finally, sufficient rain during the initial period after planting is important for a good cassava stand as water deficits can substantially affect sprout survival, depending upon the quality of the stem cuttings (Oka et al., Reference Oka, Limsila and Sarakarn1987). It was, however, difficult in our study to describe and quantify possible differences in the quality of the cassava planting material used by farmers. In our study region, farmers do not buy improved planting materials but produce their own materials, using cuttings taken from the stems of mother plants. Hereby, they all use very similar practices, i.e. with respect to the age of the mother plants, the storage of stems, the parts of the stem used and the length of the stem cuttings.
Managing cassava plant density is a key recommendation formulated by agricultural advisors in the Brazilian Amazon region (Modesto and Alves, Reference Modesto and Alves2016) because a densely planted field allows to achieve a rapidly closed leaf canopy during the cropping cycle, limiting soil moisture losses during the dry season, reducing weed pressure and controlling the direct impact of rain on soil particles in causing soil erosion. Our data indicated, however, a high variability of yields for a given plant density at harvest (Figure 3f). Therefore, we performed a yield gap analysis using plant density as a first determining factor which allowed identifying what other factors determine root yields beyond plant density.
Cassava root yield gap
The cassava root yields observed in our study varied largely, ranging from 0 (in case of root rot diseases) to 24 Mg ha–1, comparable with the wide yield ranges reported in slash-and-burn systems in other regions of the Amazon (Jakovac et al., Reference Jakovac, Peña-Claros, Mesquita, Bongers and Kuyper2016; Vosti et al., Reference Vosti, Witcover and Carpentier2002). Considerable yield gaps, i.e., the difference between the water-limited yield potential and actual yields, were hence observed (Figure 3f).
Yield gap analysis is commonly used to understand variability of crop yields in smallholder farming systems (e.g., Affholder et al., Reference Affholder, Poeydebat, Corbeels, Scopel and Tittonell2013; Fermont et al., Reference Fermont, Van Asten, Tittonell, van Wijk and Giller2009; Van Ittersum et al., Reference Van Ittersum, Cassman, Grassini, Wolf, Tittonell and Hochman2013), and they may be indicative of both agronomic as well as broader socioeconomic factors affecting family agriculture (Tittonell and Giller, Reference Tittonell and Giller2013). In yield gap analyses, crop growth simulation models are commonly used to assess the water-limited yield potential, which is defined as the maximum attainable yield per unit land area that can be achieved by a particular crop cultivar in an environment to which it is adapted when nutrients are not limiting, and pests and diseases are effectively controlled. However, the calibration of those models to local contexts often demands a significant amount of data (Affholder et al., Reference Affholder, Tittonell, Corbeels, Roux, Motisi, Tixier and Wery2012), making the use of this method challenging. Our method of using plant density-based estimations of yield potential is based on upper yield boundaries and hence a practical alternative to calculate attainable yields when crop growth modelling is not practicable (e.g., Delmotte et al., Reference Delmotte, Tittonell, Mouret, Hammond and Lopez-Ridaura2011; Tittonell et al., Reference Tittonell, Vanlauwe, Corbeels and Giller2008).
We did not find any significant association between the cassava yield gap and the number of varieties cultivated in the field, which is probably due to the low number of different varieties used by farmers in the three study sites. Lowest yields, i.e. less than 5 Mg ha–1, were observed when the length of the cropping cycle was shorter than 450 days (Figure 3a), which corresponded to a crop harvest in the middle of the second rainy season following planting. More generally, the relative yield gap was negatively associated with the length of the cropping cycle, indicating that a longer cropping cycle gets the actual yield closer to the maximum observed yield. Cassava plants develop their canopy and root system primarily during the first rainy season, while the harvestable roots (tubers) develop mostly in the second rainy season (Carvalho et al., Reference Carvalho, Chagas and Botrel1993; Sagrilo et al., Reference Sagrilo, Soares, Filho, Pequeno, Celeste, Vidigal, Scapim, Kvitschal, Rui and Rimoldi2006). Therefore, completing the full second rainy season is important for achieving high root yields. However, farmers often harvest some portion of their crops earlier because of food or cash needs, resulting in yields lower than those attainable.
Our data (from the site at Patrimônio) indicated a threshold for weeding labour of 60 worker days ha–1 above which yields below 5 Mg ha–1 were uncommon (Figure 3d) and corresponded to crop failures due to root rot diseases. This result suggests that good weed management is crucial in achieving high cassava yields (Albuquerque et al., Reference Albuquerque, Sediyama, Silva, Carneiro, Cecon and Alves2008) and was corroborated by the positive association between the WCDR and the size of the relative yield gap, which became more important in case of herbaceous weed dominancy (Table 7). A strong negative effect of herbaceous weed pressure on cassava yield was also reported in the Central Amazon region (Jakovac et al., Reference Jakovac, Peña-Claros, Mesquita, Bongers and Kuyper2016). These are important findings as the current trend of reduced lengths of fallow periods in shifting cultivation systems has been associated with an increase of herbaceous weed populations (e.g., Parsons et al., Reference Parsons, Ramı´Rez-Aviles and Jerome2009). Our results are therefore in line with Ekeleme et al. (Reference Ekeleme, Hauser, Aster, Dixon, Weller, Olorunmaiye, Usman, Adeyemi and Chikoye2016) and Fermont et al. (Reference Fermont, Van Asten, Tittonell, van Wijk and Giller2009), who highlighted the importance of weed control in closing cassava yield gaps on smallholder farms.
The lower root yields in Patrimônio and Nazaré than in Paragonorte could be related to weed competition with the cassava plants, as the seasonal WBGR was substantially higher in Patrimônio and Nazaré than in Paragonorte. In Patrimônio, the relatively high human population density poses a high pressure on the land in the community resulting in short fallow cycles (Table 1), increased weed pressure and ultimately declining crop productivity, as also was observed in a study in Central Amazon (Jakovac et al., Reference Jakovac, Peña-Claros, Mesquita, Bongers and Kuyper2016). In Nazaré, higher weed pressure may to a certain extent be attributed to more fertile soils at this site, but also to the fact that the farmers in this community tended not to prioritize weeding their cassava fields as they rely for their income also on other perennial crops, such as açaí palm (Euterpe oleasea Mart.), cashew tree (Anacardium occidentale L.) or cupuaçu (Theobroma grandiflorum (Willd.ex. Spreng.) Schum.). Thus, the strong weed competition explained to a certain extent the relatively low cassava yields in Nazaré, despite the longer average fallow period and better overall soil conditions than in Paragonorte and Patrimônio (Table 1).
The significant positive effect of labour input for fallow clearing on reducing the yield gap (Table 7) indicates that cultivating cassava on relatively old fallows with substantial aboveground biomass requires relatively high labour input for slashing, but can also support high yields. This finding is supported by Jakovac et al. (Reference Jakovac, Peña-Claros, Mesquita, Bongers and Kuyper2016) who also reported higher cassava yields associated with longer fallow periods and decreased frequency of cultivation of the fields.
Based on the above findings, we suggest that besides managing plant density, optimal (late) harvest dates and proper weed and fallow management can help farmers to maximise their cassava yields. In regions such as our study area, where farmers have limited to no access to external inputs, optimal management practices in slash-and-burn systems depend, however, strongly on the availability of labour which is often constrained by the size of the family. In this context, there is an urgent need for alternative cropping systems to slash-and-burn agriculture.
The need for alternatives to slash and burn
Cassava yields in the slash-and-burned fields averaged 6.1 ± 5.5 Mg ha–1 (Figure 2), which is low in comparison to the average reported yield for the Para state (14.2 t ha–1, IBGE, 2019). This suggests that the current slash-and-burn practices and cassava management at the study sites were not optimal for productivity. Slash-and-burn is still a common practice in the study region, despite that all fire use has been forbidden by Paragominas municipality law. Some farmers have started to use herbicides or ploughing for clearing fallows, which, if affordable, can be relatively easily implemented at the farms. Despite the significantly higher yields (Figure 2), these local alternatives to burning the vegetation are, however, still poorly represented in Paragominas. For example, in our study, only 13% of the selected fields were prepared with herbicide clearing and 8% with mechanical ploughing, against 79% with slash-and-burn (Table 1). Besides, we did not observe among the farmers who participated in our study the practice of (fire-free) slash-and-mulch (Denich et al., Reference Denich, Vielhauer, Kato, Block, Kato, de Abreu Sá, Lücke and Vlek2004; Kato et al., Reference Kato, Kato, Denich and Vlek1999), the use of improved fallows with e.g., leguminous trees (Lojka et al., Reference Lojka, Lojkova, Banout, Polesny and Preininger2008), or the practice of agroforestry with e.g., rattan palms (Calamus spp.), cacao or fruit trees with an economic value (Tremblay et al., Reference Tremblay, Lucotte, Revéret, Davidson, Mertens, Passos and Romaña2015). These systems require, however, a considerable initial capital, which is frequently not available to the smallholder farmers in the Eastern Amazon region. Moreover, it may take several years for farmers to begin making a profit from these systems above that achievable with the traditional slash-and-burn shifting cultivation systems (Lojka et al., Reference Lojka, Lojkova, Banout, Polesny and Preininger2008; Mburu et al., Reference Mburu, Börner, Hedden-Dunkhorst, Mendoza-Escalante and Frohberg2007). In this context, and to reduce the contribution of smallholder farmers to deforestation, there is an urgent need for supporting more sustainable production systems through local and national public policies (Tremblay et al., Reference Tremblay, Lucotte, Revéret, Davidson, Mertens, Passos and Romaña2015). Finally, from our study, it is also clear that new practices should not only focus on soil fertility management but also on weed control and, more generally, on labour productivity.
Conclusions
Plant density, soil fertility and weed pressure are key factors governing cassava productivity in slash-and-burn systems of the Eastern Amazon. In particular, cassava plant density determined the maximum attainable yields that could be expected across soil types and labour availability levels. Plant density depended to a large extent upon the farmers’ management decisions, disease incidence and labour availability. Soil fertility decline and weed pressure, on the other hand, are multi-causal and hence more difficult to manage by farmers without access to external mechanical equipment and inputs. In the absence of these, farmers cope with declining cassava productivity by shifting their fields more frequently, thereby reducing the length of the fallow period.
In the current context of low external inputs, labour availability is a key factor for closing the yield gap in cassava slash-and-burn systems. Shifting cultivation systems are facing an important risk of further soil fertility depletion and increased weed pressure because of the current trend of reduction of the length of fallow periods. Cassava productivity declines rapidly when soils become depleted and/or weed pressured increases. To break this vicious cycle, there is an urgent need for a transition from slash-and-burn agriculture to more sustainable and resilient practices, such as agroforestry or slash-and-mulch systems, which allow attaining higher cassava productivity while reducing the extent of soil depletion and weed pressure.
Acknowledgements
We thank Embrapa Amazônia Oriental and the Núcleo de Apoio a Pesquisa e Transferência de Tecnologias, Paragominas for providing technical assistance and working facilities. We also thank Reynaldo Cristo Pinheiro and Ravena Ferreira de Figueiredo for helping with the soil sampling, as well as Professor Luis da Silva Freitas of the Universidade Federal Rural da Amazônia for providing practical support.
Financial support
This study was supported by the research project ‘STRADIV – System Approach from the TRAnsition to bio-DIVersified agroecosystems’, funded by the Agropolis Fondation under the reference 1504-003; the research project ‘Refloramaz – Forest restoration by family farmers in the Eastern Amazon’, funded by the Agropolis Fondation under the reference ID 1503-011; the ‘Investissements d’avenir’ programme (Labex Agro:ANR-10-LABX-0001-01); and the ECOTERA project, ANR-13-AGRO-0003, funded by the French Agence Nationale de la Recherche.
Conflicts of Interest
The authors declare that they have no conflict of interest.