1 Introduction
Health care is one pillar of the welfare state and one to which governments are devoting an increasing amount of the public resources. Organisation for Economic Co-operation and Development (OECD) countries devote almost 9% of their gross domestic product (GDP) to health care expenditure, of which two-thirds correspond to the public sector (OECD, 2008). About half of the total health expenditure is allocated to hospital care. Demands for more quality, shorter waiting lists and greater patient involvement increase the financial pressure on governments. In this context, payment mechanisms are fundamental in the pursuit of economic and quality objectives in health care, as they provide strong financial incentives for actors in the system to achieve policy goals (Peacock and Segal, Reference Peacock and Segal2000; van Barneveld et al., Reference van Barneveld, Lamers, van Vliet and van de Ven2001).
The payment method is an important tool in the management of health care systems to encourage providers’ efficiency (Langenbrunner and Wiley, Reference Langenbrunner and Wiley2002). During recent decades, most of the OECD countries have reformed the financing of their public hospitals in order to introduce prospective payment systems (PPS) in the belief that they promote improvements in operational efficiency (Linna, Reference Linna2000; Dismuke and Sena, Reference Dismuke and Sena2001). The implementation of PPS has been carried out using different strategies. Three general payment approaches can be defined (Leonard et al., Reference Leonard, Rauner, Schaffhauser-Linzatti and Yap2003): fee-for-service payment, payment for performance (e.g. per diem payment and case-based payment) and fix payment per accounting period (global budgeting and capitation formulae). However, none of these strategies represent an optimal solution. On the one hand, fee-for-service payments and payment for performance make it difficult to control costs (Aas, Reference Aas1995; Jegers et al., Reference Jegers, Kesteloot, De Graeve and Gilles2002), mainly because they encourage hospitals to increase their activity and thus their revenues (Allen, Reference Allen2009). On the other hand, fixed payments assure cost control but may act as a disincentive to hospital productivity or quality (Peacock and Segal, Reference Peacock and Segal2000; Kutzin, Reference Kutzin2001). Under these circumstances, policy-makers look for alternative methods to improve the goodness of the payment by introducing mixed reimbursement systems (Kesteloot and Voet, Reference Kesteloot and Voet1998).
This paper reports the experience of the Andalusian Health Service [Servicio Andaluz de Salud (SAS)], which introduced a form of hospital payment that uses a global budget that is allocated among hospitals using a capitation-based formula. This implies the use of fixed budgets with incentives for productivity. In a context in which policy-makers are looking for methods of reimbursing hospitals that encourage cost control and quality improvements, the health policy community may be interested in the approach adopted by the SAS. The SAS is the institution in charge of the administration and delivery of public health care in Andalusia (Spain). This paper provides an explanation of the most relevant characteristics of the system, highlighting some differences with the mechanisms adopted in other parts of Europe. It also offers preliminary information about the performance of hospitals after the reform by carrying out an analysis of the evolution of their efficiency and of a potential trade-off between efficiency and quality. The analysis focuses on the period 2003–2006.
The rest of the paper has the following structure. Section 2 presents some experiences of how hospitals linked to public health care are reimbursed in Europe. Section 3 presents a description of the SAS and its hospital reimbursement mechanism. Sections 4 and 5 contain the methodology and the analysis of the results. Section 6 discusses the results and the main conclusions are drawn in Section 7.
2 The financing of hospital care in Europe
Traditionally, most European countries paid for hospital care through payment systems such as global fixed budgets, fixed rates per admission or per diem rates (Cylus and Irwin, Reference Cylus and Irwin2010). Each of these systems leads to different result in the provision of hospital care. Establishing a fix payment per admission may incentivise hospitals to increase the number of admissions, while per diem payments may encourage lengthier hospital stays (Jegers et al., Reference Jegers, Kesteloot, De Graeve and Gilles2002; Smith et al., Reference Smith, Preker, Ligth and Richard2005). In addition, global budgets tend to induce providers to under-provide services because they may aim not to waste their fixed funds by promoting cost control (Kutzin, Reference Kutzin2001). These flat-rate or fixed budget payment systems have contributed to performance issues and declining health outcomes in some countries (Cylus and Irwin, Reference Cylus and Irwin2010). Hospital managers may adopt strategies to ‘cheat’ the reimbursement mechanism in order to achieve more funds, although some tactics are easier than others. For this reason a key element when implementing a reimbursement mechanism is to establish a control system that limits managerial manipulation. Case-based payments try to determine a price for the different hospital services/cases according to their intensity. The most frequently adopted case payment mechanism is the one based on the diagnosis-related group (DRG) classification, introduced in 1983 as the basis for reimbursing providers under the US Medicare system. In general, DRG-type hospital payment systems consist of two fundamental building blocks (Scheller-Kreinsen, Reference Scheller-Kreinsen, Geissler and Busse2009): (1) a patient classification system and (2) a payment rate-setting mechanism that defines cost weights or prices per DRG.
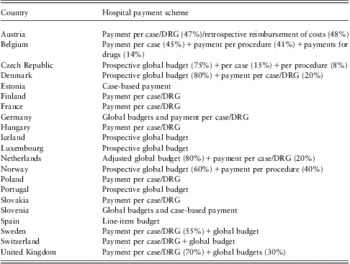
Nowadays, many European countries have incorporated a DRG case-based payment system to reimburse hospitals, although most of them combine it with other mechanisms such as global budgets and payment per procedures (see Table 1). Thus, the reimbursement systems used to finance hospital care in Europe vary across countries. The organisation and structure of the European health systems (Social Security or National Health System) partially explain these differences but cultural and political factors also influence the particularities of the policies adopted by each country. All these factors should be taken into account when comparing the strategies adopted at international level since each policy takes place within a specific context.
Main hospital payment schemes in Europe

DRG = diagnosis-related group.
Source: OECD (2010); Thomson et al. (Reference Thomson, Foubister and Mossialos2009).
Germany is a reference of the countries using the social security model. The hospital sector is made up of publicly owned hospitals and of not-for-profit and private hospitals. The infrastructures of these institutions are funded by state budgets while the operating costs are paid mostly by the insurance contracted by employees. The Statutory Health Insurance Act of 2000 resulted in the gradual introduction of a per-case DRG payment system instead of the previous historically based hospital budgets (using per diem charges as the unit for reimbursement). The main goal of the reform was cost containment, assuming that a more activity-oriented payment system would promote efficiency, quality and transparency in the hospital sector (Wilke et al., Reference Wilke, Höcherl, Scherer and Janke2001). After the implementation of the reform, it was found that the DRG-based payment mechanism was contributing to the accomplishment of these objectives (Quentin et al., Reference Quentin, Geissler, Scheller-Kreinsen and Busse2010).
The French health care system is another example of the social security system although, during the last two decades, it has gradually been supplemented with taxes (Bellanger and Mossé, Reference Bellanger and Mossé2005). The French health care system is a mix of public and private providers. Providers of outpatient care are mainly private and they are financed on a fee-for-service basis. One-third of the hospitals are public and account for two-thirds of the beds. Each public hospital is legally autonomous and manages its own budget. The payment of the operating costs of acute hospitals, that is, excluding mental and tertiary hospitals, is calculated using a DRG-based system. Capital investments are partially funded through specific programmes (Chevreul et al., Reference Chevreul, Durand-Zaleski, Bahrami, Hernández-Quevedo and Mladovsky2010). Three-quarters of the resources come from statutory health insurance funds and the remainder from individuals in the form of direct payments to the hospitals or indirectly via contributions paid for complementary health insurance coverage (Bellanger and Mosséf, Reference Bellanger and Mossé2005). Until 2004, the funding of hospitals depended exclusively on global budgets, which were mainly calculated on a historical basis including some adjustments based on regional case-mix (Bellanger and Tardif, Reference Bellanger and Tardif2006). The percentage of the payment prospectively determined has continually increased from 10% in 2004 to 100% currently (Chevreul et al., Reference Chevreul, Durand-Zaleski, Bahrami, Hernández-Quevedo and Mladovsky2010).
The British National Health Service (NHS) is the main reference for general taxation funded systems. Specialised care is provided in government-owned hospitals organised as ‘trusts’. The number of public hospitals has fallen dramatically during last decades while, at the same time, the health expenditure has increased (Boyle, Reference Boyle2011; OECD, 2011). Nowadays, the United Kingdom has the lowest rate of bed per inhabitant in Europe (Boyle, Reference Boyle2011). One of the basic features of the NHS is the division between purchasing (commissioning) and care delivery functions. The NHS consists of organisations that deliver services (service providers) and organisations that contract services, mainly Primary Care Trusts (PCTs). PCTs are responsible for contracting hospital services from a range of providers, mainly in the public sector but including private and voluntary providers. In 2003, the Department of Health (DoH) introduced its ‘payment by results’ system as the main way of financing hospitals, supplemented with global budgets. The introduction of this system was motivated by policy objectives to increase the efficiency, activity and quality of care in hospitals (DoH, 2002). Before payment by results, PCTs paid hospitals a fixed amount through locally negotiated block contracts (Epstein and Mason, Reference Epstein and Mason2006). With the establishment of a per-case reimbursement system, hospitals can retain surpluses. Some studies evidence a reduction in the costs of care after the implementation of the payment by results system due to reductions in the length of stays and an increment in the proportion of day cases treated (Farrar et al., Reference Farrar, Yi, Sutton, Clakley, Sussex and Scott2009).
In Finland, health care services are also mainly provided by the public sector and financed through general taxation. The principal particularity of the Finnish system is its high level of decentralisation. Municipalities have the responsibility for the organisation and financing most of the health care services (Vuorenkoski, Reference Vuorenkoski2008). The municipalities are grouped into hospital districts for the provision of specialised care, although each municipality can purchase services from private providers. The main source of funding for health care services is taxation, but hospitals also receive funds from state subsidies and user fees. In addition, there is a secondary public finance scheme, the National Health Insurance (NHI), based on compulsory insurance fees. The NHI partially reimburses public services as well as services that are provided by the private sector (Häkkinen, Reference Häkkinen2010). In the absence of national regulations or guidelines, each hospital district determines the payment method used to reimburse its hospitals. The hospital reimbursement mechanism has been consistently moving away from per diem towards per case methods. Nowadays, 13 of the 21 districts use DRG-based pricing, although the principles and rules applied vary greatly (Häkkinen, Reference Häkkinen2010). The productivity improvements of Finnish hospitals may be more related to the process of decentralisation of competencies to municipalities than to the effect of the introduction of a performance-based reimbursement. Most of the efficiency gains have been achieved by reducing the average length of stays after cutting the bed capacity of most hospitals even when they are still reimbursed on a bed-day basis (Linna, Reference Linna2000).
The Andalusian health care system constitutes a further example of a national health care system because the provision of specialised health care is mainly provided through public hospitals funded by general taxation and the SAS assumes the deficits of public hospitals. The reimbursement system adopted by the SAS, like most of the European systems, excludes from the funding formula the capital investments of public hospitals that are allocated through independent programmes. The SAS considers the complexity of the activity, using a DRG classification, when it calculates the budget assigned to each hospital according to the level of activity carried out. The main particularity of the reimbursement system implemented in Andalusia is that activity is not directly linked to the payment because there is not a tariff per case but per inhabitant. The activity carried out is used to determine the population assigned to each hospital for funding purposes. This means that the same medical act may result in a different payment depending on where the patient comes from. How the system works exactly is explained in Section 3.
3 The SAS and its hospital payment system
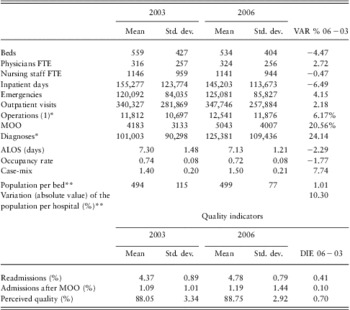
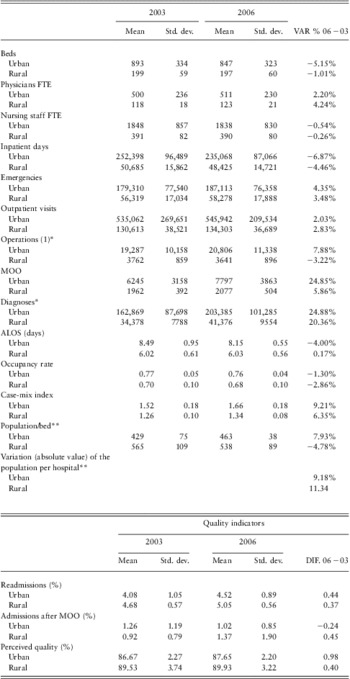
Andalusia, a region in the south of Spain has a population of more than 8 million, higher than 11 of the 27 countries in the European Union (EU). The Andalusian Health Service, Servicio Andaluz de Salud (SAS), is the public entity in charge of managing the Spanish National Health System in this region and, in terms of population attended, is one of the biggest public health services in Europe. The SAS has 29 acute hospitals. It has similar functions and competences to other European Health Services, such as the National Health Services of the United Kingdom, Italy and the Scandinavian countries, in which the provision of specialised health care is mainly provided through public hospitals funded by general taxation. Andalusia implemented a hospital choice initiative in 1997. Table 2 provides descriptive figures of the SAS hospitals for 2003 and 2006, and the variation during the three-year period. The Annex presents the information distinguishing between urban and rural hospitals.
Descriptive figures of SAS hospitals

SAS = Servicio Andaluz de Salud; FTE = full-time equivalent; MOO = major outpatient operation.
(1) Planned + emergency operations.
*Adjusted by case-mix.
**Population for reimbursement purposes.
Figures correspond to the 27 of the 29 SAS hospitals included in the analyses.
VAR 06 − 03 is the result of: (Mean2006 − Mean2003)/Mean2003.
In 2003, the SAS concluded the implementation of a new payment mechanism, which was described as a way to promote hospital efficiency, to ensure an optimum provision of services and to avoid wasting resources (SAS, 2007). The SAS asserts that the mechanism adopted is based on the capitation strategy (SAS, 2007) because it allocates the overall budget to hospitals on the basis of the population. However, as will be described below, the mechanism has some characteristics of an activity-based funding model since, for funding purposes, the population is assigned to each hospital according to the activity carried out in the previous year. The years 2000 to 2002 were a transition period in which the capitation strategy was gradually implemented. Prior to the beginning of the financing reform, the SAS hospitals were funded through budgets based on historic costs plus some specific funds according to the particularities of each hospital. The system was changed because of its failure to link activity and funding and because of the lack of an efficiency benchmark. In order to ensure the viability of the public system of provision of health care service, the new reimbursement system was expected to promote efficiency improvements by SAS (2006):
• Introducing incentives for internal competition, understood as the best way in which each hospital solves the health problems of citizens.
• Ensuring financial sufficiency for the functioning of hospitals and the efficient production of their services.
• Controlling costs, to avoid rising beyond the financial capacity of the SAS.
Internal competition is promoted by the way in which the global budget of the SAS for hospital care is allocated to hospitals while efficiency and cost control are promoted by the way in which the global budget of the SAS for hospital care is set. In year n, during the elaboration of the budget for year n + 1, the SAS knows the operative costs of hospitals for year n − 1 and an estimation of the evolution of costs for year n. The SAS uses this information to elaborate the total budget for SAS hospital operative costs for year n + 1. In the elaboration of the budget of year n + 1, the SAS considers both the adjustment of non-authorised costs and avoidable costs for year n and the trend and evolution of costs for year n + 1. In this way, the SAS tries to elaborate a ‘plausible’ budget because it takes future trends into account, but also an ‘efficient’ budget because it eliminates costs that are considered unnecessary. It is worth highlighting that the objective of the SAS is not to reduce expenditure, but to improve the efficiency and the quality of the services. The gain in efficiency must be directed to provide services for those needs not yet covered (SAS, 2007). Data about hospital and global SAS budget for the period analysed are shown in Table 3.
Public expenditure in the SAS (2002–2006)

SAS = Servicio Andaluz de Salud.
Source: SAS annual reports for 2002 to 2006.
Three factors are included in the formula applied to determine the allocation of payment to hospitals: population, tariff and case-mix:
 $$Hospital\,funding\,{\rm{ = }}\,population\,\times \,tariff\,\times \,case - mix$$
The first factor, population, is assigned to each hospital on the basis of the number of patients attended to in the previous year. Each hospital receives an amount of money per person that is estimated that would go for care to that hospital.
“…determining the population corresponding to each hospital introduces competition because improving accessibility, resolving more health problems and more complex cases, means attracting more population and more funding to the detriment of those performing worse, who would lose population and, therefore, funding (SAS, 2007).
In a capitation system, the population is the key factor to determine the final amount of money received. The larger the population in the ‘list’, the greater the reimbursement. Hospitals that are able to increase their population assigned for funding purposes will increase the percentage of the SAS budget they receive to the detriment of those losing population. This way, some kind of competition is generated. The SAS reimbursement mechanism assigns the population to each hospital for year n according to the patients attended in each of the five functional lines during year n − 1. This mechanism takes into account where the patients reside in order to allocate the population of each of the eight Andalusian provinces to hospitals. Therefore, the same medical act may represent a different allocation of population, that is, different payment, depending on the health status of the population in the province of residence for that functional line. The total number of cases treated from each province, for the five functional lines in which the SAS classifies cases, is divided by the population of that province giving a ‘weight’ to each case. Then, the number of cases from that province in each hospital is multiplied by that weight. This is calculated for each hospital, considering the eight provinces and the five functional lines. The five groups (functional lines) are: (1) Hospitalisation, (2) Outpatient surgery, (3) Outpatient visits, (4) Emergencies and (5) Other cases. Therefore, the total population of Andalusia is allocated between hospitals for each of the five functional lines, which are weighted by the percentage of costs that each functional line represents in analytical accounting. The weightings for each functional line are:

The second factor of the formula, tariff, is calculated on the basis of the operative costs of all the hospitals. Some specific costs, such as training and education and capital investments are not included in the calculus of the tariff and are additionally reimbursed. Once the budget for SAS hospitals is set, it is divided by the population of Andalusia that is attended by the SAS, thus obtaining the tariff per inhabitant.
The third factor of the formula, case-mix, is an adjustment for including in the reimbursement mechanism the differences in the services provided by hospitals because they do not all provide the same range of services. Some complex cases and thus more costly cases can only be treated in big hospitals. The complexity of the cases is measured using the DRG classification (SAS, 2007). The SAS uses the All Patient DRG classification. Each patient discharged is classified into a DRG with its corresponding weight and this is converted into DRG points. The case-mix index of a hospital is the result of dividing the total number of DRG points by the number of patients discharged. The more complex the cases treated, the higher the case-mix index. From the classification of patients into functional lines and DRG points, the SAS calculates a case-mix index for each hospital. Because some hospitals have a case-mix index higher than ‘1’ and others lower than ‘1’, the reimbursement formula takes into account the complexity of the cases treated. The average case-mix for all SAS hospitals is ‘1’, so the overall hospital budget previously calculated does not change for the inclusion of this element in the formula.
One main flaw of the previous reimbursement system was the lack of a clear link between the reimbursement system and the measurement of hospital performance, that is, efficiency. In the new system, the income of each hospital, the initial budget, is considered a benchmark for cost efficiency. Hospitals that stay within the budget are considered efficient while those that exceed the budget are initially considered inefficient. This inefficiency is subsequently analysed to identify the causes of the deviations between the real and expected budget since they can arise from an excess in the consumption of resources for the activity predicted or from a higher level of activity than predicted. Rather than rewarding or punishing hospitals, the idea is to have a clearer view of hospital performance. The SAS, as owner of all the public hospitals of the system, assumes any deficit and inefficiency incurred by the hospitals. The final financial responsibility of the SAS reduces the incentives of the managers to stay within the budget, but negative deviation affects their reputation and part of their remuneration. Moreover, since managers are selected by the SAS, they can be removed from their posts if goals are not achieved.
Quality improvements are closely linked to the reimbursement mechanism. Because Andalusian patients have the possibility of choosing the public hospital in which to be treated, SAS hospitals must provide a better service in order to maintain their reputation and not to lose patients. The opinion of the patients about the service received is a critical issue for hospital managers as well as for the SAS itself. Annual surveys are carried out in Andalusia to find out patients’ opinions about hospital care. The results of hospitals in patient satisfaction are compared against the mean of all SAS hospitals as part of their performance evaluation. Hospitals have to elaborate plans in the aspects where satisfaction scores do not reach a minimum level. The results of the annual patient survey are disclosed through the SAS website with an easy format in the hope that will help patients in their decision-making. The website also discloses the number of urgent readmissions within 31 days and the number of admissions after a major outpatient operation (MOO) as indicators of the clinical quality of hospitals. It is expected that patients will most likely choose best performing hospitals, resulting in more funding for those hospitals in future periods. In addition, the SAS does not compute readmissionsFootnote 1 as new cases and hence they do not result in more funds to hospitals. Initially, General Practitioners assist patients in choosing the hospital in which they want to be treated. Additionally, patients can request more information and change hospitals by using a phone number that the SAS has made available for that purpose. The SAS assumes all the necessary bureaucratic procedures to formalise the change. During the period 2003–2006, the variation of the population assigned to each hospital for reimbursement purposes changed, on average, by more than 10%, which reflects a relatively low flow of patient between hospitals (see Table 2).
4 Methodology
4.1 Analysis of efficiency improvements: the Data Envelopment Analysis (DEA) methodology and the Malmquist index
In order to evaluate the evolution of the efficiency for the period considered, we apply the DEA methodology to measure the efficiency of the hospitals for the years 2003 and 2006, separately, and then we calculate the Malmquist index. The DEA (Charnes et al., Reference Charnes, Cooper and Rhodes1978; Cooper et al., Reference Cooper, Seiford and Tone2000) is an extended methodology applied in prior studies on hospital performance that provides a comparative efficiency indicator of the units to evaluate. Hollingsworth et al. (Reference Hollingsworth, Dawson and Maniadakis1999), Hollingsworth (Reference Hollingsworth2003), Hollingsworth (Reference Hollingsworth2008) and O'Neill et al. (Reference O'Neill, Rauner, Heidenberger and Kraus2008) provide recent revisions of the literature using DEA in hospitals. The method is especially appropriate for evaluating the efficiency of non-profit entities like public hospitals, which operate outside the market since, for them, measures of efficiency such as income and profitability do not work satisfactorily.
DEA provides a comparative efficiency indicator of the units to evaluate (in this case hospitals), which are called decision-making units (DMUs). The relative efficiency of a DMU is defined as the ratio of the total weighted output to the total weighted input. DEA does not require any external production function to be taken as a reference and the actual inputs and outputs observed are used to estimate a benchmark production frontier. The solution to the DEA problem calculates the weightings for the inputs and outputs of the hospital being evaluated that maximise its productivity in comparison to the other hospitals of the sample. If a hospital achieves a score of 100%, it means that it is impossible to find other DMUs or a composite DMU outperforming that hospital. If the score is less than 100%, the hospital will not form part of the production frontier because more efficient hospitals have been found in the sample. From a management perspective, DEA is especially useful to know which hospitals are operating significantly below the production frontier (score <100%), because this signals that improvements are possible. The units with a 100% score are considered efficient, but they are not necessarily the optima, because the results cannot be extrapolated outside the sample. From the different specifications of the model, we apply the input-oriented model and the constant returns to scale (CRS) approach, which is consistent with the DEA literature on health care (see O'Neill et al., Reference O'Neill, Rauner, Heidenberger and Kraus2008). Moreover, CRS is especially appropriate for working with reduced-sized samples (Prior, Reference Prior2006; Vitikainen et al., Reference Vitikainen, Street and Linna2009).
The selection of the variables to be included in the model is critical in the development of DEA. In general, the sum of inputs and outputs considered should not exceed one-third of the number of DMUs. The inclusion of a large number of variables reduces the discriminatory power of the model because it increases the number of efficient DMUs (Cooper et al., Reference Cooper, Seiford and Tone2000). This is because the number of dimensions in which a particular DMU can be unique (and, thus, with no partners to be compared with) increases. Johnes and Johnes (Reference Johnes and Johnes1993) argue that a DMU can sometimes achieve 100% efficiency simply because no one else is competing in that niche of activity. We work with variables that have been widely used in previous studies, according to the revision of O'Neill et al. (Reference O'Neill, Rauner, Heidenberger and Kraus2008), as representative of the principal input and output indicator categories in hospitals. The inputs included are the number of beds as a proxy of the size and capacity of the hospitals and full-time equivalent (FTE) physicians and FTE nursing staff as a proxy of the human resources. O'Neill et al. (Reference O'Neill, Rauner, Heidenberger and Kraus2008) reported that the majority of studies use the number of beds as a proxy for the infrastructure of hospitals. Many studies have introduced some indicator of the number of clinical staff as a proxy for labour costs (e.g. Pina and Torres, Reference Pina and Torres1996; Prior, Reference Prior2006; Nayar and Ozcan, Reference Nayar and Ozcan2008; García-Lacalle and Martín, Reference García-Lacalle and Martin2010).
As outputs, we have used indicators that reflect both the inpatient activity – operations (planned + emergency operations) and diagnoses – and the outpatient activity carried out in hospitals – outpatient visits, emergencies and MOOs. Operations and diagnoses are adjusted by case-mix in order to reflect the complexity of these activities. We do not consider any variable representative of inpatient-stays as, with the implementation of PPS, hospitals have incentives to reduce their duration. Indeed, the objective of any health care system should be the reduction of the length of stay and of the services provided to hospitalised patients. Furthermore, bed reductions and the promotion of outpatient activity have the objective of reducing the number of stays. By reducing stays, hospital costs are also reduced. This represents a significant shift from the ‘inpatient day’ to the ‘case’ as the primary means of hospital reimbursement (O'Neill et al., Reference O'Neill, Rauner, Heidenberger and Kraus2008). Anyway, we acknowledge that ‘inpatient days’ may be reckoned as an important hospital output. However, when using the DEA methodology, this indicator may be biased by inefficiency. Hospitals might have patients hospitalised longer than needed, thus having more days of stay, resulting in better DEA results. O'Neill et al. (Reference O'Neill, Rauner, Heidenberger and Kraus2008)'s review of DEA analysis in health care reports that the use of ‘inpatient days’ as an output category has been steadily decreasing since 1985. The main descriptive figures of the inputs and outputs included in our analyses and the two above mentioned quality indicators are included in Table 2.
The Malmquist index allows us to carry out a dynamic analysis of efficiency growth during a period, using the solutions of the DEAs. As we have worked with an input-oriented model, indexes lower than ‘1’ indicate an improvement during the period; greater than ‘1’ indicate a worsening, and equal to ‘1’ indicate no efficiency variations during the period. The precise formulation of the Malmquist index is as follows:
 $${{M}_I}({{x}^t}, {{y}^t}, {{x}^{t\, + \,{\rm{1}}}}, {{y}^{t\, + \,{\rm{1}}}} )\, = \,{{\left[ {\frac{{D_{I}^{t} ({{x}^{t\, + \,{\rm{1}}}}, {{y}^{t\, + \,{\rm{1}}}} )}}{{D_{I}^{t} ({{x}^t}, {{y}^t} )}}\frac{{D_{I}^{{t\, + \,{\rm{1}}}} ({{x}^{t\, + \,{\rm{1}}}}, {{y}^{t\, + \,{\rm{1}}}} )}}{{D_{I}^{{t\, + \,{\rm{1}}}} ({{x}^t}, {{y}^t} )}}} \right]}^{{\rm{1/2}}}} $$
where x and y stand for input and output vectors of the sample unit, respectively, whose efficiency we attempt to measure and t stands for the time periods under analysis. From an input-oriented perspective, an efficiency growth is achieved if M < 1 and an efficiency regression if M > 1.
The variation in productivity over the time may be a consequence of a different relative position of the hospital with respect to the production frontier because (i) the hospital is operating closer (further) to the maximum level that it is expected or (ii) the capacity for producing has been expanded (contracted) for all the systems. Färe et al. (Reference Färe, Grosskopf, Norris and Zhang1994) factorised the original expression of the Malmquist index (1) identifying the two sources of efficiency change: technical change and technological change
 $${{M}^{}} _{I} ({{x}^t}, {{y}^t}, {{x}^{t\, + \,{\rm{1}}}}, {{y}^{t\, + \,{\rm{1}}}} )\, = \,\frac{{{{D}^{}} _{I}^{{t\, + \,{\rm{1}}}} ({{x}^{t\, + \,{\rm{1}}}}, {{y}^{t\, + \,{\rm{1}}}} )}}{{D_{I}^{t} ({{x}^t}, {{y}^t} )}}{{\left[ {\frac{{{{D}^{}} _{I}^{t} ({{x}^{t\, + \,{\rm{1}}}}, {{y}^{t\, + \,{\rm{1}}}} )}}{{{{D}^{}} _{I}^{{t\, + \,{\rm{1}}}} ({{x}^{t\, + \,{\rm{1}}}}, {{y}^{t\, + \,{\rm{1}}}} )}}\frac{{{{D}^{}} _{I}^{t} ({{x}^t}, {{y}^t} )}}{{{{D}^{}} _{I}^{{t\, + \,{\rm{1}}}} ({{x}^t}, {{y}^t} )}}} \right]}^{{\rm{1/2}}}} $$
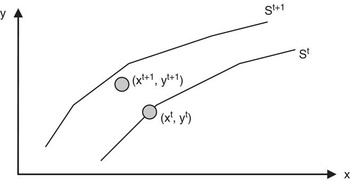
The first factor (outside the square brackets) represents the technical change, that is, the evolution of the distance of a hospital from the production frontier. The factor that determines the technical change of a hospital is the evolution of its performance in relation to the other hospitals, that is, it depends on the ability of each hospital to reduce inputs and/or increase outputs. The second factor (between the square brackets) measures changes in technology over two time periods, it is to say whether the frontier is shifting out over time. The technological change measures the movement in the production frontier defined by the best practices of the hospitals of the sample in each period, and is determined by the performance of all hospitals of the sample. The principal factors that explain the displacements of the production frontier are technological progress or organisational changes affecting all the hospitals in the system. Figure 1 illustrates a simple case in which a single input ‘x’ produces a single output ‘y’. One hospital is observed at time ‘t’, showing the combination of inputs and outputs (x t, y t) and, again, at time ‘t + 1’, showing the combination (x t + 1, y t + 1). S t and S t + 1 represent the production frontiers for each year. This hospital has improved its productivity in the period observed since, in ‘t + 1’, it produces more outputs using less inputs. This improvement has been due to the expansion of the frontier in the period ‘t + 1’, representing the technological change. Nevertheless, the technical change has been negative, since in the year ‘t’ the hospital was on the frontier, whereas in ‘t + 1’ it is operating below its capacity.
The input-based productivity change.

Reforms in hospital reimbursement methods may lead to both technological and technical changes. A more effective allocation of resources would contribute to extending the technological frontier of the system by enabling hospitals to achieve higher levels of production. The method may also encourage hospitals to reduce cost inefficiencies to operate closer to the frontier, resulting in an improvement of technical efficiency (Mckay and Deily, Reference Mckay and Deily2008).
4.2 Analysis of the impact of efficiency improvements on quality
In order to explore the impact of the evolution of efficiency on hospital quality, both clinical and perceived, we apply the Spearman correlation coefficient, using the Malmquist indexes (overall, technical and technological) and the variations in clinical and perceived quality indicators. The Spearman correlation coefficient is a variation of the Pearson coefficient but it is less restrictive because it does not require normality. It reflects the degree of linear relationship between two variables and ranges from +1 to −1. A correlation of +1 means that there is a perfect positive linear relationship between the variables. The patient satisfaction rate is the variable representative of perceived quality. To represent clinical quality indicators, we use the readmission rate – percentage of patients that have been readmitted within 31 days for the same reason after discharge – and the admission rate after MOOs – percentage of patients admitted within 31 days for the same reason after a MOO. By using one indicator representative of inpatient activity and another representative of outpatient activity, we better capture the quality of hospitals.
The readmission rate has been frequently used as an indicator of clinical quality (see e.g. Carey and Burgess, Reference Carey and Burgess1999; Ho and Hamilton, Reference Ho and Hamilton2000; Shmueli et al., Reference Shmueli, Intrator and Israeli2002; Kaboli and Barnett, Reference Kaboli and Barnett2004). The readmission rate is a good indicator of care (Clarke, Reference Clarke2004) and an outcome measure closely related to the service and process of care (Ashton et al., Reference Ashton, del Junco and Mansyur1997; Jha et al., Reference Jha, Orav, Li and Epstein2007). As the readmission and the admission after MOO rates are indicators of the ‘bad’ quality of hospitals, for the analysis we use their complementaries. The level of patient satisfaction with the hospitals is obtained from the annual carried out by an independent agency in collaboration with the SAS, which is based on 400 telephone interviews for each hospital. Patient satisfaction with hospitals is commonly used as an indicator of hospital perceived quality (Cheng et al., Reference Cheng, Yang and Chiang2003). The patient satisfaction indicator shows the percentage of patients who responded that they were satisfied or very satisfied when asked about the global perceived quality of the hospital.
Northcott and Llewellyn (Reference Northcott and Llewellyn2003) argue that, for comparisons to be valid, similar hospitals must be analysed and compared. Rural hospitals are smaller and usually attend less complex cases than their urban counterparts. Thus, using the Mann–Whitney U-test, we have carried out comparisons between rural and urban hospitals of the evolution of the performance for the three Malmquist indexes – overall, technical and technological – and for the changes in the readmission and patient satisfaction rates. The grouping of rural or urban hospitals follows the SAS classification. This allocation into the two groups reduces the differences between the hospitals analysed while keeping the number of hospitals in each group big enough to conduct the analysis. With this classification, rural hospitals represent hospitals with less than 300 beds (small and medium hospitals), whereas urban hospitals have more than 500 beds, that is, big hospitals. The analysis of hospital performance according to their location, rural and urban, and their comparison has been carried out in the academic literature by several authors (e.g. Athanassopoulos and Gounaris, Reference Athanassopoulos and Gounaris2001; Gruca and Nath, Reference Gruca and Nath2001; Nayar and Ozcan, Reference Nayar and Ozcan2008; García-Lacalle and Martin, Reference García-Lacalle and Martin2010). Kim (Reference Kim2010) finds that the factors that affect the performance of urban and rural hospitals are different.
5 Analysis of the results
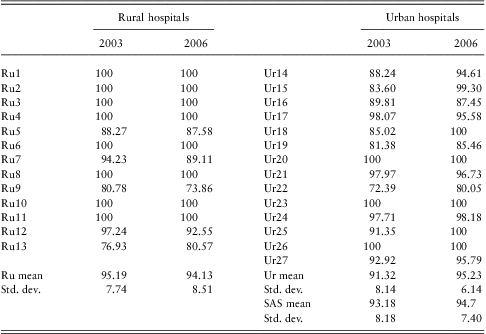
The results of the DEA (Table 4) show high scores for most of the SAS hospitals, which indicate that they are operating close to the efficiency frontier in both years. Each of the two DEA, one for 2003 and one for 2006, includes all the hospitals in our sample, that is, rural and urban hospitals, which allows to compare their performance. However, as stated in Section 4.1, a score of 100% does not mean that a hospital is operating efficiently, but that no other hospital in the sample shows a better performance considering the combination of inputs and outputs. The lack of an objective to be compared with only allows us to assert that the system is performing homogenously, but not that their performance is optimum. This is probably because the SAS is still, in part, a centralised system, which influences the allocation of resources to hospitals. Nevertheless, the results are consistent with prior studies carried out using DEA methodology. The literature reviews carried out by O'Neill et al. (Reference O'Neill, Rauner, Heidenberger and Kraus2008) and Hollingsworth (Reference Hollingsworth2003) show an average efficiency of 90% for European hospitals and 86% for the United States. In 2003, rural hospitals perform, on average, more efficiently and more homogeneously than urban hospitals, but, in 2006, the gap between rural and urban hospitals disappears and the latter even show greater efficiency. In addition, in 2006, urban hospitals perform more homogeneously than their rural counterparts. The reduction of the standard deviation of DEA scores from 2003 to 2006 points to a homogenisation in the performance of hospitals.
DEA scores (%) for 2003 and 2006
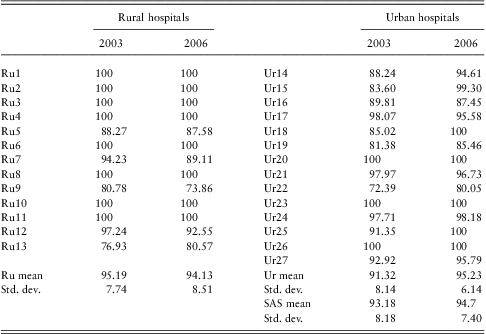
DEA = data envelopment analysis.
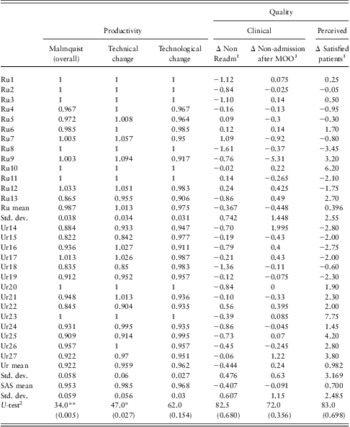
Malmquist results (Table 5) show a positive evolution in the efficiency of the hospitals during the period 2003–2006. In particular, improvements tend to be better in the hospitals that, in the 2003, achieved the lowest DEA scores. Although the improvements are generalised, they are greater in the case of urban hospitals. The decomposition of the Malmquist index into technical and technological changes shows that SAS hospitals have improved in both aspects, particularly in the latter. The technical factor is related to the individual behaviour of the hospitals and the technology factor determines movements of the production frontier. Both rural and urban hospitals have improved in terms of technological change, but only urban hospitals have improved in terms of technical change, that is, improvements due to internal factors. Therefore, the overall improvement of urban hospitals is better than the evolution of rural hospitals, which are harmed by the negative evolution of their technical change.
Malmquist indexes and variations in quality

1The Δ of the quality indicators is calculated as the score in 2006 (%) minus the score in 2003 (%).
2Significance (bilateral) in brackets; **Significant at 0.01; *Significant at 0.05.
The U-test shows significant differences between rural and urban hospitals in the Malmquist (overall) index and in the technical change. Urban hospitals have had significantly better overall efficiency improvements than rural hospitals during the period. The variations in technology have affected both groups of hospitals similarly, but urban hospitals have improved their efficiency more significantly than rural hospitals in technical aspects. Therefore, the better overall improvement of the urban hospitals is due to internal factors of the hospitals rather than external factors derived from the different impact of technological progress.
As for quality, Table 2 shows that there has been a worsening in the clinical quality indicators of SAS hospitals from 2003 to 2006, although the variation is very small. Urban hospitals have had a negative evolution of their clinical quality in terms of the inpatient activity, as all urban hospitals but one present a decrease of the non-readmission rate (Table 5). On average, urban hospitals improve the clinical quality of outpatient services, although only half of them improve in this aspect. Rural hospitals have had a negative evolution for the two clinical quality indicators, although their behaviour is less homogeneous than urban hospitals. In particular, half of the hospitals improve their admission after MOO rate and the other half have a negative evolution of this ratio, as it happens with urban hospitals, but the mean of the group is especially influenced by the Ru9 hospital. The U-test does not show significant differences between the two groups of hospitals in clinical quality. Both groups of hospitals improve their perceived quality, although the improvement is, on average, greater in urban hospitals. The U-test does not show significant differences between the two groups.
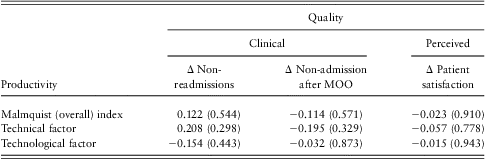
The correlation analyses (Table 6) show no significant relationships between the evolution of efficiency and clinical quality. As for the value of the coefficients, all of them are lower than 0.2 with a significance far from the 0.1, which is the value that usually marks the limit for the statistical significance of the correlation. Technical change and the evolution of non-readmissions are the variables with the closest relationship because they have a correlation coefficient greater than 0.2. Its positive sign would suggest that improvements in hospital efficiency are negatively related to inpatient clinical quality. The perceived quality of SAS hospitals remains steady during the period (Table 2) and the correlation analyses show no significant relationship between the evolution of efficiency and perceived quality.
Spearman correlation results between the evolution of efficiency and quality (clinical and perceived)
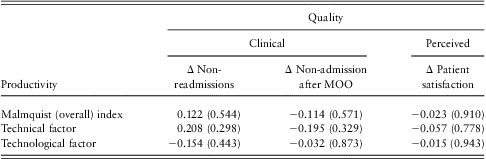
Significance in brackets.
Because of the interpretation of the Malmquist input-oriented index, a positive correlation represents a negative relationship between productivity and quality evolution and vice versa.
6 Discussion
In 2003, Andalusia completed the implementation of a new strategy, based on a capitation scheme, to allocate the annual budget for its hospitals. Linked with a freedom of hospital choice initiative and, thus some competition, it was expected that this reimbursement mechanism would improve the accountability of the SAS at the same time as encouraging hospital efficiency and quality. During the last two decades, numerous OECD countries have changed their health care reimbursement in pursuit of similar goals. However, the method adopted by the SAS, based on the capitation approach, is significantly different from the most extended strategy in Europe, based on the per case approach. The SAS system works like an overall prospective budget that is allocated to hospitals on the basis of retrospective patient load measures adjusted by the complexity of the cases. The exclusion of capital costs and investments from the budget that is allocated to hospitals has also been adopted by other countries, for example, Germany, Denmark (Ankjær-Jensen et al., Reference Ankjær-Jensen, Roslingand and Bilde2006) and Hungary (Gaal et al., Reference Gaal, Stefka and Nagy2006). The innovation of the method is not in the way that the global expenditure for the SAS hospital is set, as it is established as a global budget considering historical costs and cost trends excluding unnecessary costs, but in how the money is distributed among the hospitals. Capitation is usually used for primary care, but not for hospital care. The DRG classification is not used to pay a tariff per case but as a tool to adjust the overall reimbursement for each hospital. The population that each hospital is assigned for funding purposes is mainly based on the activity carried out in the previous year, approaching the model to a per case payment system. This approach introduces competition because hospitals have to increase their activity above the average to be assigned a greater part of the population. As the increase of funds will be in the next period, this results in an attempt to increase activity within the budget, or even above the budget. Deficits due to a greater activity than predicted are not considered inefficiency by the SAS and do not have negative effects on managers. This results in a clear incentive to move the efficiency frontier upwards. In addition, each patient represents a different amount of inhabitants assigned depending on their residence (province). Thus, hospitals would be more interested in recruiting patients from ‘healthier’ provinces for each functional line but they have no influence over this aspect because they cannot advertise themselves and patients choose their hospital without the hospitals having had the possibility of carrying out risk selection practices. This peculiarity may be considered a weakness of the system because some hospitals are rewarded and others harmed just because they are located in a ‘healthier’ province in a context where patients usually prefer to be treated in the nearest hospital. Differences in the weight of population between provinces are not very big, but exist.
During the period analysed (2003–2006), although the number of beds and nursing staff fell and the number of physicians only slightly increased, SAS hospitals increased their activity and, therefore, improved their productivity. It is not possible to determine to what extent the change of reimbursement model explains the improvement in productivity but it seems to have contributed to this evolution. The diminishing of inpatient activity, in part due to the combination of shorter stays and lower occupancy rates, allows an increase in outpatient activity with fewer inputs. The reduction of the average length of stay is a common policy in most European countries (van Barneveld et al., Reference van Barneveld, Lamers, van Vliet and van de Ven2001), where reforms have tried to reduce inpatient days of stay to better use the resources and shorten waiting lists. The increase in the number of physicians in SAS hospitals may have been necessary to increase hospital outputs, as physicians are the key input determining hospital activity (Pilyavsky and Staat, Reference Pilyavsky and Staat2008). The reduction in the number of beds may be the key factor to explain the productivity improvement of SAS hospitals because it increases the ratio of outputs to inputs. This argument would be valid if hospitals maintained the same number of outputs, which is not the case here. During the period studied, there has been a significant increment of outputs, particularly of MOOs and diagnoses. Prior to the reform, SAS hospitals had already shown this trend, but less marked, diminishing the number of inpatient days of stay and increasing the outpatient activity (García-Lacalle and Martin, Reference García-Lacalle and Martin2011). The reform of the payment scheme is part of a wider strategy of the SAS aimed at intensifying medical treatments. The rise in the number of diagnoses may be the natural result of the increase of all the other outputs because treating patients more ‘intensively’ to reduce the length of stays and treating them as outpatients requires more diagnoses. The increase in the number of diagnoses (weighted by case-mix) is more than proportional to the evolution of the other activities so it may be reflecting an overuse of the diagnoses in order to classify cases in ‘higher’(more complex) DRG and, thus, to achieve the efficiency benchmark. The high level of information asymmetries in health care allows these practices to be carried out without being detected. During the period analysed, there has been a significant increment of the complexity of the cases, case-mix, treated, as shown in Table 2. We cannot be sure whether there has been ‘DRG-creep’ in the SAS. It is more likely to occur where there are for-profit providers involved and where salaries depend on the results of coding (Steinbusch et al., Reference Steinbusch, Oostenbrink, Zuurbier and Schaepkens2007). The public nature of hospitals makes risk selection and ‘DRG-creep’ effects less important than in the private sector, since the achievement of financial surpluses is not a priority.
The changes observed in the SAS hospitals are consistent with the shift from the ‘inpatient approach’ to the ‘case approach’. International experience shows that the ‘case approach’ does not always result in higher productivity. For example, in the United Kingdom, NHS output increased by 4.5% per year after the implementation of the ‘payment by result’ system, whereas the input used to produce it increased by 4.7% (Peñaloza et al., Reference Peñaloza, Hardie, Wild and Mills2010). In the case of Andalusia, the reduction of the length of stays implies cost savings of around 5% of hospital costs (Gavira and Carmona, Reference Gavira and Carmona2012), but it releases beds for other patients so the overall expenditure of the system has increased during the period. Whereas inpatient days have diminished by around 6%, in the same period, hospitalisations decreased by 4%. In terms of budget, despite the increase in the public expenditure devoted to health care in Andalusia (7.3% GDP), the GDP devoted to health care is still lower than the EU average (8.1% GDP). Nevertheless, comparisons with other health care systems are difficult since factors like the number of services provided and/or covered, quality measures, life habits and conditions and technological investments influence final outcomes.
The higher efficiency in the allocation of funds may also be the reason for the homogenisation of the productivity of SAS hospitals as the reimbursement system penalises hospitals that have a surplus of resources. This allocative efficiency will contribute to the expansion of the production frontier, making it possible to achieve new levels of production. This may be evidenced by the improvement of the productivity measured by the technological change although technological progress itself normally contributes to the expansion of the frontier. The comparison between rural and urban hospitals shows that urban hospitals, on average, have improved their efficiency more than rural hospitals. The greater efficiency improvements of the urban hospitals result from the technical factor and not because of a better technological evolution. The decline in the performance of rural hospitals is fundamentally due to only three hospitals (Ru7, Ru9 and Ru12). However, if we focus on the technical change, we observe that only one rural hospital (Ru13) has improved its efficiency during the period, whereas eight urban hospitals have improved their performance. One possible explanation for the better technical evolution of urban hospitals is that they have a lower population per bed ratio for reimbursement purposes than rural hospitals. Therefore, they have a greater capacity for increasing hospital activity. In addition, there has been a greater variation in the population assigned for reimbursement purposes to the urban hospitals than to the rural ones, suggesting more competition between the former. The pressure on urban hospitals to be efficient is greater as they have a more restricted funding per bed. The annex shows the ‘population per bed’ ratio and the variation of the population for each group of hospitals. The greater competition in urban areas, where at least two hospitals usually provide care, encourages efficiency improvements in order to maintain the population enrolled. The difference in the ‘population per bed’ ratio between rural and urban hospitals has gone down during the period, evidencing a homogenisation in SAS hospitals in this aspect. Urban hospitals benefit from this competition as they have attracted patients and, thus, funds from rural areas.

FTE = full-time equivalent; MOO = major outpatient operation; SAS = Servicio Andaluz de Salud.
(1) Planned + emergency operations.
*Adjusted by case-mix.
**Population for reimbursement purposes.
Figures correspond to the 27 of the 29 SAS hospitals included in the analyses.
VAR 06 − 03 is the result of: (Mean2006 − Mean2003)/Mean2003.
The improvement in efficiency in the utilisation of resources has not resulted in a saving of funds, as shown in Table 3. In fact, hospital expenditure has gradually increased since 2003. The reduction in 2003 coincides with the year in which the new reimbursement system was fully implemented and it may be a consequence of an anomalous estimation of activity and tariffs. It is not possible to state whether the increase of hospital funding during the following years is due to more productivity, the inclusion of new services or just the consequence of the strong economic growth experienced in Spain during that period. In the SAS (and, in general, in all Spanish regions), the reduction of the long hospital waiting lists constitutes one of the priorities of the health policies. The accomplishment of this objective requires more resources and/or a more efficient use of existing resources. The reduction of hospital costs in relation to the total expenditure of the SAS suggests an improvement in the management of the resources devoted to hospitals.
In terms of quality, one virtue of capitation highlighted in the literature is its ability to promote prevention. This is most likely to occur when the tariff per person is linked to reimbursing any health care need of the population on the list, because the tariff includes any service demanded by patients, which encourages prevention in order to avoid treating patients in hospitals where costs are higher. In the SAS hospital reimbursement mechanism, there is not a ‘list of patients’ for each hospital, as patients can choose hospital when care is needed. Thus, prevention measures previous to specialised care need cannot be implemented by hospitals, as on individual basis, each hospital does not know on which patients apply measures. However, in a public health care system funded by general taxation, such as the SAS, in which the system must assume the cost of both primary and secondary care, the incentives for promoting prevention are always high, and are centrally organised, because they can result in a reduction in health care expenditures.
The SAS hospitals have experienced a slight worsening in their clinical quality indicators, particularly those related to their inpatient activity. Most hospitals present a worsening in the readmission rate. This may be due to the shift from inpatient to outpatient operations, which results in an increase in the average complexity of the cases hospitalised. Inpatient activity increases its average complexity because less complex cases are transferred to outpatient services. The implementation of the freedom of hospital choice initiative was expected to protect patient interests by allowing them to choose ‘good’ hospitals. The unwillingness of patients to travel for receiving care may limit the success of the initiative, thus the competition between hospitals and probably managers’ concerns for quality. However, capitation encourages ‘prevention’ – in terms of good quality within hospitals to avoid readmissions, because there is no extra money to cover the costs of bad quality. This is one virtue of the capitation strategy highlighted in the literature, particularly when there is a ‘list of patients’. As stated, the SAS considers a readmission to be when a patient returns to hospital for the same reason after discharge within 31 days, and those patients that choose to go to a different hospital are not considered a ‘readmission’. This is a weakness of the reimbursement mechanism because the patient is considered twice instead of only being counted where he/she is ‘finally’ discharged. Nonetheless, patients who have to go back to hospital will most likely return to the same hospital in which they were previously treated, generating a ‘readmission’, which is not funded. In the United Kingdom, a simple hospital prevention measure, such as frequent hand washing by the staff, has reduced hospital infections and, thus, readmissions and/or longer stays. In the SAS, outpatient operations have increased their average complexity because they receive cases that were previously treated as inpatients. This higher complexity has not resulted in a significant variation of outpatient clinical quality.
The correlation analysis shows that improvements in efficiency are not significantly related to a negative quality evolution. However, in the case of the relationship between technical change and the evolution of non-readmission rates (inpatient quality), the results suggest that they are negatively related. Policies aimed at reducing ALOS increase pressure on the personnel. The shift from inpatient to outpatient activity may have resulted in a larger work burden for the staff because more patients are treated. Although bad quality has a cost, since readmissions or the duplication of tests and procedures due to mistakes are not reimbursed, SAS hospitals may be prioritising efficiency over quality. It is expected that, once a certain level of efficiency is reached, the additional costs of lower quality will exceed efficiency gains and hospitals will (re)focus on quality. Because of the importance of the relationship between productivity and clinical quality, care is needed when evaluating hospital performance evolution. Authorities need to monitor quality aspects to ensure that there is no trade-off between efficiency and clinical quality. Readmissions represent a source of inefficiency for the system, so reducing them will contribute to savings in health care costs. It is not clear whether the new SAS payment system results in hospitals providing a lower quality of care or whether the increase in readmissions is a consequence of using high-intensity treatments. A similar problem has been experienced in England, where the number of hospital readmissions increased by 53% during the first decade of the 21st century, a period in which different reforms were introduced in the management and structure of the NHS (Peñaloza et al., Reference Peñaloza, Hardie, Wild and Mills2010).
The perceived quality of SAS hospitals barely changed during the period analysed, showing that the improvements in productivity were achieved without affecting the perception of patients. This suggests that the aspects that patients take into account in their assessments are not necessarily related to an additional consumption of resources but, at the same time, it demonstrates the inability of patients to judge medical practices. For this reason, patients usually prefer to receive care in their nearest hospital unless earlier care is provided elsewhere (see e.g. Botten et al., Reference Botten, Grepperud and Nerland2004; Propper et al., Reference Propper, Wilson and Burgess2006). The existence of similar waiting times, which are regulated by law, in most of the Andalusian hospitals, and in general in the Spanish health care system, partially explains flow of patients despite of the freedom of hospital choice policy.
7 Conclusions
This paper has analysed the reform of the financing of the SAS hospitals carried out at the beginning of the 21st century and the evolution of their performance after its implementation. The main particularity of the formula applied in Andalusia, compared with most of the EU countries, is that it is based on a capitation approach. The SAS allocates its budget to each hospital according to the population that each hospital has been assigned for funding purposes. The calculus of this population uses the information of the cases attended to in the previous year. In addition, the complexity of the cases is taken into account to determine the final reimbursement of each hospital. The purpose of the financing reform is to allocate funds more rationally, promoting the accountability of the system by providing an efficiency benchmark and, ultimately, to improve the performance of hospitals and value for money. The structure of the SAS with no separation between the purchaser and the providers of the services and the existence of asymmetric information are factors that may diminish the effectiveness of the reform.
During the period analysed, the SAS hospitals have improved their productivity. In particular, they have increased the intensity of treatments with more diagnoses and part of the inpatient activity has been transferred to outpatient activity. Although the results are not conclusive, there is some evidence suggesting that the financing reform has contributed to this improvement. The larger improvements in urban hospitals are coherent with their being more sensitive to competition than rural hospitals.
The homogenisation in the efficiency of hospitals suggests that the capitation model leads to a fairer allocation of resources according to the level of activity carried out. However, it may also suggest that hospitals prefer to become ‘average’ hospitals because the tariffs are calculated according to average costs. Furthermore, the introduction of competition might have encouraged some hospitals to artificially classify cases into more complex DRG in order to receive more money. Nonetheless, our analysis does not allow us to establish whether more complex cases have been treated or whether, on the contrary, there have been DRG-creep practices.
Efficiency improvements are not significantly related to the evolution of hospital quality. Hospitals can improve their productivity without the quality of their services worsening. However, the negative evolution of the clinical quality of some hospitals may be the result of a greater focus on efficiency. The perceived quality of hospitals has not declined during the period indicating that improvements in patients’ satisfaction do not necessary result in the consumption of more resources. However, it also shows the inability of patients to judge medical treatments as a consequence of information asymmetry.
This study provides empirical evidence of the performance of hospitals under a risk-adjusted capitation payment system. Nevertheless, the results are preliminary and it is worth highlighting two limitations. First, the changes in the performance of hospitals are explained only in terms of the reimbursement mechanism. These mechanisms play a key role in the reforms of health care systems and are triggering hospital performance improvements but they are part of a wider health care policy. Second, this paper only explores the relationship between the evolution of productivity and quality. Further research should address the impact of risk-adjusted capitation payments on hospital quality.
Acknowledgements
This study has been carried out with the financial support of the Spanish National R&D Plan through the research project SEJ2010-17463/ECON/FEDER.