
I. INTRODUCTION
Copper catalysts are usually used for CO2 hydrogenation to methanol and they have been discovered since the 1920s. The CuO–ZnO catalysts for methanol synthesis have been intensively investigated for the past several decades, from the pioneering work of Klier, Chinchen, and ICI group onwards.Reference Klier, Eley, Pines and Paul1–Reference Behrens, Kißner, Girsgdies, Kasatkin, Hermerschmidt, Mette, Ruland, Muhler and Schlögl7 There is still ongoing debate about the role of ZnO in the methanol synthesis process. For example, Choi’s group declared that the role of ZnO is to create the Cu–Zn alloy active sites for methanol synthesis.Reference Choi, Futagami, Fujitani and Nakamura8 Fujitani’s group summarized ZnO promoting methanol synthesis by forming Cu+ at the interface between a Cu particle and a ZnO moiety.Reference Fujitani, Saito, Kanai, Kakumoto, Watanabe, Nakamura and Uchijima9 ZnO acts as a geometrical spacer between the Cu nanoparticles and helps to stabilize the Cu dispersion.Reference Zander, Kunkes, Schuster, Schumann, Weinberg, Teschner, Jacobsen, Schlögl and Behrens10–Reference Yang, Brown, Zhao, Chaffee, Nick, Zhao, Webley, Schalch, Simmons and Liu14
Carbon materials have been extensively used as catalyst supports due to their potential surface areas, flexibility with regards to pore size, and low reactivity under a variety of conditions.Reference Liu, Huang, Jiang, Liu and Yu15–Reference Tacconi, Chanmanee, Dennis and Rajeshwar17 In our previous work,Reference Duan, Yang, Singh, Chiang, Wang, Xiao, Patel, Danaci, Burke and Zhai18–Reference Palza, Saldias, Arriagada, Palma and Sanchez20 we successfully introduced CuO–ZnO into a mesoporous carbon support and found that the materials were very effective as methanol synthesis catalysts. However, mesoporous carbon supports are not attractive from a commercial perspective due to their high fabrication costs and low production yield. In this report, we describe the use of a common carbon material, commercial activated carbon, as the catalyst support. Many researchers’Reference Aksoylu, Madalena, Freitas, Pereira and Figueiredo21–Reference Schwegler, Vinke, Van der Eijk and Van Bekkum23 results showed that activated carbon is a very promising material as a catalyst support. Furthermore, the surface oxygen groups of activated carbon (AC) determine the hydrophilic/hydrophobic properties of AC and act as anchoring sites for metallic precursors. The acidic groups on the AC surface decrease the hydrophobicity of the carbon, leading to the accessibility of the surface to aqueous metal precursor, as a consequence, improve the metal/metal oxide dispersion of the resulting catalysts. Ammonium persulfate (APS), HNO3, HCl, and HF were widely used in the literature studies to modify the carbon surface.Reference Tseng and Wey24,Reference Zhu, Radovic and Lu25 Herein, we choose APS as the chemical agent to create acidic groups on the carbon support and expecting better dispersion of the metal precursor.
To reform the role of ZnO in the catalysis of CO2 hydrogenation to methanol, APS-modified AC was prepared and used as the catalyst support for CO2 hydrogenation to methanol. The catalysts with same amount of Cu and Zn were loaded together as well as separately on the resulting support using a facile wet-impregnation method. We examined the catalytic activities for methanol synthesis using selected catalysts CuZn/C, Cu/C, and Zn/C. We then discussed whether or not the presence of ZnO promoted the catalytic activity of Cu particles.
II. EXPERIMENTS
A. Catalysts preparation
The coconut shell type of AC was supplied by Activated Carbon Technologies Pty Ltd., Melbourne, Australia. The AC was ground and sieved to 300–500 µm prior to use. Then 10 g of AC was treated in 100 mL 0.1 M APS solution at 288 K for 24 h, followed by extensive washing with distilled water and overnight drying at 373 K. The resulting support was denoted as AC–APS.
Reagent grade of Cu(NO3)2·2.5H2O and Zn(NO3)2·6H2O were purchased from Sigma-Aldrich (Madison, Wisconsin). The amount of the added salts was based on the total pore volume of support AC–APS and the CuO and ZnO loading of the resulting catalysts was 21 wt%. The mole ratio of CuO to ZnO was 2. Then the support AC–APS (2 g) was dispersed in absolute ethanol (4.0 g), followed by the addition of a 20 wt% alcoholic solution containing Cu(NO3)2·2.5H2O and Zn(NO3)2·6H2O. The mixture was placed in a rotary evaporator (Ika RV10, IKA, Brisbane, Australia) with a rotating rate of 100 r/min to remove ethanol. After being dried thoroughly at room temperature under vacuum, the sample was put in a tube furnace and calcined under a nitrogen atmosphere at 573 K for 3 h. The catalyst loaded with CuO and ZnO was denoted as CuZn/C and the catalyst loaded with CuO or ZnO was denoted as Cu/C or Zn/C. The prepared catalyst was denoted as fresh catalysts while the catalyst underwent the reaction was denoted as used catalysts.
B. Characterization of catalysts
Nitrogen sorption analysis was measured on a Micromeritics Tri-star sorption analyser at 77 K. Powder X-ray diffraction (XRD) analysis was performed on a Philips PW1130 powder diffractometer (Philips, Amsterdam, the Netherlands) with Cu Kα radiation (λ = 1.5405 Å) at 40 kV and 25 mA. X-Ray photoelectron spectroscopy (XPS) was carried out on a Thermo Scientific K-Alpha X-ray photoelectron spectrometer system (Thermo Fisher, Waltham, Massachusetts). Temperature programmed reduction (TPR) and the Cu surface area were carried out on a Micromeritics Autochem HP 2950 apparatus (Micromeritics, Norcross, Georgia), and the detailed methodology was presented in the paper.Reference Duan, Yang, Singh, Chiang, Wang, Xiao, Patel, Danaci, Burke and Zhai18 The morphology of the catalysts was investigated on a JEOL 7001F FEG scanning electron microscope (SEM; JEOL, Tokyo, Japan) operating at 15 kV and a Philips CM20 transmission electron microscope (TEM; Philips, Amsterdam, the Netherlands) at an accelerating voltage of 200 kV. Thermal decomposition in O2 was conducted on a Mettler Toledo TGA/SDTA851 analyser (Mettler Toledo, Melbourne, Australia).
C. Catalytic performance test
Measurements of methanol synthesis activity were conducted according to our previous work.Reference Duan, Yang, Singh, Chiang, Wang, Xiao, Patel, Danaci, Burke and Zhai18 1 g of fresh catalyst was reduced in flowing dilute hydrogen (5% H2 in Ar) at 543 K for 2 h. Then methanol synthesis activity was measured at 40 bar and 533 K with the GHSV = 3600 h−1. The reactant gas was composed of 25% CO2 and 75% H2. Concentrations of the products were analyzed using an online refinery gas analyzer (RGA, Clarus 580 GC, PerkinElmer Inc.) after collecting methanol and water by cooling the product to 274 K. Then the methanol concentration of the collected product was determined by a ThermoFisher Nuclear Magnetic Resonance. Turnover frequency for methanol was calculated from the mole number of produced methanol per hour divided by the Cu mole number contained in 1 g of the catalyst. Methanol synthesis activity was determined when the reaction reached steady state which is 3 h after switching to the reactant gas.
III. RESULTS AND DISCUSSION
A. N2-physisorption analysis
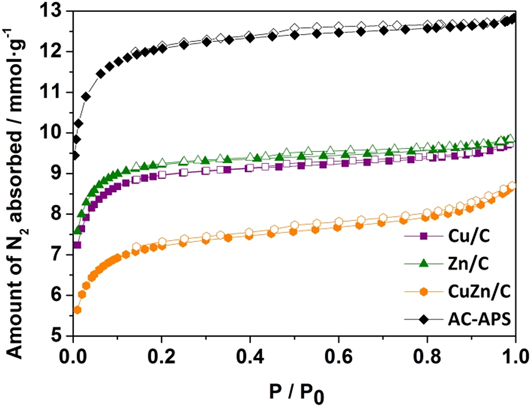
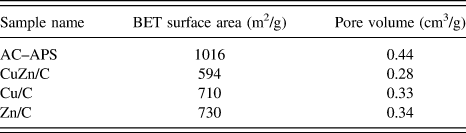
The nitrogen adsorption isotherms of the support and the catalysts are shown in Fig. 1. And the BET surface area and the porous structure of the support and catalysts are summarized in Table I. All four samples gave typical type IV isotherms and H2 hysteresis loop, suggesting the presence of a cage-like mesoporous system.Reference Macina, Piwowarska, Tarach, Góra-Marek, Ryczkowski and Chmielarz26 The support AC–APS had a BET surface area of 1016 m2/g and a pore volume of 0.44 cm3/g. Catalyst CuZn/C had a BET surface area of 594 m2/g and a pore volume of 0.28 cm3/g which decreased by 42 and 36% compared to the support. And catalyst Cu/C had a BET surface area of 710 m2/g and a pore volume of 0.33 cm3/g which decreased by 30% and 25%, respectively. For catalyst Zn/C, it had a BET surface area of 730 m2/g and a pore volume of 0.34 cm3/g which decreased by 28% and 23%, respectively. The BET surface area and the pore volume of all the catalysts decreased after metal loading which could be ascribed to the metals take up the space in the support, partially blocked by the pore and the density differences between the support and metals.
N2 adsorption and desorption isotherms of fresh catalysts and support at 77 K (closed makers represent adsorption data and open markers represent desorption data).

Surface area and pore volumes of support and fresh catalysts.

B. Phase analysis
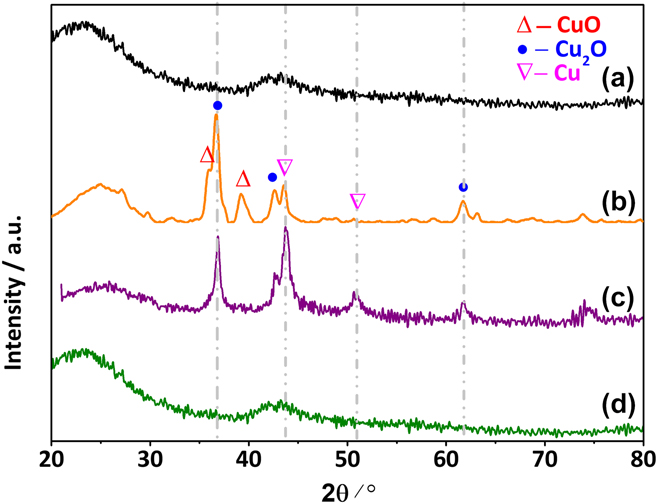
The XRD spectra of the support and the fresh catalysts are presented in Fig. 2. Figure 2(a) shows two broad peaks around 2θ = 23° and 2θ = 43°, which indicate its carbon nature of support AC–APS. For fresh catalyst CuZn/C [Fig. 2(b)], Cu (PDF No. 04-0836), Cu2O (PDF No. 1-1142), and CuOReference Podbršček, Orel and Maček27,Reference Flores, da Costa and da Silva28 (PDF No. 89-5895) could be detected in the catalyst which means that the Cu2+ species was partially reduced to Cu+ and Cu0 during the preparation. The crystal size of Cu2O was 10 nm which was calculated by using the Scherrer equation. The crystal sizes of CuO and Cu could not be determined by using the Scherrer equation because the peaks were too weak. For fresh catalyst Cu/C, Cu2O (PDF No. 1-1142), and Cu (PDF No. 04-0836) could be detected and their crystal sizes were 6 and 5 nm [Fig. 2(c)] determined by the Scherrer equation. No Zinc related peaks were found in all three catalysts [Figs. 2(b)–2(d)], which means that either the zinc species was amorphous or highly dispersed small crystals. Comparing catalyst CuZn/C with catalyst Cu/C, CuO was found in CuZn/C while none CuO was found in Cu/C, which means Zn species helped the Cu reduction by the carbon support during calcination.
XRD spectra of support and fresh catalysts (a) AC–APS; (b) CuZn/C; (c) Cu/C; (d) Zn/C.

C. XPS analysis
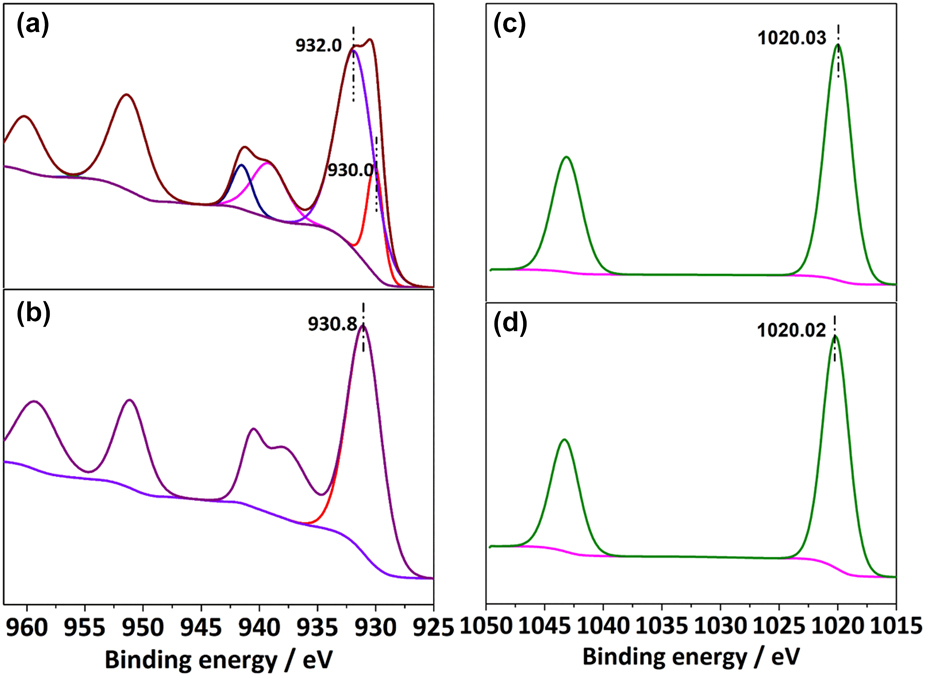
The detailed XPS measurements were performed to investigate the chemical characteristics of the Cu and Zn elements in three catalysts. Figure 3(a) shows the Cu 2p XPS analysis of the fresh catalyst CuZn/C. The peak located at ∼930.0 eV could be assigned to Cu+ or Cu0 species. The higher BE peak at ∼932.0 eV suggested the presence of Cu2+. For catalyst fresh Cu/C [Fig. 3(b)], one peak appeared at ∼930.8 was assigned Cu+ or Cu0 species in the catalyst.Reference Zhang and Wang29,Reference Liu and Hensen30 For fresh catalyst CuZn/C and Zn/C [Figs. 3(c) and 3(d)], two peaks located at 1020.02 and 1043.12 eV were assigned to Zn2+ species in both of the catalysts.Reference Salavati-Niasari, Davar and Khansari31 No Cu–Zn alloy was found in the catalyst CuZn/C which was not consistent with the previous research results.Reference Choi, Futagami, Fujitani and Nakamura8
XPS spectra of Cu 2p of fresh catalysts (a) CuZn/C; (b) Cu/C; XPS spectra of Zn 2p of fresh catalysts (c) CuZn/C; (d) Zn/C.

The XPS results were in agreement with the XRD results. For fresh catalyst CuZn/C, Cu, Cu2O, and CuO were found from the XRD results while Cu2+ and Cu+/Cu0 were detected from the XPS results. For catalyst Cu/C, Cu2O, and Cu were found from the XRD results while Cu+/Cu0 were detected by XPS results. A similar phenomenon could be seen from XPS results as from the XRD results, confirming that Zn species could affect the Cu species reduction. This is one role of ZnO in the catalyst CuZn/C. Only Zn2+ was found on the CuZn/C and Cu/C indicating that no Cu–Zn formation for both catalysts. Our research results are in agreement with Topsøe’sReference Grunwaldt, Molenbroek, Topsøe, Topsøe and Clausen32 conclusions about the mechanisms of the CuZn catalysts. They reported that with the existence of ZnO, the morphology of Cu particles turned out to be more disk-like due to the wetting/non-wetting phenomena at the interface of Cu and ZnO. We thus consider that in industrial catalysts, the morphology effect of ZnO is responsible for the promotion of methanol synthesis activity from CO2 and H2.
D. Surface morphology
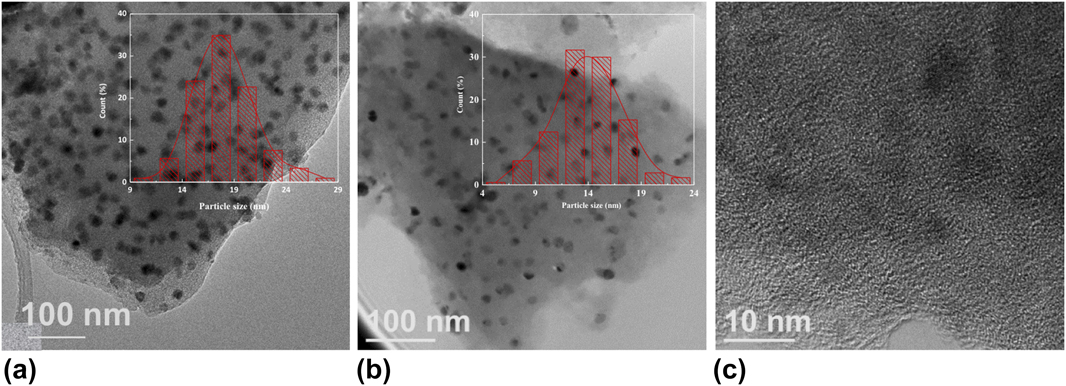
The TEM pictures of the three catalysts are shown in Fig. 4. More than 20 pictures were taken for each catalyst and the representative ones are shown. For fresh catalyst CuZn/C [Fig. 4(a)], the metal particles with a particle size of about 18 nm were uniformly distributed on the support. The metal distribution of fresh catalyst Cu/C is shown in Fig. 4(b); Cu particles were around 14 nm which was smaller than the particles in catalyst CuZn/C. For fresh catalyst Zn/C, the particles can hardly be recognized even with much higher magnification [Fig. 4(c)], which means Zn was amorphous in fresh catalyst Zn/C. The results showed that Cu was relatively better crystallized while Zn was amorphous in the support which was in good agreement with the XRD results.
TEM pictures and the distributions of the particle sizes of the fresh catalyst (a) CuZn/C; (b) Cu/C; (c) Zn/C; inset: size distributions of nanoparticles.

E. EDX analysis of the target area
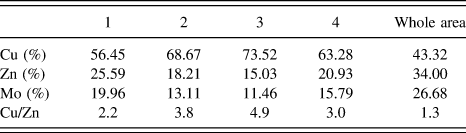
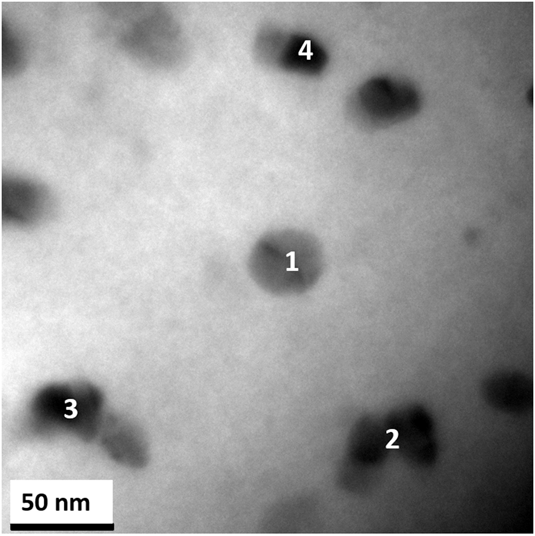
The EDX analysis (Table II) was introduced to investigate the element distribution of Cu and Zn species of the fresh catalyst CuZn/C. The element Mo was from the carbon holder. From the results, area 1–4 in Fig. 5 had a Cu/Zn ratio range from 2.2 to 4.9, which were all greater than the theoretical Cu/Zn ratio 2. This means that the visible particles in the image were Cu species. However, for the whole area, the Cu/Zn ratio was 1.3 which is much less than the theoretical Cu/Zn ratio, which indicated that a visible darker area was likely due to Cu species while Zn species cannot be differentiated from the carbon support by TEM.
EDX analysis of the target area.

TEM image of fresh catalyst CuZn/C.

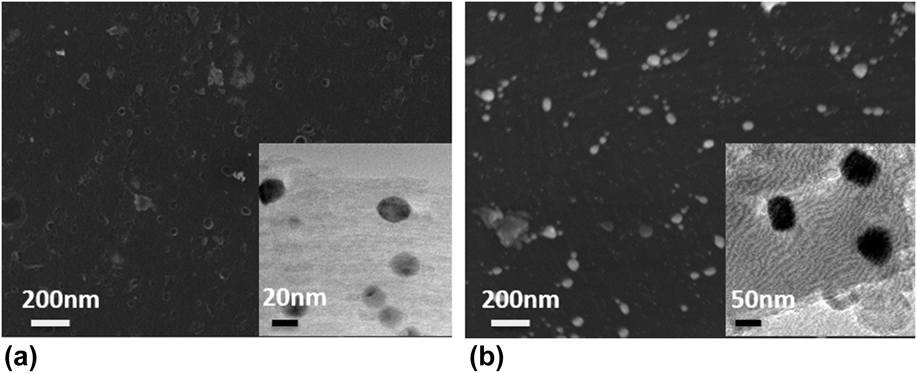
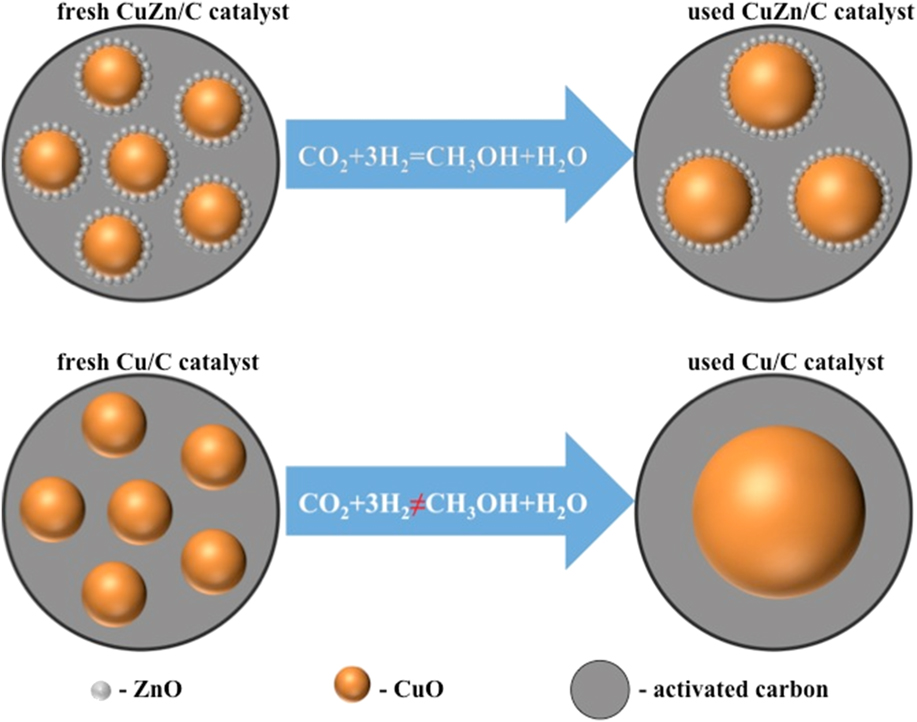
To further address the role of ZnO, we conducted the SEM and TEM characterizations of the used catalysts CuZn/C and Cu/C. The catalysts were collected after 72 h’ test from the fixed-bed rig and ground into powder for the characterization. Figures 6(a) and 6(b) are the representative images of used catalyst CuZn/C and Cu/C, respectively. Used catalyst CuZn/C had no visible particles on the catalyst surface. But from the TEM image [Fig. 6(a) inset], the particles size was in the range of 10–25 nm. On the used catalyst Cu/C surface, there are many visible particles which were around 50–60 nm distributed on the catalyst surface. This was confirmed by the inset TEM image [Fig. 6(b) inset]. It clearly shows that ZnO can retard the sintering of Cu species in the CuZn/C catalyst. The TEM results showed that particle sizes of Cu species were around 10 nm while ZnO species were too small to be identified neither by XRD nor by TEM. ZnO species were much smaller than the Cu species as it was shown in the TEM images. Thus, for catalyst CuZn/C, the ZnO species can act as the spacer and stabilizer, avoiding direct contact of the Cu particles and preventing them from serious sintering.
SEM and TEM images of the used catalysts (a) CuZn/C; (b) Cu/C.

F. Catalytic performance tests
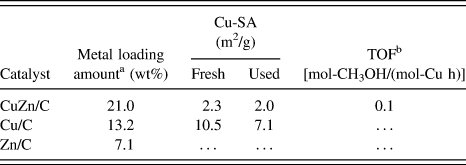
The metal loading amount, Cu surface area and catalytic activity are summarized in Table III. The AC–APS support was tested as the control sample and had no Cu surface area or any activity as it was expected. Catalyst CuZn/C had a metal loading amount of 21.0 wt%, which is in good agreement with the theoretical amount. It also had a Cu surface area of 2.3 m2/g and the mass-time yield per gram of catalyst was 0.1 [mmol-CH3OH/(mol-Cu h)]. The catalyst Cu/C had CuO loading of 13.2 wt% which was also in agreement with the theoretical amount. And the Cu surface area of catalyst Cu/C was 10.5 m2/g. The Cu loading amount in catalyst CuZn/C was the same as that in catalyst Cu/C. The Cu surface areas were significantly different in these two catalysts. The Cu surface area of catalyst Cu/C was 4 times higher than that of catalyst CuZn/C. It was worth noting that although catalyst Cu/C had much more Cu surface area, it had no activity at all. Catalyst Zn/C loaded with 7.1 wt% ZnO also had no methanol activity. The Cu surface area was decreased by 13% in the used catalyst CuZn/C compared with the fresh catalyst. At the same time, the Cu surface area was decreased by 32% in the used catalyst Cu/C comparing with the fresh catalyst Cu/C. This indicated that the Cu crystallite in catalyst Cu/C sintered more severely than that in the catalyst CuZn/C as shown in Fig. 6. Comparing these three catalysts, only Cu or Zn supported on activated carbon was not an effect catalyst. ZnO played a critical role in slowing down the Cu particles sintering and promoting the methanol activity of Cu particles.
Metal loading amount, Cu surface area, and catalytic activity of the fresh catalysts.

a Obtained from TGA tests.
b Turnover frequency for methanol.
The active center was Cu and Zn heterojunction on the CuZn/C. The scheme of this process is shown in Fig. 7. Cu species on the Cu/C catalyst were not active for CO2 hydrogenation. For CO2 hydrogenation, many researchers have reported that the active species is not Cu+ but Cu0 based on the well-known linear relationship between the activity and the Cu surface area.Reference Chinchen, Waugh and Whan33,Reference Rasmussen, Kazuta and Chorkendorff34 Our results were different from their conclusions. Fresh catalyst Cu/C had a Cu surface of 10.5 m2/g which is much higher than that of fresh catalyst CuZn/C but showed no methanol activity at all. We can deduce that Cu–Zn interaction plays a more important role in hydrogenation to methanol than Cu surface area. ZnO played a more important role than just a spacer between the Cu particles. The morphology effect can explain the mechanism well as shown in Fig. 7.
Schematic representation of the catalysts sintering.

Cu also sintered severely after the catalytic performance test. CuZn/C was active for CO2 hydrogenation reaction; Cu species grew slightly bigger than the fresh CuZn/C catalyst according to the SEM and TEM images (Fig. 6). The catalytic performance of the catalysts showed that ZnO played an important role in CO2 hydrogenation to methanol.
IV. CONCLUSIONS
In summary, when CuO and ZnO were loaded together on the support AC–APS, the resulting catalyst CuZn/C was active for methanol formation. The catalyst has a TOF of 0.1 [mol-CH3OH/(mol-Cu h)], while the catalyst Cu/C and Zn/C had no activity. The particle size of the Cu species was around 14–18 nm. And Zn species were two small to be identified. The role of ZnO is affecting the reduction of Cu species, slowing down the sintering of Cu particles and morphology effect. Nevertheless, more research is needed to improve the catalytic performance of the catalyst.
ACKNOWLEDGMENTS
We kindly thank Dr. Deepa Dumbre for XPS measurements. HD is grateful for financial support provided by the National Science Foundation of China, Project Nos. 51704048 and 51674052.