I. INTRODUCTION
Recent advances in biological and biomedical research are pushing the scientific community toward the development of new techniques to visualize cellular compartments and structures and to investigate cellular processes.Reference Probst, Dembski, Milde and Rupp1 One of the main techniques used in cell biology is fluorescence labeling; progress in this field is, however, limited by some inherent characteristics of currently used organic dyes, like the tendency to photooxidation and blinking.Reference Wang, Tan, Zhang, Fan and Wang2 More recently, semiconductor nanocrystals (the so-called quantum dots, QD) were largely investigated as biomarkers being more robust toward photobleaching than organic fluorophores and offering size-controllable tunability of the emission wave lengths for multicolor labeling.Reference Klostranec and Chen3, Reference Parak, Pellegrino and Plank4 Unfortunately, the most popular II–IV QDs, like CdS and CdSe, contain toxic elements that hamper their application in biology and medicine.Reference Derfus, Chan and Bathia5Among the materials that could overcome this limitation, luminescent Si nanocrystals (Si-nc) appear as the ideal candidates (especially for in vivo bioimaging) being inert, nontoxic, and apt to surface chemical functionalization and bioconjugation. Moreover, Si is abundant in nature, economical, and widely investigated for a large variety of other applications ranging from photonics to photovoltaics and optoelectronics.Reference Pavesi and Turan6
Unlike bulk Si, which is not a good light emitter, nanostructured Si can emit photons in the visible near-infrared range with reasonable efficiency. Such photoluminescence (PL) emission was first observed in porous SiReference Canham7, Reference Prokes, Carlos and Glembocki8 and later both in Si-nc embedded in a dielectric host (mainly, silica)Reference Prakash, Daldosso, Degoli, Iacona, Cazzanelli, Gaburro, Pacifici, Priolo, Arcangeli, Filonov, Ossicini and Pavesi9, Reference Walters, Kalkman, Polman, Atwater and de Dood10 and in Si nanoparticles (either dryReference Huisken, Ledoux, Guillois and Reynaud11–Reference Lacour, Guillois, Portier, Perez, Herlin and Reynaud13 or as colloidal solutionsReference Belomoin, Therrien and Nayfeh14–Reference Choi, Wang and Reipa17). To exploit this luminescent emission for biomedical applications, Si-nc should remain highly luminescent and well dispersed in water and biological fluids over a wide range of pH and salt concentrations. However, preparing macroscopic amounts of nonagglomerated Si-nc with stable and intense PL emission and good dispersibility in water has proven to be a very difficult task. In fact, Si-nc that are not properly terminated are highly soluble only in nonpolar solvents that are toxic.Reference Veinot, Pavesi and Turan18 In the past years, several surface modification procedures were proposed and successfully developed to make hydrophilic Si-nc surfaces, as, e.g., acrylic acidReference Wang, Ni, Pietzsch, Hennies, Bao and Chao19, Reference Li and Ruckenstein20 or allylamine capping,Reference Warner, Hoshino, Yamamoto and Tilley21 polymer coating and micelle encapsulation.Reference Erogbogbo, Yong, Roy, Xu, Prasad and Swihart22 A further obstacle to applying Si-nc in bioimaging is the poor pH stability and the possible degradation of the optical properties of acrylic acid or allylamine-capped Si-nc in biological fluids leading to severe difficulties in their bioconjugation with antibodies, as discussed in Refs. Reference Erogbogbo, Yong, Roy, Xu, Prasad and Swihart22 and Reference He, Zhong, Peng, Wei, Su, Lu, Su, Gu, Liao and Lee23. On the other hand, polymer-coated and/or micelle-encapsulated Si-nc show a more robust pH stability and a reduced tendency to degradation of the optical properties in biological fluids,Reference Erogbogbo, Yong, Roy, Xu, Prasad and Swihart22 but their increased size precludes bioapplications where nanoparticles with hydrodynamic radius lower than 10 nm are requested. Two main classes of luminescent Si-nc have been identified and proposed for biomedical applications, namely, orange near-infrared (NIR) emitting nanoparticles with long luminescence decay times (several tens of microseconds), usually produced by surface oxidation of nanostructured silicon,Reference Huisken, Ledoux, Guillois and Reynaud11–Reference Lacour, Guillois, Portier, Perez, Herlin and Reynaud13, Reference Li, He, Talukdar and Swihart15 and blue-emitting nanoparticles with fast (tens of nanoseconds) luminescence decay times.Reference Belomoin, Therrien and Nayfeh14 These latter nanoparticles can have various surface terminations but are mostly terminated with hydrogen. Interface to biological system is then provided by further functional groups attached to the surface bonds, thus permitting a number of interesting in vitro applications reviewed in Refs. Reference Veinot, Pavesi and Turan18 and Reference Borsella, Falconieri, Herlin, Loschenov, Miserocchi, Nie, Rivolta, Ryabova, Wang, Pavesi and Turan24. As an example, Warner et al.Reference Warner, Hoshino, Yamamoto and Tilley21 prepared water-soluble Si quantum dots by covalently capping allylamine on the nanoparticles (NPs) via hydrosilylation, catalyzed by platinum. The so-obtained highly blue-luminescent Si-NPs were used for bioimaging HeLa cells. On the other hand, slow emitting Si-nc are more suitable for real-time tracking and monitoring of biological events at the cellular level. The PL emission in the red IR range is highly desirable for in vivo imaging because of the low tissue absorption and scattering effects in this spectral range.Reference Wang, Tan, Zhang, Fan and Wang2 Moreover, two- and three-photon excited luminescence covering the same spectral interval was recently observed after femtosecond laser excitation of Si-nc at 900, 778, and 1335 nm, respectively.Reference He, Zheng, Yong, Erogbogbo, Swihart and Prasad25, Reference Falconieri, D’Amato, Fabbri, Carpanese and Borsella26 One further advantage offered by the use of slow red-emitting Si-nc is the possibility to eliminate the fast (few nanoseconds) skin autofluorescence as well as the luminescence emitted by most of the bioorganic materials by the use of time-resolved detection techniques.Reference Borsella, Falconieri, Herlin, Loschenov, Miserocchi, Nie, Rivolta, Ryabova, Wang, Pavesi and Turan24 Recently, biocompatible Si-nc encapsulated in phospholipid–poly(ethylene glycol) micelles were successfully used for imaging in multiple cancer-related in vivo applications, including tumor vasculature targeting, sentinel lymph node mapping, and multicolor NIR imaging in live mice.Reference Erogbogbo, Yong, Roy, Hu, Law, Zhao, Ding, Wu, Kumar, Swihart and Prasad27In this experiment, PL emission from Si-nc at different spots in the tissues was easily separated from the autofluorescence.
Although both types of red NIR and blue-emitting Si-nc have shown a great potential for use in biological imaging,Reference Wang, Ni, Pietzsch, Hennies, Bao and Chao19–Reference Erogbogbo, Yong, Roy, Xu, Prasad and Swihart22, Reference Borsella, Falconieri, Herlin, Loschenov, Miserocchi, Nie, Rivolta, Ryabova, Wang, Pavesi and Turan24, Reference Erogbogbo, Yong, Roy, Hu, Law, Zhao, Ding, Wu, Kumar, Swihart and Prasad27–Reference Tu, Xuchu, Pantazis, Kauzlarich and Louie29 efforts are still needed to further improve their performances. A real control of the PL emission spectrum of Si-nc is not yet reached, and results on the optical properties are often dependent on the sample surface modifications.Reference Veinot, Pavesi and Turan18, Reference Erogbogbo, Tien, Chang, Yong, Law, Ding, Roy, Swihart and Prasad28, Reference Pi, Mangolini, Campbell and Kortshagen30–Reference Clark, Dang and Veinot32 Some tunability of the PL emission from Si-nc was indeed reported in recent papers,Reference Li, He, Talukdar and Swihart15, Reference Pi, Mangolini, Campbell and Kortshagen30, Reference Sato and Swihart33 but a quantitative and reproducible relationship between the PL emission peak and the Si-nc size has not been demonstrated. On the other hand, change in the spectral response was observed after surface functionalization of Si-nc having the same size (2.8 ± 0.1 nm) with carboxylic acids of varying carbon chain lengths.Reference Clark, Dang and Veinot32This trend was associated with a change in the oxidation state of Si-nc but not explained. The full comprehension of the mechanism of PL emission is indeed an open question.
Since almost two decades, it is debated whether the light emission is originated by recombination of electrons and holes in Si nanostructures (band-to-band transitions in quantum-confined systems)Reference Pi, Mangolini, Campbell and Kortshagen30 or by defects located at the surface.Reference Prokes, Carlos and Glembocki8, Reference Delarue, Allan and Lannoo34, Reference Wolkin, Jorne, Fauchet, Allan and Delarue35 The mechanism based on quantum-confined carrier recombination is impaired by the discrepancy observed between the experimental and theoretical determination of the energy gap versus the Si-nc diameter.Reference Pudzer, Williamson, Grossman and Galli36 On the other hand, the similarities observed by Glinka et al.Reference Glinka, Lin, Hwang and Chen37, Reference Glinka, Zyubin, Mobel, Lin, Hwang and Chen38 between the PL properties of mesoporous silica and those of surface-oxidized Si-nc and porous silicon sustain the defective origin of the PL. It was suggested that the observed PL red bands (in the 590–1040 nm range) originate from defects related to nonbridging oxygens, while green bands and blue bands were ascribed to hydrogen-related species and to water–carbonyl groups, respectively.Reference Glinka, Zyubin, Mobel, Lin, Hwang and Chen38 Recently, new experiments were published, based on measurements in high magnetic fields, further supporting the theory that defects are the dominant source of light from Si-nc.Reference Godefroo, Hayne, Jivanescu, Stesmans, Zacharias, Lebedev, Van Tendeloo and Moshchalkov39 Here, we report results in agreement with the hypothesis that red near-IR PL emission in Si-nc is initiated by quantum-confined carrier interband excitation followed by relaxation to the interface oxide-related [namely, nonbridging oxygen hole centers (NBOHC)] defect states. Changes in bond angle and bond length in the emitting center, as well as variation of the chemical environment, influence the defect energy and strongly affect the spectral emission of the system.Reference Glinka, Lin, Hwang and Chen37, Reference Glinka, Zyubin, Mobel, Lin, Hwang and Chen38 This could explain why the complex surface functionalization steps performed to disperse and stabilize the nanoparticles may significantly alter their spectroscopic properties often leading to reduction of the PL intensityReference Tu, Xuchu, Pantazis, Kauzlarich and Louie29and/or to a shift of the PL emission spectral range.Reference Erogbogbo, Tien, Chang, Yong, Law, Ding, Roy, Swihart and Prasad28, Reference Vincent, Maurice, Paquez, Sublemontier, Laconte, Guillois, Reynaud, Herlin-Boime, Raccurt and Tardif31–Reference Sato and Swihart33, Reference Choi, Wang and Reipa40
Withstanding the above-mentioned difficulties to fully exploit the Si-nc luminescence for bioimaging, further progress in the field could be achieved by use of this material as the base of an engineered fluorophore, whenever a suitable functionalization is used. In fact, Si-nc can be exploited as antennas to absorb excitation light and successively transfer the energy to a coupled emitter suitably placed nearby the nanocrystal, therefore, acting as a sensitizer-acceptor couple. As a matter of facts, in host matrices such as silica, Si-nc have been shown to efficiently sensitize rare-earth ionsReference Fujii, Yoshida, Kanzawa, Hayashi and Yamamoto41, Reference Priolo, Franzò, Pacifici, Vinciguerra, Iacona and Irrera42 for applications in photonics because of fast energy transfer to nearby ions. Rare-earth doping of Si-based materials was also proposed for obtaining specific emission energies in lighting applications.Reference Roschuk, Li, Wojcik, Mascher, Calder, Pavesi and Turan43 A key characteristic of Si-nc for such applications is the relatively high and wide-band absorption cross section in the visible,Reference Kovalev, Heckler, Polisski and Koch44 which permits broadband excitation of the coupled fluorophore with inexpensive light sources. Moreover, energetic considerations show that Si-nc with dimension in the range 5–10 nm can preferably excite NIR-emitting fluorophores, which provide in-depth probing capabilities in biological specimens, because of reduced scattering, self-absorption, and background fluorescence.Reference Klostranec and Chen3We have therefore investigated this scheme using a NIR-emitting rare-earth ion coupled to the Si-nc, avoiding organic emitters because of their known stability and photobleaching problems.
Although Si is a nontoxic material, a major concern that might restrict the application of Si nanoparticles in medicine arises from the potential harm that could derive from their reduced size.Reference Borsella, Falconieri, Herlin, Loschenov, Miserocchi, Nie, Rivolta, Ryabova, Wang, Pavesi and Turan24In this respect, here, we report two standard in vitro assays performed on cells exposed for different times and at different concentrations to Si-nc. The lactate dehydrogenase (LDH) leakage assay assesses the integrity of the plasma membrane, and the 3-(4,5-dimethylthiazol-2-yl)-2,5-diphenyltetrazolium bromide (MTT) assay tests the ability of the mitochondria to convert the MTT into formazan. Both are considered an index of viability. If, on one hand, the plasma membrane represents the first element of the cells to encounter nanoparticles, on the other hand, this interaction may potentially induce a local deformation of the membrane and alter its mechanical properties, thus inducing a signaling transduction response. As far as the MTT assay is concerned, any measurements of alteration in the mitochondrial respiratory activity, in this case represented by the succinate dehydrogenase enzyme, would entail a reduction on the adenosine triphosphate production. Thus, we propose here a quantitative analysis of the stress of the plasma membrane and of the mitochondrial activity of two representative cell lines, commonly used for biocompatibility testing.
Finally, a critical insight into the possible future developments in the exploitation of Si-based nanoparticles for bioimaging will be given.
II. OPTICAL PROPERTIES OF AS-PREPARED AND OXIDIZED Si-nc
As anticipated in the Sec. I, the origin of the PL emission from Si-nc has been discussed for years: the controversy has focused on whether the photons arise from localized defect statesReference Prokes, Carlos and Glembocki8, Reference Godefroo, Hayne, Jivanescu, Stesmans, Zacharias, Lebedev, Van Tendeloo and Moshchalkov39 or the emission is ruled by the quantum confinement (QC) effect.Reference Delarue, Allan and Lannoo34, Reference Godefroo, Hayne, Jivanescu, Stesmans, Zacharias, Lebedev, Van Tendeloo and Moshchalkov39 There is now a general consensus on the possibility that both defect-mediated and e–h quantum-confined recombination mechanisms play a role,Reference Wolkin, Jorne, Fauchet, Allan and Delarue35 but a universally accepted model for the origin of the PL emission in Si-nc is still lacking.Reference Goesele45 In general, all the studies are carried out on materials fabricated by very different methods, and consequently, comparison of published results is not unambiguous. To overcome this kind of uncertainties in assessing the role of oxide states in the PL emission, here, we compare the spectroscopic properties of the same batch of crystalline Si nanoparticles, as prepared by laser pyrolysisReference D’Amato, Falconieri, Fabbri, Bello and Borsella12and after complete conversion to amorphous silica by alkali etching-assisted oxidation procedure.Reference Borsella, Falconieri, Herlin, Loschenov, Miserocchi, Nie, Rivolta, Ryabova, Wang, Pavesi and Turan24, Reference Borsella, D’Amato, Fabbri, Falconieri, Trave, Bello, Mattei, Nie and Wang46
Si nanoparticles have been synthesized by CO2 laser-driven pyrolysis process in a continuous gas-flow reactor using silane (SiH4) as gas precursor. The experimental setup and the procedures for laser synthesis of Si-nc with variable size are described in detail elsewhere.Reference D’Amato, Falconieri, Fabbri, Bello and Borsella12 Briefly, silane is heated by resonant absorption of CO2laser photons (at about 10 μm) in a small well-defined irradiation volume up to molecular dissociation, followed by growth of Si nanoparticles in a very short time (few milliseconds) by coagulation and coalescence of reactive radicals. The growth is abruptly terminated as soon as the particles leave the irradiation region, leading to an average particle size in the nanometer scale (5–15 nm) and a narrow size distribution. The final particle size can be controlled acting on the process parameters (i.e., total pressure, gas flow rates, etc.) to change the residence time of the particles in the reaction zone.
The as-prepared Si nanoparticles emit in the range 550–950 nm under excitation at wave lengths below 500 nm. The luminescence excitation cross section of Si-nc obtained by laser pyrolysis were previously measured with Ar laser excitation at 488 nm, using the luminescence rise time method,Reference Borsella, D’Amato, Fabbri, Falconieri, Trave, Bello, Mattei, Nie and Wang46 giving values in the range of 1.5 ÷ 8 × 10⁻¹⁶ cm2. Typical PL emission quantum yield was estimated to be of the order of 1% by use of a procedure based on a dye standard (rhodamine 6G).
The nanoparticles synthesized for the present study are composed by Si-nc with diameter d = 5.6 nm, narrow size distribution, and capped by a thin oxide layer (≤1 nm), as determined by high-resolution transmission electron microscope (HR-TEM) analysis. A stable suspension of Si-nc in methanol is obtained by high power ultrasonic treatment. The liquid is opaque and brown yellowish in color. A second sample is prepared by submitting the Si nanoparticles to a strong alkali etching procedure, stopped by addition of H2O. The complete oxidation of the sample is evidenced by the compositional analysis giving an atomic ratio O(k)/Si(k) = 1.9 on different portions of the sample and by the HR-TEM analysis confirming the formation of amorphous nanoparticles of few nanometer size. The suspension of amorphous silica nanoparticles (SiO2-np) in water is colorless.
Room temperature continuous wave (CW) photoluminescence emission and excitation (PLE) spectra measurements were performed using a HORIBA-Jobin-Yvon Fluorolog 3-22 spectrofluorometer (HORIBA Instruments Incorporated, Edison, NJ). Excitation spectra were collected from diluted samples placed in a thin (0.1 cm) cuvette to fulfill the optically thin sample condition.
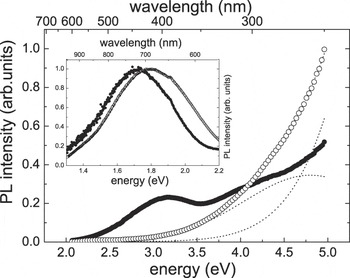
Both the Si-nc and the SiO2-np samples show very similar broad PL spectra in the range 550–950 nm under excitation at 355 nm (Fig. 1, inset), the only difference being a small blueshift of the oxidized sample with respect to the Si-nc sample. On the other hand, the difference in material composition and electronic structure of the two samples is quite evident in the PLE spectra reported in Fig. 1. In the limit of optically thin sample, the PLE signals are proportional to the absorption and can be interpreted on the basis of the expected spectral dependence of the absorption coefficient α of the two different materials.
CW PL excitation and emission spectra (inset) of Si-nc (filled circles) and SiO2-np samples (empty circles). Dotted lines show the decomposition of PLE spectrum of SiO2-np sample in two Gaussians as described in the text.

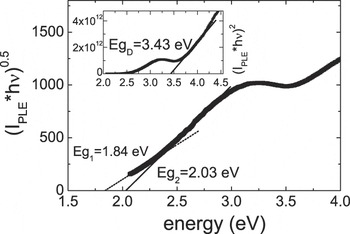
In the case of Si-nc, at low excitation energies ≤2.3 eV, the PLE signal (αPLE) follows the behavior of indirect transitions.Reference Kovalev, Heckler, Polisski and Koch44, Reference Ben-Chorin, Averboukh, Kovalev, Polisski and Koch47
 $$<![CDATA[$$({\rm{\alpha }}_{{\rm{PLE}}} \hbar {\rm{\omega }})^{0.5} \, = \,A_1 (\,\hbar {\rm{\omega }} - E_{g1} )\quad.$$
The Eg 1 gap extrapolated by fitting with the formula [Eq. (1)], the experimental curve of Fig. 2 is ∼1.84 eV, in relatively good accordance with the value of 1.9 eV reported by KovalevReference Kovalev, Heckler, Polisski and Koch44 and Ben-Chorin et al.Reference Ben-Chorin, Averboukh, Kovalev, Polisski and Koch47 These authors associate the Eg 1 gap with the Γ25′,V –Δ1,C transition in Si. Above 2.3 eV, a deviation from Eq. (1)is observed. The extra absorption in this energy region follows a similar dependence:
 $$<![CDATA[$$({\rm{\alpha }}_{{\rm{PLE}}} \hbar {\rm{\omega }})^{0.5} \, = \,A_2 (\hbar {\rm{\omega }} - E_{g2} )\quad,$$
CW PL excitation spectrum of Si-nc (filled circles) and analysis showing the two indirect band gaps and the direct band gap (inset).

but with a different energy gap Eg 2, which results to be 2.03 eV (whereas a value of 2.5 eV is found in Refs. Reference Kovalev, Heckler, Polisski and Koch44 and Reference Ben-Chorin, Averboukh, Kovalev, Polisski and Koch47). As expected from the QC theory, this value is blueshifted with respect to 1.6 eV value found for crystalline bulk Si and attributed to the Γ25′,V –L1,Ctransition.Reference Kovalev, Heckler, Polisski and Koch44, Reference Ben-Chorin, Averboukh, Kovalev, Polisski and Koch47
At ħω ≥ 3.2 eV, there is a further change in the slope, due to the occurrence of direct transitions.Reference Kovalev, Heckler, Polisski and Koch44, Reference Ben-Chorin, Averboukh, Kovalev, Polisski and Koch47The analysis of PLE data shows that the absorption of Si-nc has a similar dependence to that of bulk Si. In conclusion, the main effect of QC seems to be the blueshifting of transitions associated with different critical points of the band structure.
On the other hand, the PLE spectrum of the oxidized amorphous sample (SiO2-np) is totally different from that of the nanocrystalline Si-nc sample (see Fig. 1). A tentative interpretation is based on the comparison with absorption features observed in similar systems. It is well known that silica is an insulator with a band gap of about 11 eV; however, PL emission from defects and impurities in silica can be induced by ultraviolet (UV)–visible light absorption.Reference Skuja48, Reference Munekuni, Yamanaka, Shimogaichi, Tohmon, Ohki, Nagasawa and Hama49 In particular, an emission band peaked at 652.6 nm (1.9 eV) is observed after absorption at about 2.0, 4.8, and 7.6 eV in defective silica.Reference Skuja48, Reference Munekuni, Yamanaka, Shimogaichi, Tohmon, Ohki, Nagasawa and Hama49 The absorption at 4.8 eV is attributed to a transition from the σ bonding orbital to the 2p nonbonding orbital of nonbridging oxygens in defects commonly labeled as NBOHC. The NBOHC is an under-coordinated oxygen with a hole in its nonbonding 2p orbital.Reference Skuja48, Reference Munekuni, Yamanaka, Shimogaichi, Tohmon, Ohki, Nagasawa and Hama49 The resulting red PL emission (R-band) is due to the charge transfer transition between the nonbonding 2p orbital of the nonbridging oxygen and the lone pair 2p orbital of one of the nearest bridging oxygens.Reference Skuja48 More recently, a broad red NIR PL emission band from mesoporous silica was detected in the range 600–1040 nm under excitation at about 4.7, 3.5, and 2.3 eV.Reference Glinka, Lin, Hwang and Chen37, Reference Glinka, Zyubin, Mobel, Lin, Hwang and Chen38, Reference Zyubin, Glinka, Mebel, Lin, Hwang and Chen50 Mesoporous silica is characterized by pores with sizes in the range 2–10 nm and the thickness of walls among pores is ∼1 nm, which is of the same range of the oxide layer around Si-nc.Reference D’Amato, Falconieri, Fabbri, Bello and Borsella12The PLE spectrum of the oxidized sample was compatible with the presence of two broad Gaussian absorption bands: the first centered at about 4.8 eV and the second at much higher energy, located beyond our accessible energy range. Therefore, the PLE data reasonably confirm the defective silica composition of this sample.
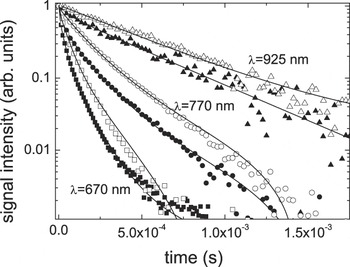
The strong similarity of the luminescence emissions of the two materials is also observed in the luminescence time decay data detected in the whole 550–950 nm range under excitation with a frequency-tripled pulsed Nd-YAG laser emitting at 355 nm. To facilitate the comparison, data taken at some selected emission wave lengths on both samples are reported in Fig. 3. It is fairly evident that the decay curves are not single exponentials and show increasingly fast decay at shorter detection wave lengths. Having assumed that the PL emission of the oxidized sample comes from defects in amorphous silica, its time decay can be described by a sum of single exponential terms, each one representing the emission from a specific radiative defect. In particular, we fitted the experimental data using a function of the form:
 $$<![CDATA[$$I({\rm{\lambda }},t)\, = \,\mathop\sum\limits_i {A_i ({\rm{\lambda }})\exp ( - t/{\rm{\tau }}_i )\, + \,y_0 ({\rm{\lambda }})\quad,} $$
Luminescence time decay curves of Si-nc (filled symbols) and of fully oxidized (empty symbols) samples at some selected emission wave lengths (squares: λ = 670 nm, circles: λ = 770 nm, triangles: λ = 925 nm). Continuous lines represent the theoretical fits as described in the text.

where the  $A_i ({\rm{\lambda }})$ coefficients represent the spectral distribution of the emission of the ith defect center, with decay time τi.
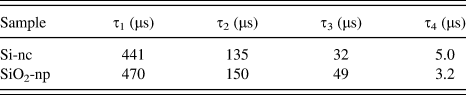
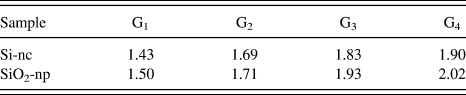
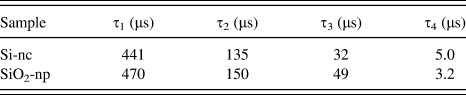
The set of time decay data of the oxidized sample was fitted with the function I(λ,t) [Eq. (3)], adding progressively more exponential terms until the χ2 factor of the fit was satisfactory. It was found that four exponential terms are necessary and sufficient to obtain a good fit of the set of decay curves of the oxidized sample, as shown in Fig. 3. The values of the time constants obtained from the fit are reported in Table I. The strong similarity of the spectral and time dependence of the PL emission from both the Si-nc and oxidized samples (see Figs. 1 and 3) led us to hypothesize that also in the former sample, the emission can be due to radiative defects. Therefore, the same fitting procedure based on Eq. (3) was used to find the necessary number of exponential terms to fit the decay times. As shown in Fig. 3, also for Si-nc, the sum of four exponential terms is adequate to reproduce the experimental time decays. The time constants are reported in Table I.
Time constants obtained from the multiexponential fitting of the PL time decay data of Si-nc and SiO2-np samples.
It should be noted that luminescence time decays from Si-nc are usually analyzed in terms of the stretched exponential function,Reference Pavesi and Ceschini51 even in systems where this model is not fully justified. On the other hand, multiexponential analysis of PL decay curves from Si-nc produced by Si implantation in silica was also adopted in Ref. Reference Jayatilleka, Diamare, Wojdak, Kenyon, Mokry, Simpson, Knights, Crowe and Halsall52, but the exponential terms were attributed to emission from different nanocrystal classes. In that paper, three time constants were determined, whose values, 220, 75, and 50 μs, compare relatively well with ours, considering the very different material examined.
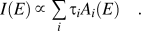
The time constants reported in Table I are remarkably similar for both samples confirming our hypothesis that the same emitting centers are present in both systems. To get further insight into the physical meaning of our proposed analysis, it must be recalled that the  $A_i ({\rm{\lambda }})$ coefficients in Eq. (3) represent the spectral distribution of the emission of the ith center. It should then be possible to reproduce the CW PL emission spectra shown in the inset of Fig. 1by use of the following formula:
 $$<![CDATA[$$I(E)\, \propto\, \mathop\sum\limits_i {{\rm{\tau }}_i A_i (E)\quad.} $$
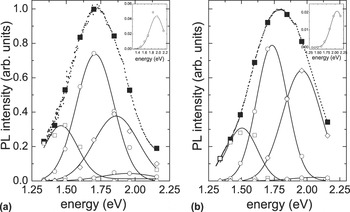
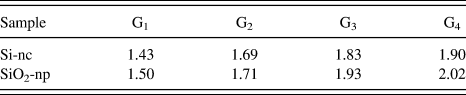
To this purpose, after conversion to the energy scale, the Ai(E) coefficients were fitted with Gaussian functions as appropriate for inhomogeneously broadened emitters. The center energies of the four Gaussians are reported in Table IIfor both samples.
Center energies (in eV) of the Gaussian functions that best fit the energy dependence of the Ai coefficients.
After having been multiplied by the corresponding τi and a normalization factor, both the coefficients Ai(E) and the Gaussian fits have been reported in Fig. 4together with the CW PL emission spectra of both the samples.
Amplitudes of the single exponential components as derived from analysis of PL decay curves (empty symbols) and their fits with Gaussian functions (lines), for Si-nc (a) and SiO2-np (b) samples. Insets: close-up of the components peaked at the highest energy for both materials. Also shown are the PL emission spectra of the two samples (dotted lines) and their reconstruction with the sum of the Gaussian components (filled symbols).

The satisfactory reproduction (see Fig. 4) of the PL emission spectra of both samples with four Gaussian functions having slightly shifted centers (Table II) and the similarity of the corresponding decay times (Table I) pushes toward the identification of the same type of emitting centers as responsible for the PL emission in both the Si-nc and the fully oxidized samples. To this purpose, we can rely on the huge amount of literature on the luminescence from defective silica and in particular on the role of the NBOHC centers. PL emission from these defects has been formerly reported to be at the origin of the red luminescence band in the range 1.8–1.9 eV (≈690–650 nm) in bulk silica,Reference Skuja48 while the presence of surface NBOHC centers is responsible for the appearance of two subbands at 1.93 and 1.98 eV. At least, three different types of red-emitting NBOHC were identified by Munekuni et al.Reference Munekuni, Yamanaka, Shimogaichi, Tohmon, Ohki, Nagasawa and Hama49 in silica glass after γ-ray irradiation and were related predominantly to the change in hydride or hydroxyl content. Accordingly, a sample-to-sample variation in the PL band was observed depending on the relative numbers of the different emitting defects. Successively, in nanosized and mesoporous silica, Glinka et al.Reference Glinka, Zyubin, Mobel, Lin, Hwang and Chen38, Reference Zyubin, Glinka, Mebel, Lin, Hwang and Chen50have observed PL bands peaked at 1.90 eV (652.6 nm), 1.78 eV (696. nm), 1.61 eV (770.2 nm), and 1.40 eV (885.7 nm), and smaller contributions at 1.27 eV (976.4 nm) and 1.14 eV (1087.7 nm), with decay times compatible with those observed in our samples. Ab initio modeling has confirmed the strong sensitivity of the energy levels of NBOHC to the atomic surrounding.Reference Zyubin, Glinka, Mebel, Lin, Hwang and Chen50
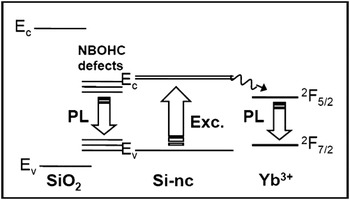
In agreement with data shown in Fig. 1 and with literature data on NBOHC absorption bands,Reference Skuja48, Reference Munekuni, Yamanaka, Shimogaichi, Tohmon, Ohki, Nagasawa and Hama49 excitation of the NBOHC defects in the fully oxidized sample is assumed to proceed via the broad absorption bands at 4.8 and 7.6 eV. On the other hand, in the as-prepared sample, the PLE data clearly show the features of the electronic absorption of Si-nc, as previously discussed and shown in Fig. 2. Therefore, it is quite reasonable to postulate trapping of the photoexcited Si-nc carriers in the luminescent defects. This process can take place via the lowest and weaker NBOHC absorption band at about 2 eV because this energy matches well the energy of relaxed carriers in the Si-nc (see the band gap analysis reported in Fig. 2 and the scheme in Fig. 5). Radiation is then emitted as a consequence of charge transfer from the nonbonding oxygen orbital to the 2p orbital of one of the three other oxygen ligands. As stressed in Ref. Reference Zyubin, Glinka, Mebel, Lin, Hwang and Chen50, both strain and chemistry must be taken into account when predicting the range of the emission energies.
Scheme of the non-radiative deexcitation processes from photoexcited Si-nc either to interface defect states or to nearby rare-earth ions.

III. OPTICAL PROPERTIES OF Yb-DOPED Si-nc
According to the considerations made above, it is clear that light excitation of the Si-nc prepared for this study is affected by the QC effect, but the broad PL emission band detected in the 550–950 nm range is due to contributions from several radiative defects and cannot be straightforwardly tuned through the control of the nanocrystalline size. Moreover, slight variations in the preparation and processing routes of the Si-nc can lead to uncontrollable changes in the emission intensity and spectral features.Reference Wang, Ni, Pietzsch, Hennies, Bao and Chao19 On these premises, we tried a different strategy to attain specific colored emission in an engineered fluorophore. As anticipated in the Sec. I, we experimented the application of pyrolytic Si-nc as antennas to absorb excitation light and successively transfer the energy to a rare-earth emitter placed nearby the nanocrystal. Yb3+ ions were chosen as prototype emitters because they represent a suitable case study, as detailed in the following. First of all, their extremely simple energy level structure does not permit direct excitation at energies above the luminescent level as shown in Fig. 5; in this way, occurrence of energy transfer from the sensitizer can be readily assessed. Second, their emission band at 980 nm is such to keep the possibility of detection with inexpensive silicon detectors, and third, Yb3+ions can be linked to Si-nc oxide surface exploiting their ability to form complexes with amino groups.
In our procedure, Si-nc prepared by laser pyrolysis (with crystallite size equal to 9 nm as determined from x-ray diffraction analysis) were first functionalized with amino groups by reaction with aminopropyltriethoxysilane (APTES) and subsequently dispersed in a solution of EtOH and YbCl3 to induce the reaction of Yb-ions with the surface-bound NH2 groups. The complex [Yb(III)(APTES)3Cl3] was also synthesized to check possible unwanted effects of APTES residuals on the optical properties of the functionalized Si-nc. Yb-doped Si-nc were annealed at 300° C for 30 min in air to remove residual alcohol groups, which could quench the Yb-ion PL emission.
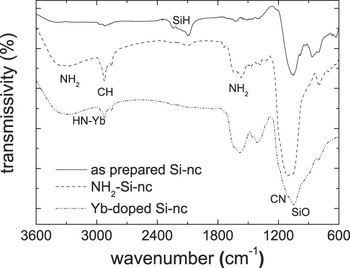
The FTIR spectra of the as-prepared Si nanoparticles and after functionalization either with APTES only or with both APTES and Yb-ions are shown in Fig. 6. The FTIR spectrum of the as-prepared sample shows signals due to silicon bonds with hydrogen and oxygen, while the ammine groups are clearly visible in the spectra taken on the functionalized samples. Moreover, the ammine band broadens after Yb doping, which strengthens the assumption of effective complex formation.
FTIR spectra of as-prepared Si-nc, NH2-functionalized Si-nc, and Yb-doped Si-nc.

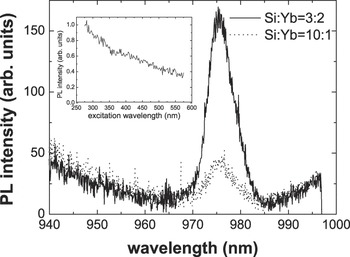
The as-prepared Si-nc do not show any detectable luminescence emission, probably as a result of poor surface oxidation. On the other hand, PL emission from Yb-ions is clearly detected under laser excitation at 532 nm of the Yb-doped Si-nc samples. Results are reported in Fig. 7. As expected, the emission intensity approximately scales up with the Yb content in the samples prepared with two different YbCl3 concentrations. It was checked that the PL signal is absent after excitation at 532 nm of the reference complex [Yb(III)(APTES)3Cl3], thus ruling out a possible sensitization effect of APTES on the Yb-ions. The sensitization effect of Si-nc is then unambiguous since the electronic structure of Yb3+ ions does not permit direct excitation in the visible. To further prove the broadband sensitization of the Si-nc, the excitation spectrum of the Yb-ions emission at 980 nm was measured and is reported in the inset of Fig. 7. The similarity with the typical PLE spectra of luminescent Si-nc confirms the nanocrystals sensitizing role.
CW PL spectra of Yb-doped Si-nc at two different Si-nc:Yb molar ratios, excited at 532 nm. Inset: excitation spectra of Yb emission at 975 nm.

Our strategy of doping Si-nc with rare-earth ions can be extended to Si-nc obtained with other preparation methods since it offers the possibility to get well controllable, narrow band, and stable PL emission.
IV. TOXICITY TESTS
Due to the considerable interest for the use of silicon nanoparticles in a medical context,Reference Wang, Ni, Pietzsch, Hennies, Bao and Chao19, Reference Choi, Wang and Reipa40, Reference Tasciotti, Liu, Bhavane, Plant, Leonard, Price, Cheng, Decuzzi, Tour, Robertson and Ferrari53 here, we report some specific in vitro studies that represent a relatively rapid and cost-effective way of screening in the assessment of nanoparticles toxicity. The biocompatibility of Si nanoparticles was estimated by assessing the integrity of the plasma membrane, by means of LDH assay, following the incubation of the cells with nanoparticles for 6 or 24 h. Among the biocompatibility assays, the LDH assay is considered one of the least sensitive since it evaluates a final event in a cell life, the rupture of the plasma membrane. For this reason, we performed also the MTT assay, which was the most sensitive cytotoxicity assay together with the neutral red one.Reference Fotakis and Timbrell54 The LDH release assay doses the activity of enzyme LDH in the extracellular medium. LDH is a cytoplasmic enzyme that should not be present outside its normal microenvironment. Its activity detected outer the cytosol, thus in the culture medium indicates an ultrastructural plasma membrane damage. The MTT assay was used to test the cell viability by probing the mitochondrial activity on cells incubated for 24 h. MTT is a water-soluble tetrazolium salt, which is converted to an insoluble purple formazan by cleavage of the tetrazolium ring by the mitochondrial enzyme succinate dehydrogenase. The formazan product is membrane impermeable, thus it accumulates in healthy cells. In the case of diagnostic imaging, Si nanoparticles are usually injected intravenously and their impact is on the endothelial wall. However, in evaluating exposure risks, it must be considered also the possible inhalation of nanoparticles that may occur in professional working conditions. In this last case, the most likely route of entry is across the lung alveolar epithelium whose surface area averages 70 m2.
For biocompatibility studies, we have chosen alveolar epithelial cells (A549) and murine fibroblasts (L929). These cells, A549 and L929, were grown on Petri dishes in Dulbecco's modified Eagle's medium or Eagle's Minimum Essential medium, respectively, supplied with 10% fetal bovine serum (FBS), 1% of L-glutamine, and 1% of penicillin/streptomycin and incubated in a controlled environment at 37 °C with 5% CO2. During all the experiments, cells were incubated with medium supplemented with 1% FBS to prevent serum interference in the toxicity assay. LDH release test (Roche Applied Science Monza, Italy) and MTT assay (Sigma Aldrich, Milano, Italy) were performed according to the manufacturer instructions. Si-nc were dissolved at different concentrations (from 1 ng/mL up to 10 μg/mL) in the cell culture medium and cells were incubated for 6 or 24 h. In some cases, after 24 h, nanoparticles were removed and fresh medium was added for 24 h to cell cultures to assess the ability of the cells to recover after nanoparticles exposure. The maximal value of LDH release was obtained on lysed cells.
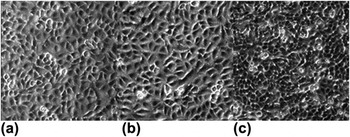
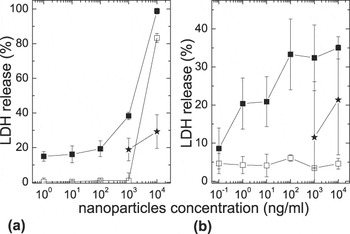
Toxicity tests were performed on different batches of Si-nc prepared by laser pyrolysis.Reference D’Amato, Falconieri, Fabbri, Bello and Borsella12 As-prepared Si-nc with average size of 8.9 nm (labeled Si193H) were dispersed in dimethyl sulfoxide in a stock concentration of 1 g/L. Since DMSO is a well-known toxic solvent, before performing nanoparticles biocompatibility tests, we determined that 0.001% is the maximum concentration of DMSO that avoids its toxicity per se, as shown in Fig. 8. Cells exposed to 0.001% DMSO in the medium revealed no signs of distress [e.g., detachment from the plate; see Fig. 8(b)], and the percentage of dead cells was not different from the control condition [see Fig. 8(a)] (9.7% ± 3% versus 5.0% ± 2%, respectively, evaluated with Trypan blue). This dilution of the solvent corresponds to nanoparticles concentration of 1 μg/mL. The percentage of LDH release was very high for the maximal concentration of nanoparticles tested (83% ± 3% and 98% ± 2% for 6 and 24 h of incubation, respectively). It has to be considered though that at this maximal concentration, the effect of the solvent is still present. In fact, at the 10 times lower concentration (100 ng/mL), the LDH release decreased significantly, being 1% ± 4% at 6 h and 38% ± 2% at 24 h of incubation [Fig. 9(a)]. Moreover, after 24 h of incubation and 24 h of recovery, the LDH release decreased to 19% ± 6%.
Three typical images acquired in bright field (magnification 4x) showing the effect of progressive concentration of DMSO on A549 cell culture. (a) Control culture and (b) and (c) DMSO 0.001% and 0.01%, respectively, in culture medium.

LDH release by A549 cells after 6 h (open squares) and 24 h (filled squares) of incubation for 8.9-nm Si-nc dispersed in DMSO (a) and 8-nm Si-nc dispersed in ethanol (b). The filled stars represent the percentage of LDH release after 24 h of nanoparticles incubation followed by 24 h of recovery in regular medium.

Other batches of Si-nc (with average size of about 8 nm) were dispersed in ethanol with a stock concentration equal to 8 g/L, almost 10 times higher than the previous one. For these nanoparticles (labeled as Si276N1 and Si276N2), at the concentration tested, we did not find any effect of the solvent (data not reported here), and also, we did not find a real dose dependence of LDH release, being about 5% after 6 h of incubation for all the concentration tested and about 30% after 24 h as shown in Fig. 9(b). Also in this case, the recovery after 24 h showed a trend, even if not pronounced, indicating a decrease in the level of the cell population membrane damage (11% ± 14%).
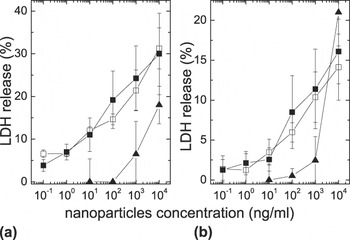
Moreover, we tested surface-oxidized silicon nanoparticles (S276G-F with average size of 8 nm and S252D with average size of 4.5 nm). Procedure for the chemical surface oxidation is described in Ref. Reference D’Amato, Falconieri, Fabbri, Bello and Borsella12. In this case, the incubation of A549 with nanoparticles revealed a dose dependence but not a time dependence in the LDH release, as shown in Fig. 10(a). The maximal release observed corresponded to the 15% of the highest value, both after 6 or 24 h of incubation. Since this was the case when the alveolar epithelial cells were less stressed, we tested the same Si-nc also on murine fibroblasts. As can be appreciated in Fig. 10(b), the data revealed indeed a dose-dependent plasma membrane distress with the maximal value of LDH release equal to about 30% at the maximal concentration tested. On the other hand, we did not observe any clear size-dependent effect. Finally, we tested Yb-doped Si-nc on both the alveolar epithelial and fibroblast cells after 24 h of exposure. We selected this interval of incubation since we did not detect any time dependency on oxidized Si-nc. The results showed again a dose response effect, with a maximum release of about 20% in both the cell lines (Fig. 10).
LDH release by A549 cells [panel (a)] and L929 cells [panel (b)] after 6 h (open squares) and 24 h (filled squares) of incubation with oxidized Si nanoparticles and after 24 h incubation with Yb-doped Si-nc (filled triangles) dispersed in ethanol.

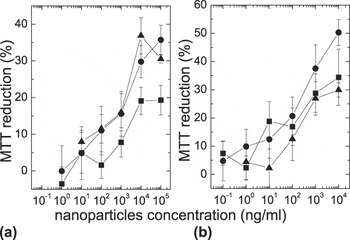
The results of the MTT assays obtained with both A549 and L929 cells incubated for 24 h with as-prepared, oxidized, and Yb-doped Si-nc (Fig. 11) display the same degree of sensitivity toward the three types of Si-nc, showing a dose-dependent MTT reduction with a maximum value equal to about 30%. These data do not show significant differences with respect to the LDH assays, confirming the relatively low dose-dependent toxicity of all the tested silicon-based nanoparticles.
MTT assay of A549 [panel (a)] and of L929 [panel (b)] cells viability after 24 h incubation with as-prepared Si-nc (filled squares), oxidized Si-nc (filled circles), and Yb-doped Si-nc (filled triangles).

The literature reports a wide variety of cell lines tested and assays to evaluate the geno- or cytotoxicity. The most common tests used to study the in vitro toxicity evaluate cell morphology, apoptosis, and cells viability but also cytokine production as an indirect marker of inflammation and oxidative stress. However, our two tests provide clear assessment of cells response to Si-nc and allow a comparison with other cytotoxicity data reported in the literature. Our data suggest that, in general, Si-based nanoparticles per se do not reveal a high level of cells distress. Moreover, when we exposed the cell culture to nanoparticles for 24 h and then let the cells recover substituting the medium containing nanoparticles with fresh medium for other 24 h, we found a lower level of LDH release. This may indicate that the greater part of the cell population is able to recover from the nanoparticle interaction.
To investigate the behavior of different cell lines, we tested the nanoparticles that were less reactive on A549 cells also on the murine fibroblasts L929. These cells are widely distributed in the skin and constitute a common component of the connective tissue whose role is to secrete precursors of the extracellular matrix such as collagen and proteoglycan. They are metabolically active and in fact are used as tool in many standard material biocompatibility tests.Reference Zange, Li and Kissel55, Reference Nordin, Wieslander, Martinson and Kjellstrand56 Our results suggest that fibroblasts are more sensitive than epithelial cells, confirming that not all the cell lines behave at the same and that for a more thorough analysis, one has to consider either the specific biological target or a pool of cell lines representative of the whole organism. A similar conclusion was drawn by Fujioka et al.Reference Fujioka, Hiruoka, Sato, Manabe, Myasaka, Hanada, Hoshimo, Tilley, Manome, Hirakuri and Yamamoto57 in a recent paper where they compared the sensitivity of HeLa cells and hepatocytes to CdSe QD. In this same paper, studying the response of HeLa cells to luminescent oxidized Si-nc in terms of mitochondrial activity assays and LDH release assays, they showed that the Si-nc are safer than CdSe quantum dots, especially under UV exposure conditions and below the concentration of 112 μg/mL. Our work reports data obtained incubating the cells well below that threshold, and still, we found a moderate membrane distress that, considering again the work of Fujioka et al.,Reference Fujioka, Hiruoka, Sato, Manabe, Myasaka, Hanada, Hoshimo, Tilley, Manome, Hirakuri and Yamamoto57 might be the consequence of oxygen radicals production affecting the plasma membrane of the cells. Considering also our results obtained investigating the mitochondrial distress, we find only a minor deviation from the data presented in the literature,Reference Wang, Ni, Pietzsch, Hennies, Bao and Chao19, Reference Erogbogbo, Yong, Roy, Xu, Prasad and Swihart22, Reference Erogbogbo, Yong, Roy, Hu, Law, Zhao, Ding, Wu, Kumar, Swihart and Prasad27 thus confirming that for a concentration in the range of μg/mL, Si-nc can be considered biocompatible. Finally, in contrast with Bhattacharjee et al.,Reference Bhattacharjee, de Haan, Evers, Jiang, Marcelis, Zuilhof, Rietjens and Alink58 it is noteworthy to observe that we do not detect any difference in MTT production despite the different charge of the Si-nc. In fact, the measured Z-potential was negative for the as-prepared nanoparticles and for the oxidized nanoparticles (−32.8 ± 1.1 mV and −17.6 ± 0.9 mV, respectively), while it was positive for the Yb-doped nanoparticles (+35.9 ± 1.1 mV).
V. CONCLUSIONS
Full exploitation of the optical properties of Si-nc for bioimaging and other applications rests on a detailed understanding of the process responsible for PL excitation and emission. To this purpose, here, we have compared the spectroscopic properties of the same as-prepared sample by laser synthesis (Si-nc) and after chemical oxidation (SiO2-np). We have found that the red PL emission of both systems shows very similar time dependence and spectral features. Our analysis of the luminescence decay curves based on the sum of single exponential terms, each deriving from a different emitter, allows us to conclude that the same radiative defects are responsible for the emission in both samples. On the other hand, the PL excitation mechanism is quite different in the two cases. In particular, the PLE spectrum of the red PL emission in Si-nc has a similar spectral dependence to that of bulk Si, with an impact of QC in blueshifting the critical points. By comparing the results of our analysis with the data early published on defective silica and more recently on mesoporous silica, we concluded that PL emission in Si-nc is initiated by quantum-confined carrier interband excitation followed by relaxation to the interface NBOHC defect states. Local strain and variation of the chemical environment can strongly influence the emission energies, and this could explain the sample-dependent optical properties often detected on Si-nc, especially after the surface functionalization and bioconjugation steps needed for biomedical applications.
Although the generalization of our model on the defective nature of PL emission to other types of Si nanoparticles needs further experimental and theoretical support, difficulties in getting fully size-controllable, reproducible, and stable specific color emissions from Si-nc are widely recognized. In spite of these difficulties, the unquestionable interest in the development of Si-based luminescent biomarkers, especially for in vivo applications, prompts toward the outlining of new strategies for its exploitation. A possible solution could be based on the creation of engineered luminescent defects in Si-nc and their stabilization. This approach, however, is risky for the uncertainty in the possibility to get wave length-controlled, stable, and narrow emission from the defects. We have therefore followed a different strategy based on the use of Si-nc as part of an engineered fluorophore, where the nanocrystals act as sensitizers of a suitable emitter, i.e., a rare-earth ion, Yb3+. This approach is made possible by the sufficientlyReference Kovalev, Heckler, Polisski and Koch44high and broadband Si-nc absorption cross section in the visible and near UV, and by the easy chemical functionalization of the Si-nc surfaces. Work is in progress to couple silicon-based nanoparticles to other lanthanide ions with luminescence emission bands falling in the optical range of interest for medical bioimaging.
We can also conclude that the Si-nc are quite biocompatible in the range of concentration (up to 103 ng/mL) used in this as well as in other studies.Reference Fujioka, Hiruoka, Sato, Manabe, Myasaka, Hanada, Hoshimo, Tilley, Manome, Hirakuri and Yamamoto57, Reference Gu, Howell and Sailor59For the as-prepared Si nanoparticles, we could detect a time dependence of the cell distress, while for nanoparticles with a chemically oxidized surface, neither size nor time dependency was revealed. If the optical properties of these nanoparticles were improved, they could be good candidates for biomedical application. In fact, in case of diagnostic bioimaging, the moderate effects observed on cell plasma membrane could be still in the range adequate for a diagnosis since in this case, a somehow higher risk/benefit ratio can be tolerated. This, of course, could not be accepted for continuous therapy use.
ACKNOWLEDGMENTS
We wish to thank Prof. Giovanni Mattei and Dr. V. Bello for the valuable long lasting cooperation on HR-TEM characterization of Si-based nanoparticles, Prof. D. Wang and Prof. F. Huisken for helpful discussion, Dr. Fabio Fabbri for significant contribution in the laser synthesis of nanoparticles, Mr. Gaetano Terranova and Mr. Paolo Calvelli for skillful technical support in carrying out the experimental activity. Part of the funding for our research in this field came from the EC FP6 Life-Science-Health Project BONSAI “Bioimaging with smart functional nanoparticles” (Grant No. 037639).