INTRODUCTION
Asperger's disorder (ASP) is a pervasive developmental disorder at the high-functioning end of the autism spectrum, which, like autism, is characterized by impaired social relations. This feature has been attributed to a reduction in motivation or drive to attend to social stimuli (Dawson et al., 2004; Klin et al., 2003). Although altered motivational processes may play an important role in the abnormal social behavior and other symptoms of autism spectrum disorders (ASD), there has been surprisingly little research in this area. Nonetheless, a few studies have shown that nonsocial, as opposed to social, reinforcers are associated with better performance on tasks of attention (Garretson et al., 1990; Pascualvaca et al., 1998), executive function (Ozonoff, 1995), and imitation (Ingersoll et al., 2003). In addition, a recent study (Sutton et al., 2005) using resting anterior electroencephalogram asymmetry as a possible marker of approach or avoidance motivation identified two distinct subgroups of high-functioning autism. The first subgroup had more social impairments and relatively more right frontal than left frontal activation, which has been associated with behavioral inhibition and threat avoidance (see Davidson, 1998). The second subgroup demonstrated less social impairment, higher levels of anxiety, and relatively greater left activation, previously correlated with behavioral activation and approach (see Davidson, 1998).
These studies suggest that motivational processes affect social and nonsocial functions in ASD, and that neurobiologically distinct subgroups of ASD may be characterized by differences in motivation. Of course, the ability to learn and integrate information about reinforcement contingencies influences an individual's response to motivational properties of stimuli. In ASD, some evidence suggests impaired learning of prototypes and difficulty generalizing information (Klinger & Dawson, 2001; Minshew et al., 2002). Given the potentially important role of motivational and learning processes in the behavioral abnormalities that characterize ASD, we examined motivation and learning in a group of individuals with ASP using the Iowa Gambling Task (IGT; Bechara et al., 1994). This decision-making task requires participants to learn to make advantageous choices on the basis of feedback in the form of monetary gains and losses. To our knowledge, this is the first study formally to examine decision making in ASD and the first to evaluate behavior in this population under conditions that involve the potential for both positive and negative outcomes.
Of interest, some of the brain regions thought to be affected in ASD have been shown to be involved in decision making. Neurobiological theories of ASD emphasize functional abnormalities in the amygdala, prefrontal cortex, superior temporal sulcus, and fusiform gyrus; together, these regions are thought to comprise the “social brain” (Baron-Cohen et al., 2000; Brothers, 1996; Schultz et al., 2000). An overlapping set of regions, including the amygdala, prefrontal cortex, and ventral striatum is implicated in decision making according to both functional neuroimaging (Ernst et al., 2002, 2004) and lesion studies (Bar-On et al., 2003; Bechara, 2004; Bechara et al., 1994). Given the similarities in the neural substrates of decision making and ASD, we reasoned that the IGT may reveal useful insights into the brain functions associated with motivational processes in ASD.
Previous research has also shown that autonomic arousal differs in ASD patients relative to controls (Althaus et al., 2004; Hirstein et al., 2001; van Engeland et al., 1991). For example, Hirstein et al. (2001) found that an autistic group did not show a difference in skin conductance responses (SCRs) when making eye contact with their mothers compared with looking at a cup, whereas the control group showed significantly greater SCRs during eye contact. Furthermore, this study identified two autistic subgroups with distinct baseline SCRs: one with abnormally high SCRs, which decreased when subjects engaged in repetitive behaviors; and a second group with very low SCRs that increased during extreme activities such as self-injurious behavior. These findings suggest that autonomic responsiveness to socially salient stimuli is reduced in ASD and that abnormal baseline SCR may alter the motivational properties of both social and nonsocial stimuli.
Some previous studies of physiological responsiveness during IGT performance have shown increased SCR before a behavioral response in control participants (e.g., Bechara et al., 1997), whereas others have failed to show this anticipatory SCR (e.g., Campbell et al., 2004). These studies consistently have shown increased SCR after an outcome is presented. Patients with amygdala lesions lack both anticipatory and postselection SCRs during the IGT, whereas patients with ventromedial prefrontal cortex (VMPFC) lesions exhibit an absence of anticipatory responses and attenuated, but expected, patterns of postselection SCRs (Bechara et al., 1999). Based on these findings and evidence of abnormal SCRs in autism, we recorded SCR as a measure of autonomic responsiveness during IGT performance in the current study.
Overall, our rationale for selecting the IGT to study decision making in individuals with ASP was based on several converging lines of previous research. First, IGT performance is sensitive to damage in brain regions proposed to be affected in ASD. Second, the IGT is sensitive to differences in autonomic arousal in patients with lesions affecting brain regions thought to be involved in ASD. Furthermore, there is evidence for abnormal autonomic arousal in ASD. Finally, the IGT involves the interplay of complex psychological processes involving both motivation (responses to gains and losses) and learning, processes that appear to be abnormal in ASD.
In addition to examining participants' choices during the IGT, we also used a formal mathematical decision model (Expectancy–Valence Learning Model [EVL]; Busemeyer & Stout, 2002) to specifically quantify the contributions of learning, motivation, and response characteristics to choice behavior. By using a combination of behavioral measures of IGT performance, the EVL model, and a measure of autonomic responsiveness, the goal of the current study was to determine whether and in what ways decision making under motivationally relevant conditions might be altered in ASP.
METHOD
Participants
Twenty-nine adolescents and young adults, including 15 participants with ASP and 14 comparison volunteers (COM), participated in the study. Thirteen participants in the ASP group met full criteria for autism based on the Autism Diagnostic Interview-Revised (ADI-R; Lord et al., 1994). The two ASP participants who did not receive the ADI-R were diagnosed previously with an ASD, and we gathered developmental history from parents to confirm diagnosis. Consistent with diagnostic criteria for ASP from the Diagnostic and Statistical Manual of Mental Disorders, Fourth Edition (American Psychiatric Association, 1994), none of the participants had a cognitive handicap and none were reported to have a delay in the onset of expressive language. The groups were similar in age, gender composition (ASP, 73% male; COM, 71% male), and estimated intellectual abilities [Wechsler Abbreviated Scale of Intelligence (WASI); The Psychological Corporation, 1999]; see Table 1. Exclusion criteria for both groups included parent or self-reports of histories of significant head trauma, major neurological disorders, systemic diseases that might affect the central nervous system, and glandular disorders that could interfere with the collection of SCRs. Written informed consent was obtained for all participants > 18 years of age; for younger participants, parental consent and participant assent were obtained. All procedures were completed and data obtained in accordance with the study protocol approved by the Indiana University Human Subjects Committee.
Mean and standard deviation of age, WASI scores, autism symptom severity, and indecisiveness

Procedures
Participants were tested in a single session lasting approximately 3 hr as part of a larger study of social and cognitive functioning. The IGT was administered along with SCR assessments and required 20–30 min to complete. Participants' general level of cognitive ability was estimated with the two-subtest version of the WASI (Wechsler, 1999). Participants also completed two self-report measures, the Autism-Spectrum Quotient (ASQ; Baron-Cohen et al., 2001), a 50-item measure of severity of autistic traits, and the Indecisiveness Scale (Frost & Shows, 1993), a 15-item measure of decision-making style. One of the parents of each participant completed the Asperger Syndrome Diagnostic Interview (Gillberg et al., 2001), a 20-item measure of presence or absence of core autistic symptoms. A modified parent-report version of the Indecisiveness Scale, composed of 15 items, was also completed by the same parent.
Iowa Gambling Task
We used a computerized version of the IGT that was highly similar to the version used by Bechara and colleagues (1999). Our version included 150 trials, compared with 100 trials in the Bechara version. Furthermore, whereas previous versions have limited the cards in each deck to 40 or 60, our task allowed an unlimited number of selections from each deck.
Participants were shown images of four decks of cards, labeled A, B, C, and D, which were displayed horizontally and “face down” on a touchscreen monitor. Participants were instructed to try to win as much money as possible by making a series of selections from the decks. Participants started with a $5.00 credit and were informed that they would receive their winnings at the end of the session. To select a card, participants touched a deck on the monitor. There was no time limit for card selection. To enable SCR data collection during the IGT, we used a 6-s inter-trial interval. Participants were told that they could switch between decks whenever they liked. They were blind to the total number of selections and the deck contingencies.
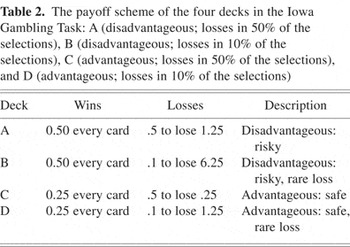
Immediately following each selection, the card was turned over to reveal the amounts won and lost. This feedback remained on the screen for 3 s. Every selection resulted in a win, and on some selections these wins were coupled with a simultaneous loss (see Table 2) so that the result of any selection could be a net gain, a net loss, or a neutral outcome. Total earnings were displayed on the screen at all times. Decks differed with respect to the amount of gain and the frequency and severity of losses. Decks A and B were disadvantageous overall, leading to a net loss of $1.25 per 10 cards. Decks C and D were advantageous overall, leading to a net gain of $1.25 per 10 cards. Decks B and D yielded lower frequency, larger magnitude losses, whereas Decks A and C yielded smaller, more frequent losses (Table 2; for additional details, see Stout et al., 2004).
The payoff scheme of the four decks in the Iowa Gambling Task: A (disadvantageous; losses in 50% of the selections), B (disadvantageous; losses in 10% of the selections), C (advantageous; losses in 50% of the selections), and D (advantageous; losses in 10% of the selections)

Performance was represented by the proportion of selections from the two advantageous decks (C and D) and the two disadvantageous decks (A and B) for each of six consecutive blocks of 25-card selections. To examine group differences, we computed a 2 (group) × 6 analysis of variance (ANOVA). We also analyzed selection sequences for individual participants to quantify the number of consecutive selections from each individual deck (i.e., runs) and compared the groups on maximum and average run lengths.
Skin Conductance Responses
Electrodermal skin conductance responses were recorded with PSYLAB psychophysiological equipment and software (version 7; Contact Precision Instruments, Cambridge, MA). We used a PSYLAB SC5 24 bit digital Skin Conductance amplifier and a PSYLAB Stand Alone Monitor and placed 8-mm Ag/AgCl electrodes on the medial phalanges of the first and third fingers of the nondominant hand with an isotonic conducting medium. To ensure comparability between groups, baseline SCRs were measured in response to a series of tones that were interrupted with two presentations of white noise. Responsiveness was defined as the largest change in amplitude following each presentation of white noise. The groups showed similar levels of SCRs following both presentations of white noise [first presentation: t(16) = 1.8; p = .09; second presentation: t(24) = −.05; p > .5].
During the IGT, amplitudes of postselection (i.e., reactionary) SCRs were calculated as the largest change in SCR initiated in the 3 s after a selection. Anticipatory SCR values were calculated as the largest change in SCR initiated in the 3 s before a selection. The following six types of responses were analyzed: anticipatory responses to advantageous and disadvantageous deck selections, postselection responses to advantageous and disadvantageous deck selections, and postselection responses to win (win; no associated loss) and loss (net loss) selections. Postselection responses to wins and losses were further analyzed according to the size of the loss (i.e., large vs. small). SCR data were averaged across selections to produce the variables of interest for each group.
Modeling the IGT
According to the EVL model (Busemeyer & Stout, 2002), the decision-maker integrates the gains and losses experienced on each trial into a single affective reaction, or valence. Expectancies about the valence of each deck are learned by an adaptive learning mechanism and serve as inputs to a probabilistic choice mechanism that determines the choice on each trial. This model generates values for three model parameters (described below), which are theoretically derived estimates of psychological processes that influence the choice behavior of individual participants.
Relative attention to losses versus gains: The attention weight parameter, w.
According to the EVL model, the decision-maker experiences an affective reaction called a valence, denoted v(t), to the wins and losses experienced on a trial t. This value is calculated as a weighted average of the wins and losses produced by the chosen deck in trial t.

The attention weight parameter, w, indexes the relative salience for the decision-maker of the loss versus the win for a selection. For example, some participants may persist in choosing from disadvantageous decks because they are insensitive to losses or hypersensitive to wins produced by these decks. The attention weight parameter ranges from 0, indicating attention only to gains, to 1, denoting attention only to losses.
Influence of memory for recent outcomes: The learning/memory parameter, φ.
Over repeated selections, participants develop expectancies about each deck. In the EVL, a learning rule (see e.g., Busemeyer & Myung, 1992; Sarin & Vahid, 1999) updates the expectancy for a deck after each selection from that deck. This rule determines the effect of recent outcomes versus outcomes experienced in past selections. The expectancy for Deck j, or Ej, is updated for the selected deck as a function of the expectancy for the selected deck that has developed over the preceding trials combined with the valence associated with the current selection.

The learning/memory parameter, φ, describes the degree to which expectancies reflect the broad influence of past experiences with particular decks or are more influenced by recent experiences with a deck. This parameter also ranges from 0 to 1. Large values indicate strong recency effects and rapid discounting of past outcomes. Small values indicate the persistence of influences over longer spans of selections. Note that a large recency value could lead to less influence of infrequent outcomes.
The choice consistency parameter, c.
The decision-maker's choice on each trial is based not only on the expectancies produced by each deck, but also on the reliability with which those expectancies are applied when making selections. The choice consistency parameter, denoted c, describes this reliability. According to the EVL model, the probability of choosing a deck is a strength ratio of that deck's expectancy relative to the sum of the strengths of the expectancies of all decks.

The term θ(t) controls the consistency of the choice probabilities and the expectancies. Some participants might learn to trust their developing deck expectancies resulting in choices that are more consistent with their expectancies as the task progresses. Others may become distracted and tired over time and their consistency might decrease as the task progresses. This effect of experience on performance is formalized by a power function for the consistency change over trials:

where c is the choice consistency parameter. The range of this parameter is −5 to +5. When the value of the consistency parameter is positive and very high, the deck with maximum expectancy will almost certainly be chosen on each trial. When the value of c is strongly negative, choices are inconsistent, random, impulsive, and independent of the expectancies. If a participant fails to select a high proportion of advantageous cards because they respond unreliably to their expectations, this would be reflected by a low value on the consistency parameter.
After the model parameters that best accounted for each participant's choices were found, we then evaluated the fit, or ability of the EVL model to predict the card by card selections for each participant, in comparison to the fit of a control model. The control or Bernoulli model predicts choices based on the observed marginal choice frequencies for each deck, pooled across trials for each person, and assumes that each selection is made without consideration of the outcomes of prior selections (i.e., without the influence of learning). Model fits were then compared using G2 (Busemeyer & Wang, 2000), analogues to the χ2, to determine whether the EVL model showed a statistical improvement in fit over the Bernoulli model.
RESULTS
Iowa Gambling Task Performance: Behavioral Findings
The ASP and COM groups demonstrated similar proportions of overall advantageous selections (ASP group, 54%; COM group, 58%; p > .5). Repeated-measures ANOVA revealed similar performance for the groups throughout the task, with both groups demonstrating increasing advantageous selections across the 150 trials (F = 4.14; p < .01; see Figure 1). The group × block interaction was not statistically significant (F = 1.51; p > .1).

Proportion of choices from advantageous Decks C and D in the Asperger's disorder and comparison groups. Error bars represent the standard error of measurement.
An analysis of selection sequences within each group revealed highly distinct selection patterns. Individuals in the comparison group typically made stretches of consecutive selections from the same deck, or runs, interspersed with more discrete deck choices. In contrast, individuals in the ASP group made few runs of consecutive choices. When runs did occur, the run lengths were consistently much shorter than the run lengths observed in the comparison group [maximum run length for the ASP group: M = 6.5, SD = 6.5, range 2–22; for the COM group: M = 30.4, SD = 33.0, range 3–99; t(13.9) = −2.66; p < .05]. A group difference was also present when the longest run length from advantageous decks (C or D) was examined separately [t(13.7) = 2.41; p < .05]. The group difference for the longest run on disadvantageous decks approached significance [t(27) = 1.68; p = .11]. For all measures, the ASP group demonstrated shorter runs than the comparison group.
Given the frequency of deck shifts in the ASP group, we examined the possibility that these participants used a simple “win–stay, lose–shift” strategy by quantifying how frequently a winning selection led to another selection from the same deck, and a losing selection led to a shift. The ASP group shifted to a new deck more frequently than the comparison group following both winning and losing selections. Thus, the reduced run length in the ASP group was not accounted for by a “win–stay, lose–shift” strategy.
SCR Results
The ASP and COM groups differed significantly on postselection SCRs for advantageous Deck A [t(25) = −2.51; p < .05], and group differences approached significance on several postselection measures (p < .10), with the ASP group consistently producing lower SCRs. There were no group differences for measures of anticipatory SCRs.
Cognitive Modeling Results
To examine potential group differences in learning, motivation, and response characteristics, we investigated performance using the EVL model. The model fits of individual data were satisfactory. Comparison of the EVL model to the Bernoulli baseline model showed positive G2 for 55% of the participants, and the average of participants' G2 values was significantly higher than zero (G2M = 11.9; t = 1.74; p < .05 one-tailed).
Comparison of parameter estimates.
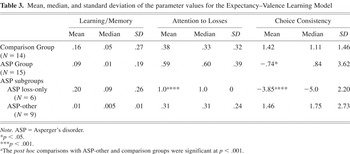
The learning/memory parameter did not differ between the two groups [t(27) = −.85; p > .4; see Table 3]. However, the ASP group demonstrated lower choice consistency [t(18.7) = 2.13; p < .05], indicating lower fidelity of their selections to the expectancies they associated with the decks. This finding is consistent with their significantly smaller runs of consecutive choices. Although the groups did not differ statistically on the attention weight parameter [t(27) = 1.55; p = .13], the suggestion of a group difference and the direction of the results warranted further investigation (see Exploratory Subgroup Analyses section below).
Mean, median, and standard deviation of the parameter values for the Expectancy–Valence Learning Model

Clinical/Demographic Correlates of IGT Measures
We completed a set of exploratory analyses to examine associations between IGT performance measures and demographic and clinical measures, including performance on the WASI subtests, self-reports based on the ASQ and Indecisiveness Scale (IS), and parent reports based on the Asperger Syndrome Diagnostic Interview and IS. Due to the small sample size, we used the Pearson product moment correlation in lieu of regression analyses. Because these analyses were exploratory and resulted in multiple correlation coefficients, a conservative p value of p < .01 was applied.
There were no significant associations between IGT and demographic or clinical measures for the ASP group. In the comparison group, a greater number of advantageous selections was associated with higher estimated intelligence quotient (r = .85; p < .001).
Exploratory Subgroup Analyses
Although the groups did not differ statistically on the attention weight parameter, the ASP group showed a relatively greater attention to losses, whereas the comparison group attended more to wins. We examined the attention weight parameter of the ASP results further because other clinical groups, including VMPFC patients (Stout et al., 2002) and substance abusers (Stout et al., 2004, 2005), and their comparison groups have all shown a relative attention to wins. Of interest, we found that 40% of the ASP group (6 of 15) focused on losses only (attention weight parameter value of 1) compared with 14% (2 of 14) in the control group. An equal number of participants in each group focused solely on wins (13% for ASP, 14% for COM group). Furthermore, all of the ASP participants in the loss-only subgroup had highly inconsistent choices (choice consistency parameter, M = −3.58; SD = 2.2). In contrast, for the two participants in the comparison group that attended only to losses, the choice consistency parameter was positive. Thus, although both groups included participants who focused only on losses, the ASP loss-only and the comparison loss-only participants differed in other processes affecting their selections.
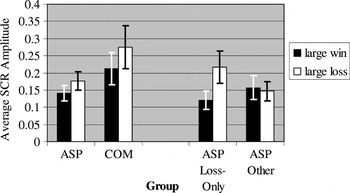
We also found that both the comparison group and the ASP loss-only group demonstrated significantly greater postselection SCRs following large losses compared with SCRs following other outcomes (Figure 2). However, within the other subgroup of ASP participants, those who did not differ from the comparison group on EVL modeling parameters, there was no such differentiation of SCR results as a function of selection outcome. Despite clear differences in modeling parameters and SCRs, these potential ASP subgroups did not differ with regard to proportion of advantageous selections, run lengths, or any of the clinical and demographic measures included in this study.

The left side of the figure shows the postselection skin conductance response (SCR) amplitudes for large wins and large losses for the Asperger's disorder (ASP) versus comparison group. The results for the ASP loss-only and ASP-other groups are depicted on the right. The mean level of the highest amplitude within 3 s of stimulus onset is represented, and the error bars indicate the standard error of the mean. COM, comparison group.
DISCUSSION
Our findings revealed distinct behavioral, physiological, and psychological features of IGT performance in individuals with ASP. Specifically, the ASP group showed an unusual selection pattern characterized by frequent shifts between decks, regardless of whether the decks were advantageous or disadvantageous and regardless of the outcome (win/loss) of their selections. This pattern of short run lengths appears to be unique, as it has not been reported in other studies, and was a striking feature in our sample. Shorter run lengths in the ASP group did not reflect a “win–stay, lose–shift” strategy and were not associated with parent or self-reports of indecisiveness, suggesting that this finding was not simply a reflection of indecisive behavior more broadly. Consistent with the finding of short run lengths, the EVL model indicated low fidelity of their choices to the valences they assigned to the decks (i.e., low choice consistency parameter). Taken together, these findings suggest that factors other than the motivational properties of the deck contingencies were influencing choices. This set of findings is interesting in light of the fact that the EVL learning parameter indicated that both groups integrated information about deck contingencies across the task. Thus, although it appears the ASP group learned the motivational properties of stimuli, this information did not consistently drive behavior.
The mean proportion of advantageous selections for the ASP group improved only slightly across the IGT (50.4 to 56.4%), whereas the COM group showed an 18.8% improvement across blocks (49.6 to 68.4%). Although statistically nonsignificant, the absence of a group difference was likely due to our small sample size and the large standard error of the comparison group, which reflected the performance of two individuals who strongly preferred the disadvantageous decks.
This suggestion of less efficient learning and our finding of frequent switching behavior in the ASP group during the IGT are consistent with previous research indicating that people with ASD are impaired at learning prototypes and generalizing information (Klinger & Dawson, 2001; Minshew et al., 2002). For example, Minshew et al. (2002) reported impaired generalization of concepts when rules are unknown or must be generated, although concept identification, or the ability to learn externally generated rules, was normal. In the IGT, contingencies are not explicitly revealed, but instead must be generalized from experience with outcomes. As such, the absence of concrete rules to guide deck selections may have affected performance in the ASP group.
IGT Performance and the Neural Substrates of ASP
Given the proposed role of the amygdala and prefrontal regions in ASD, we compared previously reported IGT findings in amygdala- and VMPFC-lesioned patients with those of our ASP group. Similar to patients with amygdala or VMPFC lesions (Bechara et al., 1999), the ASP group showed a relative lack of increase in advantageous selections across the task. Like VMPFC patients (Bechara et al., 1996, 1999), the ASP group demonstrated attenuated, although relatively normal, patterns of postselection responses. In contrast, patients with amygdala lesions have demonstrated a lack of postselection SCRs (Bechara et al., 1999, 2003). Although the ASP group appeared to be similar to patients with VMPFC lesions based on the behavioral and SCR findings, the psychological processes underlying IGT choices were distinct. Using the EVL model, patients with VMPFC lesions previously were found to have high attention to gains and a strong influence of recent outcomes (Yechiam et al., 2005), whereas our ASP participants showed relatively high attention to losses and less influence of recent outcomes. EVL results are not yet available for amygdala-lesioned patients. In summary, our findings suggest important differences between the ASP group and both VMPFC- and amygdala-lesioned patients.
Our results are consistent with recent evidence of neural underconnectivity in ASP (Courchesne & Pierce, 2005; Just et al., 2004) and suggest disruption of a broader neural network recruited by the IGT. Specifically, the apparent incongruence between the learning of the expectancies, or motivational value, of the IGT decks and the participants' behavioral choices suggests that brain regions involved in learning the motivational properties of stimuli may interact abnormally with regions implicated in choice behavior, leading to the response inconsistency that characterized ASP performance.
Possible ASP Subgroups Based on IGT Findings
Consistent with the known heterogeneity in ASD, group differences in the EVL modeling parameters were due to a subset of the ASP group (40%), which attended only to losses and demonstrated very low choice consistency. The relatively high proportion of ASP participants attending only to loss was surprising given our previous work, which has consistently shown a relatively greater influence of wins in clinical samples (Stout et al., 2004, 2005; Yechiam et al., 2005). This subgroup demonstrated high attention to loss, very low choice consistency, and increased postselection responses to large losses, a pattern of SCR that was similar to the comparison group. This combination of results suggests that individuals in this subgroup may be more motivated by avoidance of negative outcomes than by positive reinforcement. Furthermore, it is possible that individuals in this group may be hypersensitive to their physiological responses. In contrast, the other subgroup of ASP participants was similar to the comparison group on all EVL parameters, showing relatively greater attention to wins and intact choice consistency. However, their SCR findings deviated from controls in that they did not show differential postselection responses to distinct outcomes, suggesting that these individuals may lack the ability to physiologically respond to distinct outcomes. The current results suggest the possibility of two ASP subgroups with distinct motivational characteristics, response styles, and SCR patterns. ASD are known to be heterogeneous at the neurobiological level (Salmond et al., 2003); thus, there is a growing interest in identifying distinct phenotypes (Tager-Flusberg & Joseph, 2003) that may improve genetic and treatment research.
CONCLUSIONS
We examined IGT performance in ASP to understand the influence of motivational processes in decision making in this clinical group. Our findings highlight the value of formal cognitive models for elucidating the psychological mechanisms that underlie performance on complex behavioral tasks even when behavioral data are similar. Modeling allows for detailed comparisons between clinical populations and, thus, offers a means for refining hypotheses about links between behavior and brain function. The current modeling results, in combination with behavioral and physiological data, appear to be in keeping with recent findings of reduced functional connectivity in ASD rather than supporting a specific role of the amygdala or VMPFC in decision making under motivational conditions. Importantly, our results indicate that decision-making abnormalities in ASP, particularly in response to motivationally relevant stimuli, extend beyond the social realm into a variety of contexts and detract from the ability to learn about stimulus–reward relationships. Future studies that combine cognitive tasks with motivationally relevant stimuli and neurophysiologic methods will be essential for understanding how differences in ASP reflect neurobiological characteristics.
ACKNOWLEDGMENTS
This study was completed in the Clinical and Cognitive Neuroscience Laboratory of Julie C. Stout, Ph.D., at Indiana University. These findings were presented partly in a talk at the International Meeting for Autism Research (IMFAR) conference in May of 2004 in Sacramento, CA, and in poster format at the Cognitive Neuroscience Society Meeting (CNS) in April of 2005 in New York City, NY. Thanks to Heather Coates and Petra Schumacher for assistance with data collection.