I. INTRODUCTION
The 7075 (Al–Zn–Mg–Cu) alloy is widely used in many engineering applications owing to its desirable mechanical properties like high-specific strength comparable with high strength steel with a lower specific gravity. Reference Lee, Yeh and Liao1–Reference Miller, Zhuang, Bottema, Wittebrood, Smet, Haszler and Vieregge3 However, the wider application of 7075 alloy is limited by its relatively poor wear resistance. Reference Andreatta, Terryn and de Wit4–Reference Sabatini, Ceschini, Martini, Williams and Hutchings6 Al–Si alloy (4xxx series aluminum alloy) is also widely used in engineering industry due to its very attractive characteristics, especially its wear resistance. Reference Alshmri, Atkinson, Hainsworth, Haidon and Lawes7–Reference Raghukiran and Kumar10
Thus, the homogeneous materials are difficult to meet the requirements in engineering applications due to the increased demands of conflicting properties. This deficiency can be aggressed by utilizing the concept of functionally graded material (FGM). The properties (including mechanical properties, physical properties, and material density) of the FGMs also vary gradually with the variation of structure and composition. Reference Mahamood, Akinlabi, Shukla and Pityana11,Reference Muller, Mognol and Hascoet12 Therefore, the FGM of 7075 and Al–Si alloy can achieve the combination of excellent properties of two alloys.
Spray forming combines the processes of melt atomization and droplet deposition and can be used for the manufacture of near-net shape preforms in otherwise difficult to cast alloys. Reference Cui, Schulz, Schimanski and Zoch13,Reference Grant14 This technology has been successfully applied in lots of industrial productions such as automotive, electronic, and steel industries. Reference Hogg, Lambourne, Ogilvy and Grant15–Reference Srivastava, Mandal and Ojha18 As a traditional additive manufacturing technology, spray forming has the advantages of less oxidation and simple process steps. On this basis, the co-spray technique is developed for the manufacture of bimetallic gradient composite plate.
The basic principle of this process is that two kinds of different melts are sprayed and deposited onto a moving flat substrate, and then a composite material can be acquired. Especially, an overlap of two spray cones of the co-spray process will form a gradient transition zone at the interface between the two alloys of the cladding deposit. During this process, the deposit from the second atomizer will cover the deposit from the first atomizer rapidly; thus, the thermal condition at the interface meets the necessary conditions for the formation of a metallurgical interfacial combination between two different alloys. In addition, the internal stresses caused by lattice mismatch and composition difference Reference Wang and Fichthom19,Reference Khor, Dong and Gu20 will be compensated by the gradient component distribution between the two materials.
In consideration of the existence of two atomization gas flow field and the process is very complex, it is necessary to determine the process parameters for obtaining a deposited plate with desired shape and element distributions. Generally, in traditional spray forming, the temperature of melt alloy plays a key role in determining the effect of atomization, while the gas flow field is mainly affected by the structure of nozzle and atomizer. In addition, the shape of the deposited alloy is determined by parameters such as the nozzle scanning mode, scanning angle, the speed of the substrate, and so on. Reference Kang and Chang21 Therefore, the aim of this study is to establish a mathematical model describing the co-spray forming process of 7075/Al–Si bimetallic gradient composite plate with two gas atomizers. Moreover, the effects of co-spray forming parameters on shape and element distribution will be investigated.
II. MODELING AND EXPERIMENTAL
A typical ANSYS thermal analysis is mainly composed of three parts including pretreatment part/PREP7, solution part with load applying/SOLU, and post-treatment part/POST1/POST26. Solid modeling, selection of the unit, assignment of the physical property parameters, mesh generation, and setting coupling analysis are completed in the pretreatment part. Simulation of the main algorithm including a defining variable, compiling the loop statement and definition of the boundary conditions, is achieved in the solution module part. In general postprocessor/POST1, graphic display with colors or in certain cross section, while a certain node or unit changing with the time curve can be shown in the part of time postprocessor/POST26.
A. The establishment of a shape model
In most commercial spray forming processes, the continuous melt stream is disintegrated into a discrete droplet spray. After the cylindrical liquid stream exits a melt-delivery nozzle and enters the gas flow field generated by a gas atomizer, it becomes unstable and the small perturbations at the gas/liquid metal interface will develop into surface waves, eventually leading to the break-up of the continuous liquid metal stream into discrete droplets or ligaments that distribute in a cone. According to Gaussian distribution, the radial distribution function of atomized droplets in spray cone can be given as Reference Cao, Wu, Ning, Zhao and Sun22,Reference Singer23
 $$D\left( R \right) = A \cdot \exp \left( { - B{R^2}} \right)\quad ,$$
where A is the mass density of the spray cone center, R is the distance to the center of spray cone, and B is the jet density altitude distribution coefficient.
Prior to the shape prediction model establishment, the following assumptions have to be made:
-
(i) spray cone follows with Gaussian distribution;
-
(ii) atomized droplets are accelerated, and flying in a straight line not affected by air flow;
-
(iii) since the spray cone angle is small and droplets are hardly affected by other factors in flying, it can be considered that both spray cone axes are perpendicular to the plane;
-
(iv) the rate of the substrate plate movement is faster than the deposition rate.
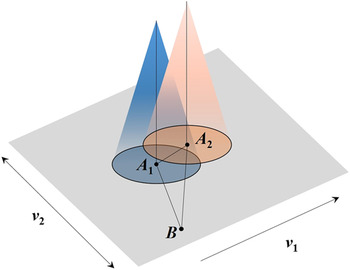
Simulation calculation that uses the Cartesian rectangular coordinate system is appropriate for the composite of two kinds of movement forms. As shown in Fig. 1, B(x, y) is a random point located on the deposition plate surface, while A 1(x 1, y 1) and A 2(x 2, y 2) are the intersection points of two atomizers’ centers and deposition plate. The radial distances of B(x, y) and the centers of two atomizing cones are indicated as BA 1 and BA 2, respectively. L is the distance between two centers of atomizing cones (A 1 A 2), V 1 is the horizontal speed of deposition plate, V 2 is the transverse direction speed of deposition plate, dt is the load time step, t is the cumulative time, and every load time step accumulates.
Diagram of a random point of deposition plate surface and the centers of double atomizing cones.

For simplification, the movement of deposition plate is converted to the movement of two atomizers. The track of movement can be expressed by the following equations:
 $$\left\{ {\matrix{ {{x_1} = v \times t\quad ,} \hfill \cr {{x_2} = - L + v \times t\quad ,} \hfill \cr {{y_1} = {y_2} = f(t)\quad .} \hfill \cr} } \right.$$
In spray forming, the spatial mass flux distributions m can be given as Reference Cui, Fritsching and Schulz24,Reference Cui, Fritsching, Schulz and Li25
 $$m\left( {R,h} \right) = {a_0} \cdot {\left( {{{{h_0}} \mathord{\left/ {\vphantom {{{h_0}} h}} \right. \kern-\nulldelimiterspace} h}} \right)^2} \cdot \exp \left[ { - {b_0} \cdot {{\left( {{{{h_0}} \mathord{\left/ {\vphantom {{{h_0}} h}} \right. \kern-\nulldelimiterspace} h}} \right)}^2} \cdot {R^2}} \right]\quad .$$
The amount of mass flux from two atomizers can be expressed by the following equations, respectively:
 $$\left\{ {\matrix{ {{m_1} = {a_0} \cdot {{\left( {{{{h_0}} \mathord{\left/ {\vphantom {{{h_0}} h}} \right. \kern-\nulldelimiterspace} h}} \right)}^2} \cdot \exp \left[ { - {b_0} \cdot {{\left( {{{{h_0}} \mathord{\left/ {\vphantom {{{h_0}} h}} \right. \kern-\nulldelimiterspace} h}} \right)}^2} \cdot {{\left( {x - {x_1}} \right)}^2} + {{\left( {y - {y_1}} \right)}^2}} \right]} \cr {{m_2} = {a_0} \cdot {{\left( {{{{h_0}} \mathord{\left/ {\vphantom {{{h_0}} h}} \right. \kern-\nulldelimiterspace} h}} \right)}^2} \cdot \exp \left[ { - {b_0} \cdot {{\left( {{{{h_0}} \mathord{\left/ {\vphantom {{{h_0}} h}} \right. \kern-\nulldelimiterspace} h}} \right)}^2} \cdot {{(x - {x_2})}^2} + {{(y - {y_2})}^2}} \right]} \cr} } \right.\quad .$$
The total deposition amount m is the addition of m 1 and m 2. With the above three equations, the deposited amount of any unit at any time, the shape of deposited plate, and the composition distribution can be acquired easily.
B. Analysis of algorithm
The objective of this study is to establish a mathematical model describing the co-spray forming process of deposited gradient plate with two gas atomizers and to investigate the influence of co-spray forming parameters on shape and element distribution. To achieve this, the “Birth and Death” option provided by the ANSYS FE code was adopted. This option can be used to deactivate or reactivate selected elements in certain cases. The “killed” elements were not actually removed but they were deactivated by multiplying their stiffness by a severe reduction factor.
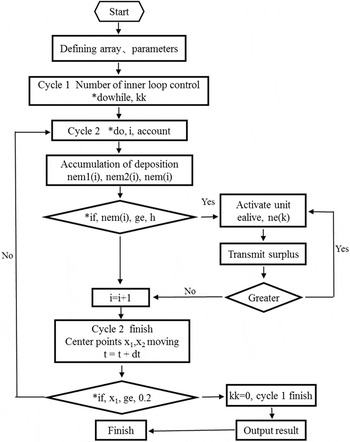
By means of the establishment of the physical model and mathematical model, shape simulation programming can be completed. On the basis of the shape simulation, coupled with modifying partial command statements and coupling analysis, the simulation of composition distribution is available. The shape and composition distribution of deposition plate programming flowchart is shown in Fig. 2.
The shape and composition calculation of deposited plate.

After the completion of the modeling, units are given numbers in the Z direction from bottom to top gradually through sweeping. Then arrays and parameters which are used for storage and the number of units are defined. Calculation is mainly divided into two large cycles, and the outer loop controls the times of inner loop. The inner loop is the main loop for calculation and the calculation is terminated by the nozzle center coordinates of the movement. At the beginning of cycle, all the inactive unit numbers that correspond to the centroid coordinates are acquired, and the amount of the two atomizers can be calculated by the spatial mass flux distributions formula. If the total amount of one unit is greater than the set threshold value, the unit is activated, with recording the Si content ratio of this unit, and the number of this unit adds one. According to the amount of previous deposit, the residual amount can be stored and the number adds one in the corresponding array. Meanwhile, a nesting cycle is used for judging whether the rest total amount is still larger than the threshold value. If so, this cycle continues. On the contrary, data are recorded and the inner cycle continues. At the end of inner loop, the time adds one step size and the center coordinates according to the trajectory movement. In this period, the outer loop will continue until the end of the calculation, and then section composition data will be outputted and saved.
C. Process parameter determination
To acquire uniform spray density and shape across the deposition surface by the appropriate movement of the substrate plate, a hydraulic system is used to drive the moveable substrate plate to scan. The motion track of substrate plate is set as two modes: jaggies and sinusoid. For comparison in the simulation, both modes were used for the scanning of the substrate plate in this study.
For simplicity, the two sprays are assumed to present the same mass flux distribution, even though different aluminum alloys are sprayed. It is assumed that the first alloy exhibits a silicon content of 12%, while there is no silicon in the second alloy. Since swing stroke is 0.2 m, the initial scanning period is defined for 1 s and the motion speed is determined as V x = 1.5 mm/s. The above parameters are determined under a typical spray-forming condition of the laboratory’s own spray forming facility.
D. Verification test
To verify the shape modeling established in this paper, gradient deposited plates have been spray formed from two sprays of different aluminum alloys using two scanning free-fall atomizers. Two streams of aluminum alloy melts were atomized and co-sprayed onto a horizontally moving substrate to form a flat deposited plate. The aluminum alloy for the lower layer of the deposited plate was 7075 alloy and the aluminum alloy for the upper layer was Al–12Si alloy. A transition zone between the two layers of different aluminum alloys was formed when the two sprays were overlapped.
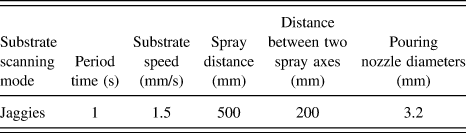
Based on the previous experiments, it is assumed that the mass flow rates of these two alloy melts were almost the same, and the same pouring nozzle diameter was adopted. Besides, other main processing parameters were listed in Table I.
The main process parameters in co-spray forming test.

III. RESULTS AND DISCUSSION
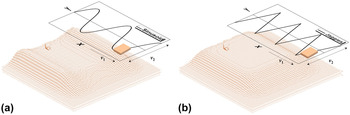
The shape of the deposited plate is calculated with two different motion tracks including sinusoid and jaggies, as shown in Fig. 3. In the sinusoid mode, the deposited amount of edge is large, while the center is concave as a valley. This will result in an uneven surface; thus, the sinusoid mode is negative for the manufacturing uniform plate. Whereas the shape of deposition is flat and the concave valley in the middle of the deposition disappears using the jaggies mode.
Shape of the plate with different motion tracks. (a) Sinusoid and (b) jaggies.

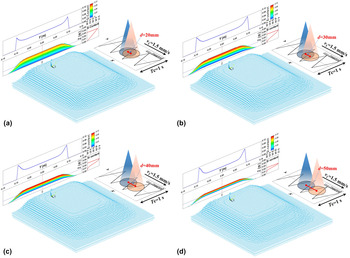
In the jaggies mode, the shape of the deposited plate is calculated with the center distance between two spray cones changing from 20 mm to 50 mm and the results are described in Fig. 4. Notably, an apparent step appears when the distance is 50 mm as shown in Fig. 4(d). In addition, it is found that the variation of distance does not show obvious effect on the shape of the deposited plate. Therefore, the effect of distance on the distribution of the deposited plate is simulated to determine the optimal one.
The simulated geometry and silicon element distribution of deposited plate with different center distances. (a) 20 mm, (b) 30 mm, (c) 40 mm, (d) 50 mm.

In x cross sections, the distribution of silicon content in the deposited plate was analyzed, and the simulation result is shown in Fig. 4. When the center distance is 20 mm, the silicon distribution shows approximate linear variations, and no obvious gradient transition zone is found between the two alloys. It is observed that the silicon distribution changes from linear to a smooth curve and a gradient zone presents when the center distance increases to 40 mm. As the distance increases to 50 mm, the curve of silicon distribution becomes steep and the gradient transition zone disappears. Remarkably, the silicon distribution in each layer is uniform and is unaffected by the variation of center distance. Therefore, the length of center distance determines the existence of both transition zone and gradient distribution. In addition, it directly affects the width of the transition zone.
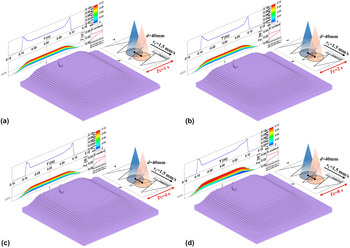
Figure 5 shows the simulated geometry and silicon distribution of the deposited plate with a different period time, respectively. The period time varies from 1 s to 8 s. It can be clearly seen that the simulated geometry does not change obviously with the increase in period time. Different from the geometry of the deposited plate, the silicon distribution varies with the increase in period time.
The simulated geometry and silicon element distribution of deposited plate in different period times. (a) 1 s, (b) 2 s, (c) 4 s, (d) 8 s.

The variation of silicon distribution is not obvious with the period times of 1 and 2 s. It is found that both the geometry and silicon distribution are similar when the period time varies in a small scope. As the period time increases to 4 s, the silicon distribution starts to fluctuate, and the component contents at the same height are no longer uniform, as shown in Fig. 5(c). When the period time is 8 s, the silicon distribution changes from a smooth curve to an irregular jaggies, as illustrated in Fig. 5(d). It is found that the period time exhibits no obvious influence on the geometry, the transition zone width, or the trend of silicon distribution variation. However, the silicon distribution is affected in height direction and is not uniform when the period time is larger than 4 s.
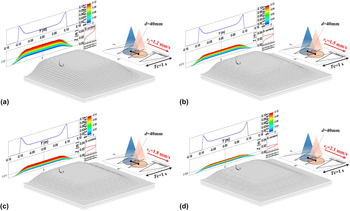
Figure 6 shows the simulated geometry and silicon distribution of deposited plate with different motion speeds. The speeds are defined as 1.2 mm/s, 1.5 mm/s, 1.8 mm/s, and 2.1 mm/s, respectively. It is evident from Fig. 6 that the thickness of the deposited plate decreases with increasing motion speed. Similarly, the width of the transition zone also decreases when the motion speed increases gradually, whereas the proportion of the transition zone keeps the same. The distribution of silicon content in every layer remains unchanged, and the variation trend of silicon content in the Z direction is not affected by the motion speed. As is well known, a fast speed will reduce the amount of deposition within the unit time, however, a relatively slow speed will display the opposite trend. In summary, the motion speed mainly affects the height of the deposit plate.
The simulated geometry and silicon element distribution of deposited plate in different motion speeds. (a) 1.2 mm/s, (b) 1.5 mm/s, (c) 1.8 mm/s, (d) 2.1 mm/s.

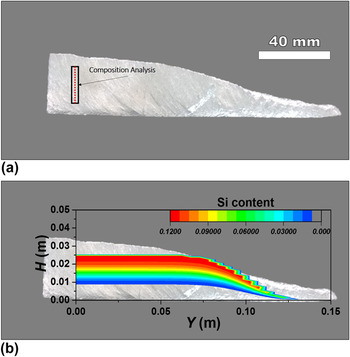
The actual and simulated contours of a spray-formed deposit (cross section of half part of the deposited plate) are shown in Fig. 7. The upper surface of the deposit is relatively flat. By and large, both contours are in good agreement, except the top center of the deposited plate.
Comparison of the simulated contour of a gradient deposited plate and experimental result. (a) Gradient deposited plate (cross section of half part), (b) comparison of simulated and actual contours.

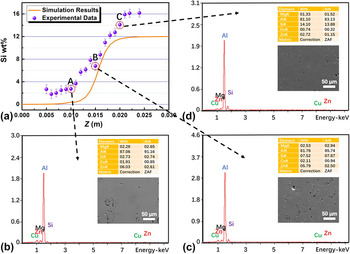
The simulated silicon element distribution is also compared with the experimental results, as shown in Fig. 8(a). A specimen was equidistantly divided into 20 regions in perpendicular direction as shown in Fig. 7(a), and the silicon composition distribution is achieved by calculating the silicon content of each region by means of EDS measurement. In these regions, A, B, and C are corresponding to the three selected heights of 5 mm, 15 mm, and 25 mm, respectively. The contents of every element and microstructures of the three selected regions are listed in Figs. 8(b)–8(d), respectively.
Comparison of the simulated Si element distribution of deposited plate and experimental results. (a) Comparison of simulated and experimental results, (b) contents of each element in region A, (c) contents of each element in region B, (d) contents of each element in region C.

A slight deviation between the simulated and experimental results can be observed obviously in Fig. 8(a). The experimental results of silicon content are slightly higher than the simulation results. This phenomenon may be explained that the assumption of atomized droplets of alloy flying in a straight line during deposition is just an ideal model; however, the actual mass flux distribution is very complex and not fully comply with the assumption, thus resulting in the deviation. Besides, this model ignores the influence of temperature field and diffusion; however, in the actual situation, the cooling rate of both the bottom and top of the deposit is relatively fast, and the diffusion is difficult to be carried out, while the temperature in the central zone of the deposit is high, resulting in a good elemental diffusion. Most of all, we found that the initial alloy droplets deposited on the substrate solidify very quickly and formed the bottom region of the deposited plate. In general, the bonding between the bottom region and the substrate is poor due to the thermal stress. Therefore, some parts of the deposited plate are cracked and fell off during the reciprocating motion of substrate, then leading to a small loss of the deposited alloy as well as a confusion of composition and devoting from the experimental data. Moreover, during the remelting process, a part of aluminum vapored as a result of high temperature burning. In addition, the uneven distribution of components in some regions may be another reason. The variation of a few percent is readily explained by the limitations of the EDS technique.
Gradient distribution trend of simulated results is in good accordance with the actual results. Regardless of these small deviations, the simulated results approximate to the experimental data. Accordingly, this modeling allows for the prediction of the shapes, dimensions, and element distributions of spray-formed gradient plate with acceptable deviation.
IV. CONCLUSIONS
A three-dimensional shape model based on the surface coordinate tracking method has been established for 7075/Al–Si bimetallic gradient composite plate which is manufactured by the co-spray forming process. The silicon element distribution of the deposited gradient plate has been simulated simultaneously as well. Based on this, the influence of co-spray forming process parameters on the shape and silicon element distribution of the deposited gradient plate has been investigated. The results are summarized as follows:
-
(1) The shape of the deposited plate is determined by the motion trajectory and advance speed of the substrate as well as center distance between the two spray cones. A normalized jaggies scanning mode is favorable for the formation of a flatter and uniform deposited plate. The increase of center distance will result in the shape variation of the deposited plate from flat to a step-like shape. The thickness of plate is decreased with an increased advance speed.
-
(2) The scanning period and advance speed of the substrate as well as the center distance between the two spray cones have important effects on the silicon element distribution of deposited plate. The width of transition zone decreases with the increase of center distance and advance speed. The composition of each layer fluctuates and deviates from the initial uniform distribution as the scanning period increases.
-
(3) The modeling and simulation of the co-spray forming of 7075/Al–Si bimetallic gradient composite plate have been verified by experimental investigations. The simulated and experimental results are in a good agreement. Bimetallic gradient plate can be manufactured successfully by the co-spray forming technique.
ACKNOWLEDGMENTS
This project was supported by the National Key Research and Development Program of China (2016YFB0700203), the National Natural Science Foundation of China (Grant Nos. 51375110, 51601109, and 51601110), and the China Postdoctoral Science Foundation (No. 2016M601563).