

Research on the causes of war has advanced rapidly by analyzing pairs of states through time. Who is likely to fight whom, and when? In this study we use information about the probability of armed interstate conflict to address another important question: why are some states heavily armed? Countries vary enormously in the resources they devote to the military. Economic size matters a lot, but the international security environment is also important. National military expenditures are affected by the occurrence and severity of militarized disputes and the spending of allies and adversaries, but these influences are known only after the fact. In tests covering virtually all countries during the second half of the twentieth century, we show that the probability of a militarized dispute, calculated prospectively using a standard model of armed interstate conflict drawn from liberal and realist theories, proves even more important than these ex ante influences. Our research clarifies the determinants of military spending and provides an important “external” testFootnote 1 of the liberal-realist model (LRM).
We begin with how we measure the threat environment for each country using the LRM. Aggregating the predicted probabilities of a fatal dyadic dispute yields an estimate of the annual probability that a country will become involved in serious armed interstate conflict. Then, we present empirical analyses of national military expenditures in which we consider additional influences on spending: arms races, the defense expenditures of friendly countries, actual military conflict, democracy, civil war, and national economic output.
The Liberal-Realist Model of Interstate Conflict
Research on the causes of war has increasingly relied on analyses of pooled dyadic time series in which the unit of analysis is the state of relations between two countries in a given year. The dependent variable is a fatal militarized interstate dispute (MID), which is an armed conflict in which at least one combatant dies.Footnote 2 The probability of a MID is taken to be a function of countries' political, economic, and military characteristics individually, and certain bilateral features such as trade, alliances, and geography. Our (nondirected) dyadic model of interstate conflict includes elements from both the liberal and the realist schools.Footnote 3 In keeping with previous work, we represent liberal theory using the political character of each state, assessed on an autocracy-democracy continuum, and the degree to which the states are economically interdependent. We capture the effect of political regimes using the lower and higher democracy scores.Footnote 4 Economic interdependence is represented by the lower bilateral trade to gross domestic product (GDP) ratio, indicating the degree to which the less constrained state is free to use military force.Footnote 5
In accordance with realist thought, we include the dyadic balance of power, a measure of states' ability to deploy forces abroad, an indicator of a defense pact or other security agreement, and geographical variables. The balance of power is captured by the relative size of the two countries (GDP large /GDP small + GDP large), which can be interpreted as the naïve probability of the larger state winning a military contest. To account for the ability of the more powerful state to project its military capabilities, we use the logarithm of its GDP in year t, normalized by gross world product to remove the long-term trend. We include an indicator of contiguity and the logarithm of the capital-to-capital distance separating the two states to capture the influence of geographic proximity. We also consider each dyad's historical experience of conflict, measured by the years of peace since its last fatal MID (peace years); but this correction for temporal dependence introduces serious statistical problems for our analysis of military expenditures (see below). Finally, we correct for variation over time in the number of states in the international system.
Estimates of the Onset of Militarized Interstate Disputes
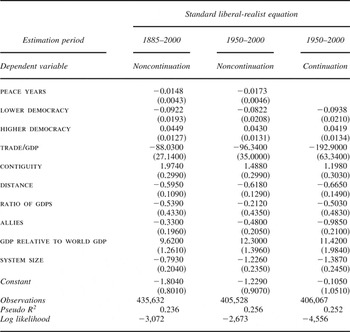
The first two columns of Table 1 report estimates for the LRM for the onset of a fatal MID, first for the years 1885–2000 and then just for the post–World War II period. The pooled time series of more than 12,000 pairs of states were analyzed using logistic regression analysis. There are 435,632 and 405,528 observations (dyad-years), respectively. Fixed effects are not included, and the robust standard errors are adjusted for clustering by dyad. In these first analyses, we consider only onsets, the first year of a dispute, and exclude subsequent years.Footnote 6 Results for the two sets of cases are similar and generally consistent with previous research: (1) two democracies are very peaceful, two autocracies less so, and mixed pairs fight a lot; (2) economic interdependence reduces conflict; (3) large powers are prone to fight because their interests are widespread and their capabilities for defending and promoting them substantial; (4) alliances tend to reduce the likelihood of military conflict, though good commercial relations give greater assurance of peace than does an explicit security agreement; (5) the relative balance of power does not significantly affect the probability of conflictFootnote 7; (6) a fatal dispute is much more likely for states that are geographically proximate; and (7) past violence increases the subsequent likelihood of conflict.
Standard LRM equation for onset of militarized interstate conflict

Notes: Each coefficient is shown with the standard error of the coefficient below in parentheses. Dependent variable (fatinv_nc) is a binary variable reflecting whether a dyad has a militarized interstate dispute (MID) in a year. The “noncontinuation” sample excludes the second and further years of a continuing dispute. The “continuation” sample includes all years.
There are, of course, unanswered questions in research using the LRM. Most variables in the LRM vary slowly over time, so our analyses do better in identifying the “dangerous dyads” than in predicting when those states will actually fight.Footnote 8 Thus, social scientists investigating the causes of conflict are like geophysicists who can identify earthquake-prone regions but have limited ability to predict the timing of particular events. Nevertheless, knowing where dangers are greatest shows where to erect quake-resistant buildings, and knowing where conflict is likely allows policymakers to concentrate political resources to mitigate or prevent it.
Estimates Including All Years of Conflict
The standard approach to estimating the LRM is to use only the onset of a dispute and omit observations that are continuations of the same conflict. This is appropriate when testing the hypotheses incorporated in the LRM, but not in this study. To explain annual military expenditures, we need estimates of the probability of conflict for each year. In addition, analyzing only the onset of disputes does not fully capture the severity of the external military threat. If states anticipate becoming involved in a protracted conflict, they should spend more on the military than if only a brief skirmish were expected. We thus need a “continuation sample” with all years of all disputes to create our ex ante measure of the international security environment, but including the variable peace years in the LRM with a continuation sample produces biased estimates of the regression coefficients because of the way that variable is constructed. Subsequent years of conflict are coded zero years of peace. Thus, with the continuation sample, we must either omit the peace years variable or create an instrumental variable for it using lagged values of the liberal and realist variables. In the online appendix, we show that simply omitting the peace years variable is preferable.Footnote 9 With this specification, differences in states' security environment, cross-nationally and through time, are purely the result of the predictors derived from liberal and realist theories.
The results of estimating the LRM with the continuation sample and peace years omitted are reported in column (3) of Table 1. The signs of the estimated coefficients and their general level of statistical significance are unchanged. The magnitudes of the coefficients are also reasonably stable. The biggest differences are for the variables trade/gdp and allies. The larger absolute value of the coefficient of the interdependence measure is a result of two factors: traders are particularly sensitive to the risk of military conflict and can change their operations quickly, and commerce has its greatest influence in reducing the risk of larger conflicts.Footnote 10 The magnitude of conflict is better represented in the continuation sample than in the noncontinuation sample, where only the onset of a dispute is recorded. This probably also accounts for the greater significance of allies.
We now break new ground by using the LRM to calculate an ex ante measure of the security threat each country faces. Using the statistical results of the standard LRM, we estimate the probability of militarized interstate conflict between states i and j in year t, which we denote as  i,j,tfatal The hat over p indicates that it is the predicted probability of an MID. We then combine the dyadic probabilities of conflict between state i and all other states to obtain a total probability of conflict for state i each year, i,tfatal. This is “mid p-hat.” It was calculated using the standard formula for a joint probability assuming independent probabilities, where

We then use these predictions of the likelihood of interstate conflict to explain differences in national military expenditures. Previous studies of military spending have used ex post data on the expenditures of foes or the actual incidence of conflict as proxies for the external threat. We know of no empirical study that incorporates a broad, ex ante measure of the international security environment of the kind employed here.
Explaining National Military Expenditures
The dependent variable in the following analyses is the logarithm of military spending in constant dollars measured with purchasing power parities (PPP), 1950–2000. Of course, information on military spending is subject to error due to differences in definition, the secrecy of national governments regarding this sensitive information, the lack of PPP rates specific to the military, and uncertainty regarding appropriate deflators for the time series. Data are also subject to strategic manipulation.Footnote 11 Such errors may lead to poorly determined equations and weak results, but they generally do not bias the coefficient estimates. To minimize the danger, we consulted two widely used sources. From 1989 onward we use Stockholm International Peace Research Institute's (SIPRI) data because it is the best documented. SIPRI data are highly correlated with the Correlates of War (COW) data. SIPRI no longer posts data for the Cold War years. The institute was sometimes criticized for underestimating the spending of communist countries, so for those years we use the COW numbers.Footnote 12 Some data necessary for estimating the LRM are unavailable after 2000. We analyze three samples: 165 countries, virtually all independent states with populations greater than 500,000; the 40 countries with the largest GDP in 1980; and 14 global and regional powers (United States, Canada, Mexico, Brazil, Great Britain, France, Spain, Germany, Italy, USSR/Russia, China, Japan, India, and Indonesia).
Though we focus on the impact of international threats on military spending, we also consider several other influences. The most important, of course, is the size of a nation's economy, as measured by real GDP. Additional variables fall into four categories.
Arms Races and Alliance Spillovers
Our first set of ex post geopolitical variables is designed to capture the effects of arms races with adversaries and spillover benefits from the expenditures of allies. The expenditures of potentially hostile powers may be taken by national leaders as evidence of a heightened threat that necessitates a greater commitment of resources to the military. Arms races have long been regarded as action-reaction cycles well modeled by game theory.Footnote 13 Expenditures of friendly states are also apt to influence a nation's military spending because alliances and other security agreements often carry a commitment for support.Footnote 14 Even without institutionalization, complementary foreign policies may lead to informal coordination in defense expenditures.
Consequently, we constructed two measures to gauge the influence of the contemporaneous military expenditures of other states, using the similarity of alliance commitments to distinguish friends from foes. The first is the total military spending of allies and other friendly states (friends_milex); the other (foes_milex) is the spending by states with different security arrangements. For each country, we ranked all other states in each year from high to low according to the similarity of their alliance portfolios.Footnote 15 We assume that countries with a similar set of allies have similar or complementary foreign policies and security interests so states above the median are thought to be friendly; those below, potential foes.Footnote 16 We use the logarithm of friends_milex and foes_milex in the estimations below. In addition to controlling for coordinated expenditures with friends and arms races with potential foes, these measures capture the transmission of military conflict through these channels. A state may spend more on its armed forces when either a friendly country or a hostile power is involved in a military conflict, even if it is not drawn immediately into the fighting.
Ongoing Conflict
We model the influence of actual ongoing armed conflict on military expenditures using two variables. The first of these additional ex post measures of the international security environment is the annual incidence rate of fatal disputes for a state over all its dyadic relations. This ex post variable (p_actual) is constructed analogously to mid p-hat so the estimated coefficients reported below are comparable. Like Lake,Footnote 17 we use fatal MIDs—rather than more severe, less frequent warsFootnote 18—to tap the effect on expenditures of a wide range of interstate conflicts.Footnote 19 Naturally, we expect states that experience higher incidences of disputes to spend more on their armed forces.
Military expenditures should also reflect the intensity of fighting. Therefore, we use a second gauge of actual ongoing conflict: the number of deaths a country's combatants suffered in all militarized disputes in a year, normalized by the country's population (fatalities).Footnote 20 States that experience higher levels of armed conflict should spend more.
In explaining national military expenditures, then, we distinguish the effect of the LRM's prospectively measured risk of armed conflict from the costs states incur when force is actually used. Sometimes deterrence fails, and the military must defend the country or its strategic interests; or states may chose to force compliance with their demands when coercive diplomacy proves inadequate. As Engels observed, battle is to power what cash is to credit. Consequently, national military expenditures should reflect both ex ante and ex post influences.
Democracy
A tradition of liberal thought going back to Kant suggests that the citizens of democratic countries will resist the diversion of resources to the military and away from private consumption or collective goods like public health and education. They may also fear that a strong military establishment will suppress civil liberties. A contemporary version of the theory argues that autocrats are able to extract private goods from rents associated with a successful use of military force internationally and impose much of the cost of fighting, and the price of any failures, on the general population. Hence autocracies should spend more on the military.Footnote 21 These direct effects on spending would be in addition to democracy's indirect benefit in making the international security environment less threatening.
Bureaucratic Inertia
Finally, military spending often exhibits great inertia, reacting only slowly to changing circumstances. There may be several reasons for this, including the lobbying power of vested interests, uncertainty regarding the permanence of change, and the difficulties of dismantling a system with a large overhead. We do not model such influences directly, but we anticipate in our analyses a partial adjustment of military spending (M) to the desired level (M*) by the process ΔM(t) = λ[M*(t) − M(t − 1)]. Inertial effects are captured by including M(t − 1), the lagged dependent variable (LDV), in the regression. This partial-adjustment model has the disadvantage that spending is assumed to adjust at the same rate to changes in any of the determining variables, but the advantage of parsimony is powerful.
Putting these several factors together, we get the following full specification:

where ifatal(t) is the probability of a fatal dispute derived from the LRM and the explanatory variable of particular interest.
Empirical Estimates of the Determinants of National Military Expenditures
To gauge the importance of the external environment, we start with a bivariate scatter plot of the mean probability of conflict, as assessed by the LRM, and the mean ratio of military spending to real GDP (Figure 1). All 165 countries, 1950–2000, are included and two groups are highlighted: the largest twenty by GDP and the second twenty. A positive relationship between the two variables is obvious; the correlation is 0.37 across all cases. The character of the security environment does seem to influence national military expenditures, but other forces are also at work.Footnote 22
Mean probability of conflict and military spending fraction for each state, 1950–2000

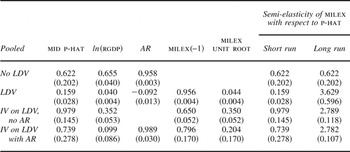
Table 2 reports the estimated coefficients from four pooled analyses of panel data for 165 countries, 1950–2000, for the simplest specification of our model. The effect of the international security environment (mid p-hat) on the logarithm of national military expenditures is estimated, controlling only for a country's economic size. Row (1) shows an analysis with no inertial effect but with a correction for autocorrelated errors. Row (2) accounts for inertia with an LDV and includes a correction for an AR(1) process. The use of an LDV when there is autocorrelation in the error term introduces bias in the estimated coefficients. We address this problem in rows (3) and (4) of Table 2 using an instrument for the LDV. Solving for military spending in the partial-adjustment model shows that it is a function of current and past values of the independent variables. We use two lags of mid p-hat and GDP as instruments for past military expenditures in rows (3) and (4). We found no improvement in the fit with additional terms. Row (3) does not adjust for an AR(1) process; row (4) does. Fixed effects are not included but are considered below.
Analyses of military expenditures, 1950–2000, all countries

Notes: Each coefficient is shown with the standard error of the coefficient below in parentheses. These show the results of equation (2) in the text using only mid p-hat, real GDP, and (in three cases) lagged military spending as independent variables. The different tests are described in the text. Row (3) is the preferred specification. The dependent variable is the logarithm of real military spending (milexp). The independent variables are the probability of a fatal militarized interstate conflict (mid p-hat, version b) and the logarithm of real GDP ln(rgdp). The column AR indicates an estimated first-order autoregressive process. milex(−1) is a lagged dependent variable. milex unit root tests for the difference of the military spending coefficient from 1. The last two columns show the semi-elasticities, defined as the percent change in military spending per unit change in the probability of a fatal dispute.
The specification in row (1) of Table 2 does not allow for partial adjustment to changing geopolitical circumstances, a process theoretically expected and historically evident; but it is apparent in row (2) that the estimated coefficient (0.956) of the LDV is badly biased, accounting almost completely for current military spending. Using the instrumented variable (IV) in rows (3) and (4) reduces the apparent influence of inertial forces substantially. The estimated coefficient of the LDV is important because it is λ in the adjustment equation described above; and (1 − λ) determines the long-run impact of the independent variables. The coefficients of mid p-hat are larger with the IV estimator than in the ordinary least squares (OLS) regressions. The bias of the OLS estimation reduces the apparent impact of the external security environment. In the column “milex unit root,” we report the difference between the coefficient on the LDV (λ) and unity and its standard error. The coefficient in row (2) is significantly different from 1.0 statistically, but it is uncomfortably close, whereas the coefficients in rows (3) and (4) are well below that value. Because of the biases in rows (1) and (2), we strongly prefer the analyses reported in the last two rows of Table 2. They provide very similar estimates of the important long-run effect of the security environment on military spending.
The last two columns of Table 2 show for each specification the semi-elasticities of military spending with respect to the LRM's estimate of the external threat. The short-run semi-elasticity is the estimated coefficient of mid p-hat. It is the percentage change in military spending of a unit change in the probability of a fatal militarized dispute. In row (3), it is about 1.0. We can derive the long-run elasticity by solving the regression equation for its steady state. If mid p-hat increases by an increment, we see that the long-run semi-elasticity is equal to the short-run semi-elasticity divided by (1 – λ). This indicates that the long-run elasticity is close to 3, as seen in the last column. The t-statistics for the four estimated coefficients of mid p-hat are high by conventional standards. For example, in row (3), it is 6.7.Footnote 23 Examination of the variance explained confirms that the combined influence of the security environment and GDP on military expenditures is substantial. The R 2 for row (1) (without an AR correction or LDV) is 0.78. The R 2 in each of the other equations is greater, but a correction for autoregression or an LDV inflates those values.
To illustrate the significance of these results, consider the differential effect on military expenditures of the security environments of three major countries in extremely challenging security environments (United States, Israel, USSR/Russia) and the three least threatened countries in our analysis (Fiji, New Zealand, and Solomon Islands). The high three averaged a 66.5 percent risk of experiencing serious armed conflict, more than eleven-fold the risk of the bottom three who averaged only 5.8 percent. According to our preferred estimate in row (3), this would lead to a difference in military spending as a percentage of GDP of a factor of 5.5 [= e2.8x(0.665−0.058)]. Thus, on the basis of the predictions of the LRM, the ratio of military expenditures to GDP for the three high-risk states should be five and one-half times that of the three least threatened. They were actually eight times as great on average, 1950–2000.Footnote 24 The international security environment is clearly an important influence on national military expenditures.
To be sure that our analyses capture the experience of big, influential states, we re-estimated the four regression specifications in Table 2 using only the forty countries with the largest GDP in 1980. The estimated semi-elasticities with respect to mid p-hat were somewhat smaller: the long-run effect was about 2.4 (versus 2.8 for all countries) for our preferred specification in row (3). We also ran an analysis limited to the fourteen global and regional powers, with similar results.
Analyses with all three sets of countries confirm that economic size powerfully influences military spending. In virtually all specifications, the long-run elasticity of military spending with respect to GDP is close to 1. For example, the long-run elasticity is estimated to be 1.0055 (± 0.0087) in row (3) of Table 2. The implication is that the ratio of military spending to GDP is essentially constant once the security environment is taken into account.
More Complete Specifications
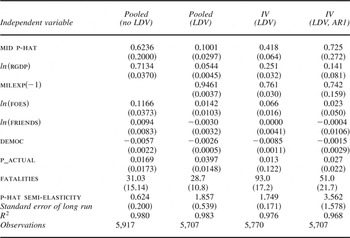
Until now we have considered a simplified version of equation (1) that includes only our measure of the external threat and GDP. We extend the analysis in two steps to include a larger array of influences. First, we add measures of the military spending of friends and foes to control for the effects of arms races and alliance commitments; we also include the autocracy-democracy variable. Table 3 reports the results for all countries. The estimated semi-elasticities of military spending with respect to the external threat are somewhat sensitive to the change in the specification. The long-run coefficient is now between 2.4 and 2.7, with the lower number holding for our preferred column (3). Controlling for the military expenditures of friends and foes captures important characteristics of a state's external security environment that are also represented in the LRM, but the defense spending of others is only known ex ante.
Analyses of the logarithm of military expenditures, 1950–2000, all countries, with additional control variables

Notes: Each coefficient is shown with the standard error of the coefficient below in parentheses. Key variables are defined in Table 2. Additional variables: friends_milex is the logarithm of the weighted military spending of those who are allied with the country; foes_milex is the logarithm of the weighted military spending of those not allied with the country; democ is the polity score. p-hat semi-elasticity is the semi-elasticity of the military expenditure/GDP ratio with respect to p-hat. The semi-elasticity is the proportional change in military spending per unit change in p-hat (a semi-elasticity of 2.5 indicates that an increase of 1 percentage point in the probability increases the military spending/GDP ratio by 2.5 percent, as from 0.1000 to 0.1025).
Interestingly, expenditures by potential adversaries are more influential than those by friendly countries. Arms races are important. In column (3) of Table 3, the short-run elasticity of military spending with respect to foes' spending is 0.10, while the long-run elasticity is 0.30. This indicates that a country increases its military spending by 1 percent in the short run and 3 percent in the long run if its potential adversaries increase their spending by 10 percent. Thus, arms races are unlikely to become unstable. Assuming that the coefficient is 0.30, and that the probability of conflict is 50 percent per year, military spending would double over time because of the action-reaction cycle.
Table 3 also shows that democracies spend less on the military than do autocracies, ceteris paribus. The results of analyses limited to the forty largest countries or global and regional powers, though not shown, were very similar. We consider the effects of the political character of national governments in greater detail below.
Next, we add two variables that reflect the seriousness of ongoing conflicts: our annual measure of a state's actual involvement in ongoing disputes and the total number of combatant fatalities it experienced each year, normalized by the population of the country. Table 4 shows the results of including these additional ex ante measures. The estimated semi-elasticities of military spending decline further, with the long-run estimate for our preferred equation in column (3) being about 1.7. The coefficient again drops because these measures of states' involvement in ongoing conflict pick up more of the explanatory power of mid p-hat.
Analyses of military expenditures, 1950–2000, all countries, with full specification

Notes: Each coefficient is shown with the standard error of the coefficient below in parentheses. Key variables are defined in Tables 2 and 3. p_actual is the ex post frequency of fatal MIDs aggregated as explained in the text; fatalities is the number of combatant fatalities divided by a country's population. p-hat semi-elasticity is defined in Table 3.
Tables 3 and 4 show that our prospective measure of the international security environment is correlated with several determinants of national military expenditures that are known only retrospectively, but the long-run effect on spending attributable solely to mid p-hat is still substantial even in the most complete model. It is remarkable that the predictions of the LRM are so influential with controls for arms races, the spending of allies, the incidence of ongoing disputes, and their intensity. Indeed, comparing the coefficients of mid p-hat and the actual rate of fatal MIDs (p_actual) indicates that our prospective measure exerts a much greater influence on military spending (0.42 versus 0.01 in column (3) of Table 4). States anticipate the risk that they will become involved in armed conflict and allocate resources accordingly. Those that exist in hostile security environments arm, whether or not they actually end up fighting. Military spending has some similarity to insurance in this regard, though unlike insurance, greater expenditures may precipitate an attack—a problem we address below.
In sum, the long-run semi-elasticities of military spending with respect to the probability of being involved in a fatal dispute are in the range of 2.0 to 3.0, depending on the sample, the estimator used, and the other explanatory variables in the specification. Thus, a 1 percentage point increase in the aggregate probability of a fatal militarized dispute leads to a 2 to 3 percent increase in a country's military expenditures.
Democracy and Military Spending
It is worth considering further the effect of democracy on national military expenditures. A simple regression of cross-national means provides a semi-elasticity of military spending with respect to our measure of democracy of −0.044 (± 0.011). Polity scores range from −10 for complete autocracy to 10 for a thoroughly democratic country. This suggests that autocracies will spend about 140 percent (= 100 × [exp(.88)-1]) more than democracies on the military. The estimates of the impact of democracy on spending vary in different specifications reported in Tables 3 and 4 primarily because democracy is correlated with the other independent variables. A semi-elasticity of −0.03 is a reasonable mid-range estimate for the long-run effect, indicating that complete autocracies spend 80 percent more on the military than true democracies. We found no evidence that military dictatorshipsFootnote 25 spend more than other autocracies.
It is worth emphasizing that the estimated partial effect of democracy on military spending is in addition to its effect on the external security environment, which is also substantial. Using a simple regression of the means again, we found that the semi-elasticity of military spending with respect to the polity variable, with mid p-hat excluded, is −0.59. This suggests that the total impact of complete autocracy relative to complete democracy is to increase military spending by 220 percent. These results were less robust than our estimates of the impact of the threat environment, but they indicate clearly that democracies spend substantially less on the military than do autocracies.
Civil War and Military Spending
Typically civil wars last longer than international conflicts and are more likely to reignite after short periods of peaceFootnote 26 But how much do they influence military spending? To find out, we estimated the impact of the internal security environment on national military expenditures, using Sambanis's estimate of the annual probability of a serious civil war.Footnote 27 We re-estimated our preferred specification (an instrumented LDV with no AR correction) with this measure and the variables in Tables 2, 3, and 4 in turn. The impact of internal security on military spending is less than that of the external threat by a factor of around 10. For example, if the probability of a civil war is added to the parsimonious model in Table 2, the coefficient of mid p-hat is 0.81 (± 0.12) while the civil war coefficient is 0.08 (± 0.03). If we account for autocorrelation (as in row (4) in Table 2, for example), the estimated coefficient of the civil war variable is usually not significantly different from zero and is sometimes negative. Likely it is contingent on leaders' assessments about whether they are safer with a large military establishment or with one that is small but reliable.
Does the Endogeneity of Conflict to Military Spending Bias Our Results?
We have assumed in our analyses that the threat environment is exogenous to national military expenditures. Military spending does not appear in our LRM of interstate conflict. The balance of power and states' power-projection capabilities are measured using GDP, so there is no mechanism for defense expenditures to influence the probability of interstate conflict, possibly even creating an unstable arms race where higher expenditures increase the probability of conflict, further increasing military spending, and so on. There are divergent views on whether and how military spending affects conflict.Footnote 28Table 1 suggests that increasing national capabilities can either raise or lower the danger of war depending on how that affects the dyadic balance of power and states' ability to project their power abroad. Across all dyads, the cumulative effect is uncertain, increased spending raising the risk of conflict in some cases and reducing it in others. Given the complex way in which conflict is endogenous to national capabilities, our analyses of military expenditures are unlikely to be systematically biased.
To confirm the stability of our results, we first re-estimated the equations in Table 1 substituting military expenditures for GDP when calculating both of the realists' power-based measures. Because military spending is highly correlated with national output, and fundamental determinants of GDP like population and industry also influence states' security, this will overstate the influence of military expenditures on the likelihood of conflict. We also considered whether these re-estimated coefficients were biased because military spending increases during years of conflict. To address this, we used GDP as an instrumental variable for spending and again re-estimated the LRM. We relied on a linear probability model because no IV software with the various robust estimators is readily available for logistic regressions. The results indicated that the estimated coefficients in Table 1 are generally stable. The signs of the estimated coefficients were unchanged in the alternative estimations, and most remained within 3 percent of the values calculated using GDP as the measure of power. The pseudo R 2 changed little, and both sets of newly estimated country-year probabilities of a fatal dispute (mid p-hat) were virtually identical to those calculated with GDPs.
A final statistical issue arises because of the two-stage nature of our analyses. We treat mid p-hat as fixed in assessing the determinants of military spending. In reality, it is an estimate and will have sampling error, which may cause the standard errors of the coefficients of mid p-hat to be underestimated. To test this possibility, we undertook a bootstrap analysis for our two-equation system. We resampled the variables in the first stage, calculated new predicted probabilities, combined those with the other variables in the military spending equation, and then bootstrapped the second stage as well. We did this for the specification in row (2) of Table 2. Our findings indicate that the calculated standard errors are underestimated by only about 6 percent.Footnote 29
Fixed Effects Versus Pooled Data?
A potential problem in any regression analysis is the omission of important explanatory variables correlated with the error term. We have treated our state-year observations as panel data without country fixed effects for several reasons. First, there are strong theoretical grounds for believing that differences in the liberal and realist variables, both across countries and through time, significantly affect the probability of interstate conflict and, hence, national military expenditures. Also, with country fixed effects, much of the difference from trend in individual country's defense spending may be determined by cyclical features of the economy and other short-term factors. Thus, fixed effects are apt to capture correlations of military spending with the business cycle, creating a form of simultaneous-equation bias that would be difficult to correct. Omitting fixed effects helps eliminate such a confounding influence.
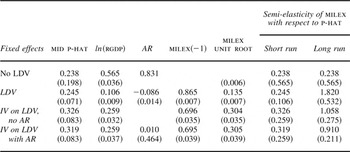
Despite these reservations, we report in Table 5 estimates of our simplest model of military expenditures with country fixed effects. Not surprisingly, the coefficients for mid p-hat are smaller than before; but the estimates are still quite significant statistically. The long-run semi-elasticities are about 1.0 in rows (3) and (4). Comparing our pooled analyses with those that incorporate fixed effects leads to the following conclusion: The probability of becoming involved in a fatal dispute varies greatly across countries, and those differences have large effects on military expenditures. If we examine only changes in the threat environment for individual countries over time, the influence of the international environment is smaller, about one-third of the purely cross-sectional effect calculated using mean values of the variables. This is undoubtedly due in part to temporal imprecision in the LRM itself, which we noted earlier; and in part to variability from country to country, or even over time for the same country, in the lag with which military spending adjusts to the international security environment. Thus, the substantial influence of the external threat on military expenditures, reported in Tables 2, 3, 4, and 5, is primarily the result of cross-national differences rather than variation through time. In all our tests, however, including those with country fixed effects, the external security environment significantly affects national military expenditures.
Analyses of military expenditures, 1950–2000, all countries, with country fixed effects

Note : Each coefficient is shown with standard error of the coefficient below in parentheses.
Finally, Figures 2 and 3 show the probability of conflict (mid p-hat) and the ratio of military expenditures to GDP over time for eight countries, graphically illustrating our key finding for particular countries. The scale for mid p-hat runs from 0 to 1.0 and is on the left of each graph; that for the military spending to GDP ratio is on the right, ranging from 0 to 30 percent. Because all countries are represented on the same scales, it is easy to see the great differences in their threat environments and in their military preparations. Note the high continuity over time in both variables for most of these countries; but when important environmental shocks occur, military spending can adjust quickly. In particular, for all countries except China, the end of the Cold War brought a significant decline in the probability of a dispute. This is surely the most important “peace dividend” from the unexpected end of that dangerous period.
Probability of conflict and military spending for four high-conflict countries
Note: The graphs plot military spending divided by GDP (MILEXPRATIO, right scale) and the predicted probability of conflict for the contry (MID P-hat, left scale), with all countries on the same scale.

Probability of conflict and military spending for four lower-conflict countries
Note: The graphs plot military spending divided by GDP (MILEXPRATIO, right scale) and the predicted probability of conflict for the contry (MID P-hat, left scale), with all countries on the same scale.

The four graphs in Figure 2 show countries with threatening security environments and high levels of military spending. For the United States, USSR/Russia, and China, the data seem to reflect their condition as great powers with extensive military capabilities and political/economic interests. USSR/Russia became less threatened with the liberalization and disintegration of the Soviet Union. After the Cold War, China's security environment became more fraught because of its extraordinary economic growth. Yet that growth allowed China to increase rapidly its absolute level of military spending while keeping the military's share of GDP stable. Israel, though not a great power, faced a threatening external environment throughout the period. Its military spending was also high, rising sharply with the Yom Kippur War in the 1970s and again with the invasion of Lebanon.
Figure 3 shows countries with lower military expenditures. Argentina experienced a significant decline in both its external threat and military spending following the Falklands war and the fall of its military dictatorship and those of its neighbors. South Africa shows a similar pattern after the end of apartheid. Spain's security environment improved and military spending declined with its democratization and integration into Europe starting in the late 1970s. Japan maintained its military expenditures at about 1 percent of GDP because of constitutional constraints and a protective alliance with the United States.
Finally, we give special attention to the United States because of its pre-eminent position. First, we added a dummy variable for the United States to the specification in Table 4 but without the measures of ongoing conflict. The coefficient was small and statistically insignificant. On the other hand, identifying all countries in a fixed effects analysis indicated that the United States spends about 80 percent more than theoretically expected. Thus, evidence for American exceptionalism is mixed.Footnote 30 Despite being a democracy in a relatively benign neighborhood, the United States trails only Israel in our mid p-hat estimate and in the actual number of fatal MIDs in which it was involved. Other big powers (China, India, USSR/Russia) also rank very high on both measures.
Conclusion
We used a widely accepted model of armed interstate conflict, derived from liberal and realist theories of international relations, to investigate the relationship between a country's security environment and its military spending. A primary result of our study is an estimate of the prospective probability that a country will become involved in a fatal militarized interstate dispute. This probability is estimated using the LRM model of dyadic conflict. No previous empirical study of national military expenditures has incorporated such a comprehensive, prospectively generated measure of the external threat. We focused on a nearly exhaustive sample of 165 countries for the post–World War II period, 1950–2000, but confirmed our findings with analyses of the forty largest countries and fourteen global and regional powers.
Our research provides important external evidence for the LRM and sheds new light on the determinants of military expenditures. The risk of involvement in a fatal dispute varies greatly across countries, and those differences have large substantive effects on nations' allocations of resources to their armed forces. Indeed, the probability that a state will become involved in a fatal militarized dispute, assessed ex ante by the LRM, has a greater influence on military spending than does any of several measures of the international security environment known only after the fact: the actual incidence of states' involvement in serious interstate conflict, the intensity of those conflicts as measured by combatant fatalities, or the contemporaneous military expenditures of friends or potential foes. Our best estimate is that a 1 percentage point increase in the probability of a fatal dispute leads to an increase in military spending of 3 percent.
Several other findings are worth noting. Highly autocratic regimes spend much more on the military than do democracies or governments with mixed political characteristics. An increase in military spending by potential adversaries has a small short-term effect, but an “arms race” could double military expenditures over the long term through an action-reaction cycle. The threat of international conflict is much more influential on defense spending than is the danger of civil war. And, not surprisingly, the level of national output (measured by real GDP) has a powerful effect. Finally, spending shows significant inertia. Only 35 percent of the response to a shock in the external threat, GDP, or the other determinants of military expenditures takes place in the first year. This may be due to uncertainty regarding the permanence of change, the large sunk costs associated with national defense establishments, or mere bureaucratic inertia.